. 2017 Oct;64(10):1450-1464.
doi: 10.1109/TUFFC.2017.2729944. Epub 2017 Jul 20.

The Impact of Model-Based Clutter Suppression on Cluttered, Aberrated Wavefronts

The Impact of Model-Based Clutter Suppression on Cluttered, Aberrated Wavefronts

Kazuyuki Dei et al. IEEE Trans Ultrason Ferroelectr Freq Control. 2017 Oct.

Abstract

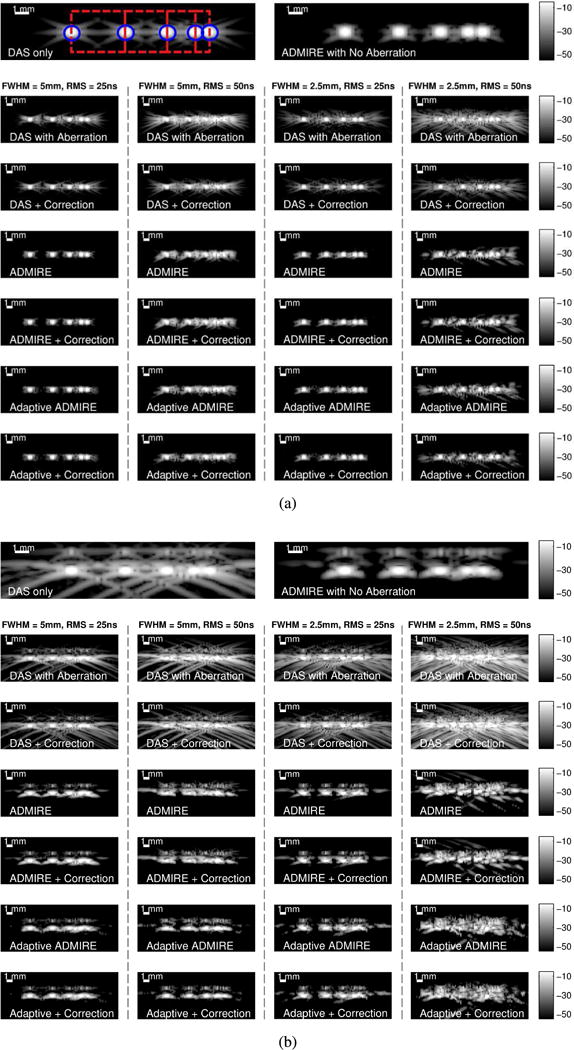
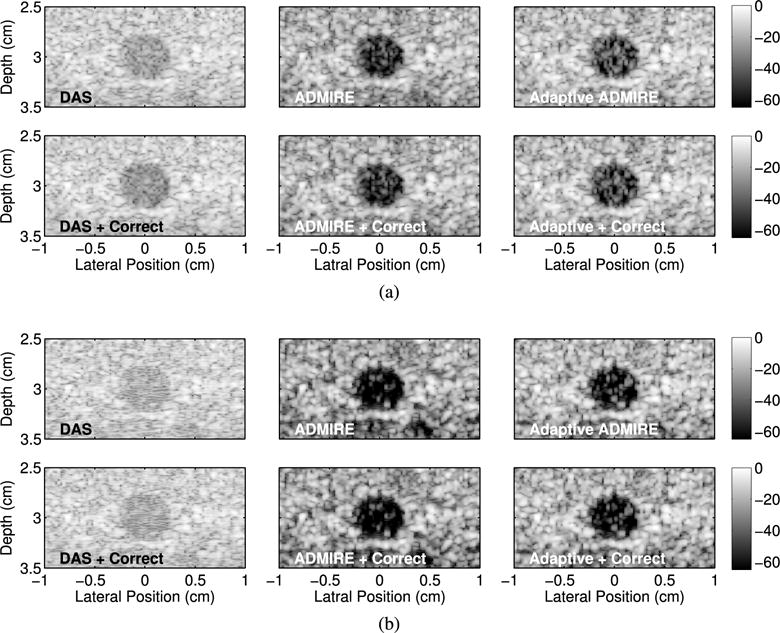
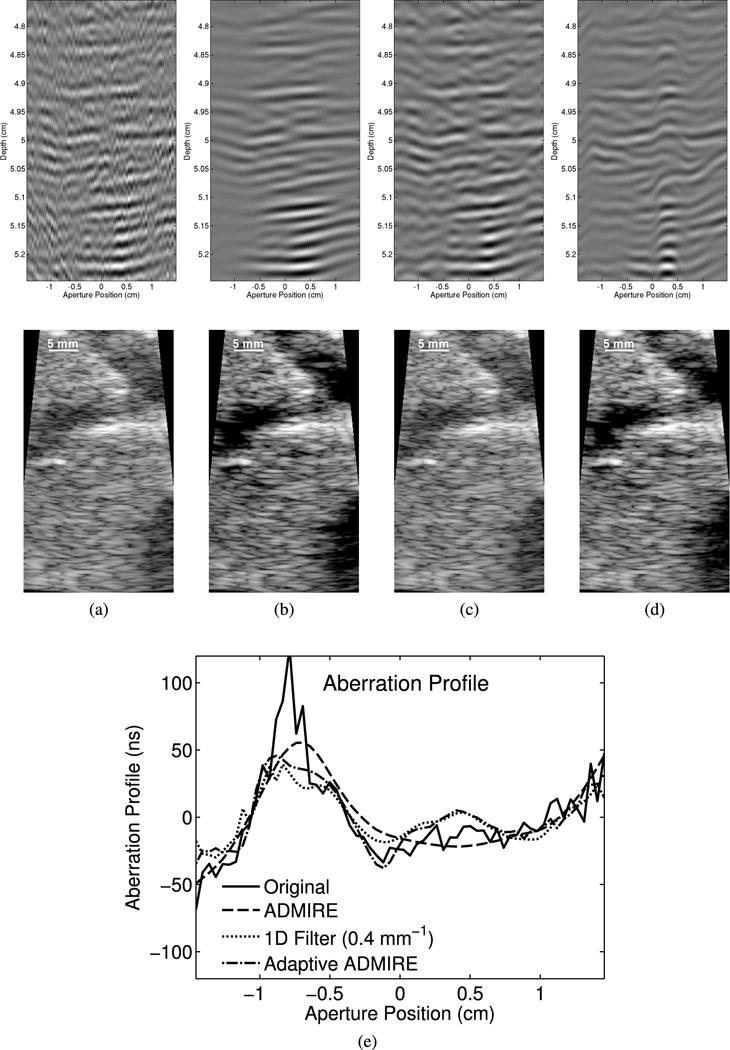
Recent studies reveal that both phase aberration and reverberation play a major role in degrading ultrasound image quality. We previously developed an algorithm for suppressing clutter, but we have not yet tested it in the context of aberrated wavefronts. In this paper, we evaluate our previously reported algorithm, called aperture domain model image reconstruction (ADMIRE), in the presence of phase aberration and in the presence of multipath scattering and phase aberration. We use simulations to investigate phase aberration corruption and correction in the presence of reverberation. As part of this paper, we observed that ADMIRE leads to suppressed levels of aberration. In order to accurately characterize aberrated signals of interest, we introduced an adaptive component to ADMIRE to account for aberration, referred to as adaptive ADMIRE. We then use ADMIRE, adaptive ADMIRE, and conventional filtering methods to characterize aberration profiles on in vivo liver data. These in vivo results suggest that adaptive ADMIRE could be used to better characterize a wider range of aberrated wavefronts. The aberration profiles' full-width at half-maximum of ADMIRE, adaptive ADMIRE, and postfiltered data with 0.4- mm-1 spatial cutoff frequency are 4.0 ± 0.28 mm, 2.8 ± 1.3 mm, and 2.8 ± 0.57 mm, respectively, while the average root-mean square values in the same order are 16 ± 5.4 ns, 20 ± 6.3 ns, and 19 ± 3.9 ns, respectively. Finally, because ADMIRE suppresses aberration, we perform a limited evaluation of image quality using simulations and in vivo data to determine how ADMIRE and adaptive ADMIRE perform with and without aberration correction.


Figures

Fig. 1
Fig. 1
Adaptive ADMIRE data flow is illustrated. Aberration profiles are estimated from the data after spatial filtering (LP filter), while the ADMIRE model-fit is applied to the unfiltered channel data. Estimated aberration profiles are used to adaptively update the original ADMIRE model.
Fig. 2
Fig. 2
Simulations in the presence of phase aberration (No Clutter), and in the presence of multipath scattering and phase aberration with three different clutter levels (SCR = 0, 10 and 20 dB), having (a) a point target and (b) diffuse scattering. Four wavefronts (left) in each case of simulations, with corresponding estimated aberration profiles (right), are shown.
Fig. 3
Fig. 3
Simulations in the presence of phase aberration for a point target using (a) ADMIRE and (c) adaptive ADMIRE, and for diffuse scattering using (b) ADMIRE and (d) adaptive ADMIRE. Three wavefront reconstructions are shown for three different degrees of freedom in the model-fit (left). The error of measured aberration profiles is quantified as a function of degrees of freedom (right).
Fig. 4
Fig. 4
Simulation in the presence of multipath scattering and phase aberration with three different clutter levels (SCR = 0, 10 and 20 dB) for a point target using (a) ADMIRE and (c) adaptive ADMIRE, and for diffuse scattering using (b) ADMIRE and (d) adaptive ADMIRE. Each clutter level shows three wavefront reconstructions for three different degrees of freedom in the model-fit. The errors of measured aberration profiles as a function of degrees of freedom are illustrated (lower right).
Fig. 5
Fig. 5
FWHM (left) and RMS (right) errors from diffuse scattering simulations in the presence of multipath scattering and phase aberration with SCR = 0, 10 and 20 dB, using (a) ADMIRE and (b) adaptive ADMIRE. The aberration level is FWHM = 5.0 ± 0.1 mm and RMS = 50 ns.
Fig. 6
Fig. 6
Root-mean-square errors (RMSE) of FWHM (left) and RMS (right) quantified with aberration profiles estimated from post-filter and post-adaptive ADMIRE channel data in the presence of aberration and in the presence of clutter and aberration, using (a) a point target and (b) diffuse scattering simulations. The level of aberrated wavefronts are FWHM = 5.0 ± 0.1 mm and RMS = 50 ns. The RMSE values of FWHM/RMS are compared with three various spatial cutoff frequencies of 0.2 mm1, 0.4 mm1 and 0.6 mm1 including an unfiltered case. The degrees of freedom when implementing ADMIRE and adaptive ADMIRE are in a range between 50 and 70.
Fig. 7
Fig. 7
The simulated wire phantom images on resolution target simulations are presented. Four blue circles are the areas used to measure power of enveloped signal, while four sections enclosed by the red dashed lines are the areas used to measure off-axis clutter energy, for lateral separation intervals of 4, 3, 2 and 1 mm, respectively. Two images on the top row are the resolution phantoms of normal delay-and-sum (DAS) and ADMIRE with no phase aberration, respectively. Four sets of the simulated resolution phantom images with different aberrator strengths at (a) focus at the target depth, (b) focus past the target depth are also shown.
Fig. 8
Fig. 8
The results of measured energy suppression for several lateral separation lengths are shown as boxplots, including four sets of different aberration levels. Each set of results from the cases at (a) focus at the target depth, (b) focus past the target depth includes DAS only, ADMIRE with no aberration, 12 realizations for DAS with aberration, post-ADMIRE and post-adaptive ADMIRE with and without phase aberration correction applied. Aberration profiles are estimated from the filtered data using a spatial cutoff frequency of 0.4 mm1.
Fig. 9
Fig. 9
The matched simulated anechoic cyst phantom images formed after applying DAS, ADMIRE and adaptive ADMIRE with and without aberration correction in the presence of aberrated wavefronts with FWHM = 2.5 mm and RMS = 50 ns strength, in the cases of (a) uncluttered and (b) SCR = 0 dB cluttered environments, respectively.
Fig. 10
Fig. 10
The results of simulated anechoic cyst image quality metrics quantifying (a) contrast and (b) CNR for uncluttered and SCR = 0 dB clutter scenarios, respectively. There are 6 independent speckle realizations prepared for this simulation.
Fig. 11
Fig. 11
The wavefronts and corresponding B-mode images of (a) the original in vivo data, (b) ADMIRE, (c) 1D Filter (0.4 mm1cutoff) and (d) adaptive ADMIRE are shown, along with (i) the corresponding estimated aberration profiles. The results indicate that ADMIRE, specifically, appears to smooth the wavefront and suppresses aberration while adaptive ADMIRE seems to preserve aberration so it can be characterized more accurately.
Fig. 12
Fig. 12
The results of characterization of estimated aberration profiles from in vivo data are shown as boxplots. Results are shown for the original in vivo data, post-ADMIRE, post-adaptive ADMIRE and post-filtered data with three various spatial cutoff frequencies (0.6, 0.4 and 0.2 mm1). Aberration profiles are characterized by (a) the autocorrelation length full-width at half-maximum (FWHM) and (b) the root-mean square (RMS).
Fig. 13
Fig. 13
Contrast and contrast-to-noise ratio (CNR) with algorithms are plotted as a function of contrast and CNR of the normal B-mode image. There are 13 contrast and CNR measurements obtained from each algorithm. (a) Contrast, (b) CNR

References

    1. Bushberg JT, Boone JM. The essential physics of medical imaging. Lippincott Williams & Wilkins; 2011.
    1. Anderson ME, Trahey GE. The direct estimation of sound speed using pulse–echo ultrasound. The Journal of the Acoustical Society of America. 1998;104(5):3099–3106. - PubMed
    1. Anderson M, McKeag M, Trahey G. The impact of sound speed errors on medical ultrasound imaging. The Journal of the Acoustical Society of America. 2000;107(6):3540–3548. - PubMed
    1. Flax S, O’Donnell M. Phase-aberration correction using signals from point reflectors and diffuse scatterers: Basic principles. Ultrasonics, Ferroelectrics, and Frequency Control, IEEE Transactions on. 1988;35(6):758–767. - PubMed
    1. Pinton G, Trahey GE, Dahl J. Erratum: Sources of image degradation in fundamental and harmonic ultrasound imaging using nonlinear, full-wave simulations. Ultrasonics, Ferroelectrics, and Frequency Control, IEEE Transactions on. 2011;58(6):1272–1283. - PMC - PubMed

Publication types