Cerebrovascular pressure reactivity monitoring using wavelet analysis in traumatic brain injury patients: A retrospective study
- PMID: 28742798
- PMCID: PMC5526510
- DOI: 10.1371/journal.pmed.1002348
Cerebrovascular pressure reactivity monitoring using wavelet analysis in traumatic brain injury patients: A retrospective study
Abstract
Background: After traumatic brain injury (TBI), the ability of cerebral vessels to appropriately react to changes in arterial blood pressure (pressure reactivity) is impaired, leaving patients vulnerable to cerebral hypo- or hyperperfusion. Although, the traditional pressure reactivity index (PRx) has demonstrated that impaired pressure reactivity is associated with poor patient outcome, PRx is sometimes erratic and may not be reliable in various clinical circumstances. Here, we introduce a more robust transform-based wavelet pressure reactivity index (wPRx) and compare its performance with the widely used traditional PRx across 3 areas: its stability and reliability in time, its ability to give an optimal cerebral perfusion pressure (CPPopt) recommendation, and its relationship with patient outcome.
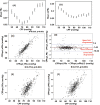
Methods and findings: Five hundred and fifteen patients with TBI admitted in Addenbrooke's Hospital, United Kingdom (March 23rd, 2003 through December 9th, 2014), with continuous monitoring of arterial blood pressure (ABP) and intracranial pressure (ICP), were retrospectively analyzed to calculate the traditional PRx and a novel wavelet transform-based wPRx. wPRx was calculated by taking the cosine of the wavelet transform phase-shift between ABP and ICP. A time trend of CPPopt was calculated using an automated curve-fitting method that determined the cerebral perfusion pressure (CPP) at which the pressure reactivity (PRx or wPRx) was most efficient (CPPopt_PRx and CPPopt_wPRx, respectively). There was a significantly positive relationship between PRx and wPRx (r = 0.73), and wavelet wPRx was more reliable in time (ratio of between-hour variance to total variance, wPRx 0.957 ± 0.0032 versus PRx and 0.949 ± 0.047 for PRx, p = 0.002). The 2-hour interval standard deviation of wPRx (0.19 ± 0.07) was smaller than that of PRx (0.30 ± 0.13, p < 0.001). wPRx performed better in distinguishing between mortality and survival (the area under the receiver operating characteristic [ROC] curve [AUROC] for wPRx was 0.73 versus 0.66 for PRx, p = 0.003). The mean difference between the patients' CPP and their CPPopt was related to outcome for both calculation methods. There was a good relationship between the 2 CPPopts (r = 0.814, p < 0.001). CPPopt_wPRx was more stable than CPPopt_PRx (within patient standard deviation 7.05 ± 3.78 versus 8.45 ± 2.90; p < 0.001). Key limitations include that this study is a retrospective analysis and only compared wPRx with PRx in the cohort of patients with TBI. Prior prospective validation is required to better assess clinical utility of this approach.
Conclusions: wPRx offers several advantages to the traditional PRx: it is more stable in time, it yields a more consistent CPPopt recommendation, and, importantly, it has a stronger relationship with patient outcome. The clinical utility of wPRx should be explored in prospective studies of critically injured neurological patients.
Conflict of interest statement
ICM+ Software is licensed by Cambridge Enterprise, Cambridge, UK,
Figures


Similar articles
-
Wavelet pressure reactivity index: a validation study.J Physiol. 2018 Jul;596(14):2797-2809. doi: 10.1113/JP274708. Epub 2018 Jun 13. J Physiol. 2018. PMID: 29665012 Free PMC article.
-
Pressure autoregulation monitoring and cerebral perfusion pressure target recommendation in patients with severe traumatic brain injury based on minute-by-minute monitoring data.J Neurosurg. 2014 Jun;120(6):1451-7. doi: 10.3171/2014.3.JNS131500. Epub 2014 Apr 18. J Neurosurg. 2014. PMID: 24745709
-
Short pressure reactivity index versus long pressure reactivity index in the management of traumatic brain injury.J Neurosurg. 2015 Mar;122(3):588-94. doi: 10.3171/2014.10.JNS14602. Epub 2014 Nov 28. J Neurosurg. 2015. PMID: 25423266
-
Pressure Reactivity-Based Optimal Cerebral Perfusion Pressure in a Traumatic Brain Injury Cohort.Acta Neurochir Suppl. 2018;126:209-212. doi: 10.1007/978-3-319-65798-1_43. Acta Neurochir Suppl. 2018. PMID: 29492563
-
Alternative continuous intracranial pressure-derived cerebrovascular reactivity metrics in traumatic brain injury: a scoping overview.Acta Neurochir (Wien). 2020 Jul;162(7):1647-1662. doi: 10.1007/s00701-020-04378-7. Epub 2020 May 8. Acta Neurochir (Wien). 2020. PMID: 32385635 Review.
Cited by
-
Wavelet Autoregulation Monitoring Identifies Blood Pressures Associated With Brain Injury in Neonatal Hypoxic-Ischemic Encephalopathy.Front Neurol. 2021 Apr 28;12:662839. doi: 10.3389/fneur.2021.662839. eCollection 2021. Front Neurol. 2021. PMID: 33995258 Free PMC article.
-
Multimodal Assessment of Cerebral Autoregulation and Autonomic Function After Pediatric Cerebral Arteriovenous Malformation Rupture.Neurocrit Care. 2021 Apr;34(2):537-546. doi: 10.1007/s12028-020-01058-3. Epub 2020 Aug 4. Neurocrit Care. 2021. PMID: 32748209
-
Assessment of Optimal Arterial Pressure with Near-Infrared Spectroscopy in Traumatic Brain Injury Patients.Adv Exp Med Biol. 2022;1395:133-137. doi: 10.1007/978-3-031-14190-4_23. Adv Exp Med Biol. 2022. PMID: 36527627 Free PMC article.
-
Association Between the Cerebral Autoregulation Index (Pressure Reactivity), Patient's Clinical Outcome, and Quality of ABP(t) and ICP(t) Signals for CA Monitoring.Medicina (Kaunas). 2020 Mar 20;56(3):143. doi: 10.3390/medicina56030143. Medicina (Kaunas). 2020. PMID: 32245122 Free PMC article.
-
Inducing oscillations in positive end-expiratory pressure improves assessment of cerebrovascular pressure reactivity in patients with traumatic brain injury.J Appl Physiol (1985). 2022 Sep 1;133(3):585-592. doi: 10.1152/japplphysiol.00199.2022. Epub 2022 Jul 7. J Appl Physiol (1985). 2022. PMID: 35796613 Free PMC article.
References
-
- Thurman DJ, Alverson C, Dunn K a, Guerrero J, Sniezek JE. Traumatic brain injury in the United States: A public health perspective. J Head Trauma Rehabil. 1999;14: 602–15. doi: 10.1097/00001199-199912000-00009 - DOI - PubMed
-
- JF K. Epidemiology of head injury In: Cooper PR, ed. Head injury. 3rd ed Baltimore: Williams & Wilkins; 1993.
-
- Donnelly J, Budohoski KP, Smielewski P, Czosnyka M. Regulation of the cerebral circulation: bedside assessment and clinical implications. Crit Care. 2016;20: 129 doi: 10.1186/s13054-016-1293-6 - DOI - PMC - PubMed
-
- Lassen N. Cerebral blood flow and oxygen consumption in man. Physiol Rev. 1959;39: 183–238. - PubMed
-
- Le Roux P, Menon DK, Citerio G, Vespa P, Bader MK, Brophy GM, et al. Consensus summary statement of the International Multidisciplinary Consensus Conference on Multimodality Monitoring in Neurocritical Care: A statement for healthcare professionals from the Neurocritical Care Society and the European Society of Intensive. Intensive Care Med. 2014; 1189–1209. - PubMed
Publication types
MeSH terms
Grants and funding
LinkOut - more resources
Full Text Sources
Other Literature Sources
Medical

