

The relationship between movement speed and duration during soccer matches
- PMID: 28742832
- PMCID: PMC5526535
- DOI: 10.1371/journal.pone.0181781
The relationship between movement speed and duration during soccer matches
Abstract
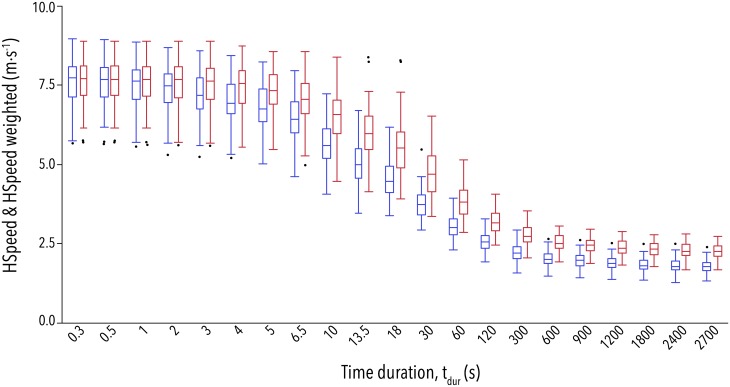
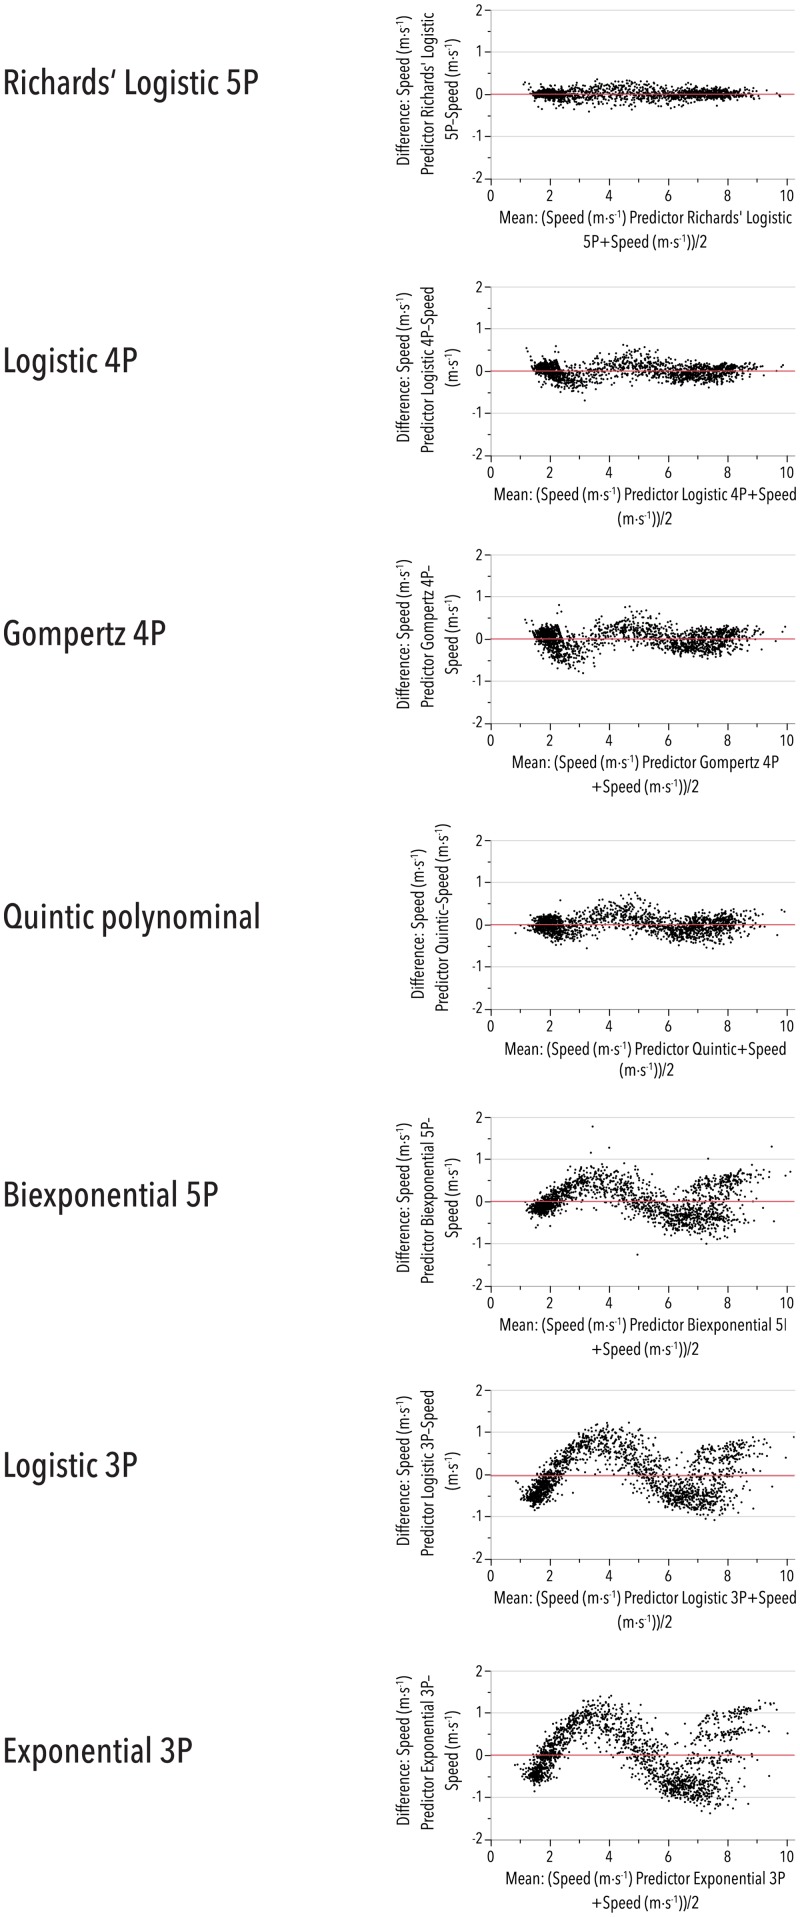
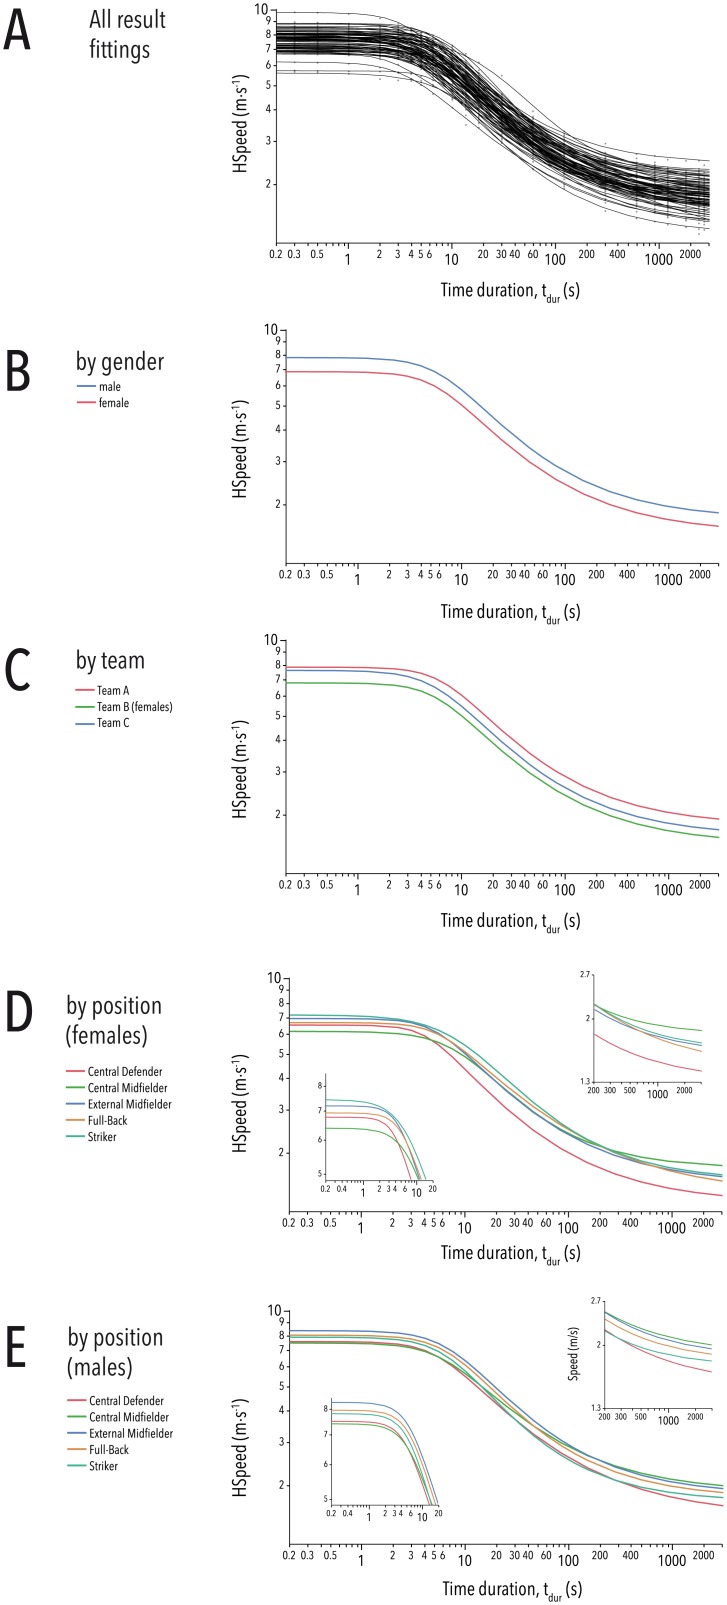
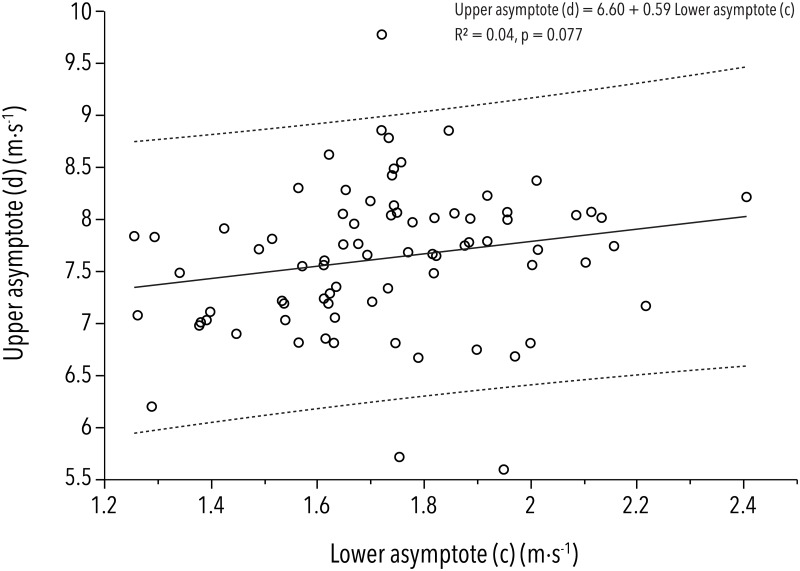
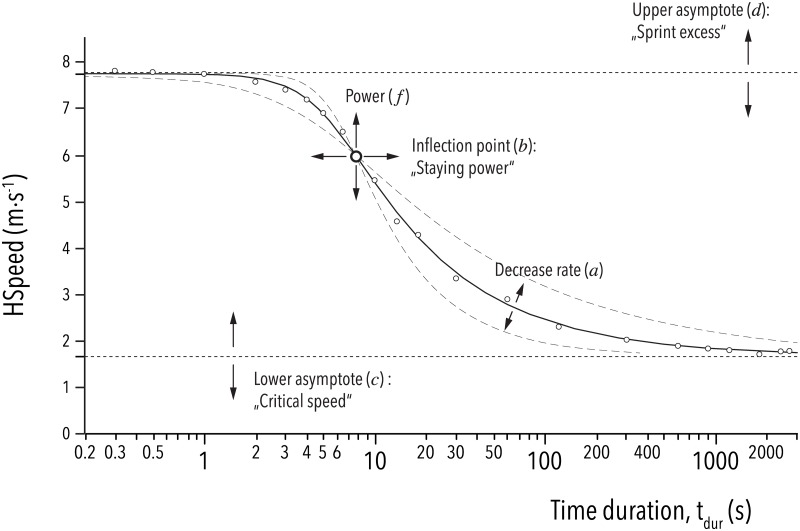
The relationship between the time duration of movement (t(dur)) and related maximum possible power output has been studied and modeled under many conditions. Inspired by the so-called power profiles known for discontinuous endurance sports like cycling, and the critical power concept of Monod and Scherrer, the aim of this study was to evaluate the numerical characteristics of the function between maximum horizontal movement velocity (HSpeed) and t(dur) in soccer. To evaluate this relationship, GPS data from 38 healthy soccer players and 82 game participations (≥30 min active playtime) were used to select maximum HSpeed for 21 distinct t(dur) values (between 0.3 s and 2,700 s) based on moving medians with an incremental t(dur) window-size. As a result, the relationship between HSpeed and Log(t(dur)) appeared reproducibly as a sigmoidal decay function, and could be fitted to a five-parameter equation with upper and lower asymptotes, and an inflection point, power and decrease rate. Thus, the first three parameters described individual characteristics if evaluated using mixed-model analysis. This study shows for the first time the general numerical relationship between t(dur) and HSpeed in soccer games. In contrast to former descriptions that have evaluated speed against power, HSpeed against t(dur) always yields a sigmoidal shape with a new upper asymptote. The evaluated curve fit potentially describes the maximum moving speed of individual players during the game, and allows for concise interpretations of the functional state of team sports athletes.
Conflict of interest statement
Figures
References
-
- Carling C, Bloomfield J, Nelsen L, Reilly T. The Role of Motion Analysis in Elite Soccer. Sports Med. Springer International Publishing; 2008;38: 839–862. doi: 10.2165/00007256-200838100-00004 - DOI - PubMed
-
- Chambers R, Gabbett TJ, Cole MH, Beard A. The Use of Wearable Microsensors to Quantify Sport-Specific Movements. Sports Med. 2015;45: 1065–1081. doi: 10.1007/s40279-015-0332-9 - DOI - PubMed
-
- Hausler J, Halaki M, Orr R. Application of Global Positioning System and Microsensor Technology in Competitive Rugby League Match-Play: A Systematic Review and Meta-analysis. Sports Med. Springer International Publishing; 2015;46: 559–588. doi: 10.1007/s40279-015-0440-6 - DOI - PubMed
-
- Yang C-C, Hsu Y-L. A review of accelerometry-based wearable motion detectors for physical activity monitoring. Sensors. Molecular Diversity Preservation International; 2010;10: 7772–7788. doi: 10.3390/s100807772 - DOI - PMC - PubMed
-
- Wundersitz DWT, Gastin PB, Robertson S, Davey PC, Netto KJ. Validation of a Trunk-mounted Accelerometer to Measure Peak Impacts during Team Sport Movements. Int J Sports Med. © Georg Thieme Verlag KG; 2015;36: 742–746. doi: 10.1055/s-0035-1547265 - DOI - PubMed
MeSH terms
LinkOut - more resources
Full Text Sources
Other Literature Sources
Research Materials
