Review
. 2017 Sep 19;12(18):2343-2353.
doi: 10.1002/asia.201700814. Epub 2017 Aug 30.

Fluorescence and Sensing Applications of Graphene Oxide and Graphene Quantum Dots: A Review

Affiliations
Review

Fluorescence and Sensing Applications of Graphene Oxide and Graphene Quantum Dots: A Review

Peng Zheng et al. Chem Asian J. .

Abstract

Graphene oxide and graphene quantum dots are attractive fluorophores that are inexpensive, nontoxic, photostable, water-soluble, biocompatible, and environmentally friendly. They find extensive applications in fluorescent biosensors and chemosensors, in which they serve as either fluorophores or quenchers. As fluorophores, they display tunable photoluminescence emission and the "giant red-edge effect". As quenchers, they exhibit a remarkable quenching efficiency through either electron transfer or Förster resonance energy transfer (FRET) process. In this review, the origin of fluorescence and the mechanism of excitation wavelength-dependent fluorescence of graphene oxide and graphene quantum dots are discussed. Sensor design strategies based on graphene oxide and graphene quantum dots are presented. The applications of these sensors in health care, the environment, agriculture, and food safety are highlighted.

Keywords: biosensors; fluorescence; graphene; quantum dots; sensors.


Conflict of interest statement

Conflict of interest

The authors declare no conflict of interest.

Figures

Figure 1
Figure 1
(a) UV/Visible absorption of as-synthesized GO and GO treated with KOH and HNO3; (b) Fluorescence spectra corresponding to (a) with an inset showing different electronic transitions. Reproduced from Ref. with permission from The Royal Society of Chemistry.
Figure 2
Figure 2
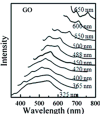
Excitation wavelength-dependent fluorescence of GO. Reproduced from Ref. with permission from The Royal Society of Chemistry.
Figure 3
Figure 3
Fluorescence properties of GO. GO exhibits an excitation wavelength dependent fluorescence (or Giant Red-Edge Effect) due to solvation. It also displays an excited state protonation from COOH groups. The measured fluorescence of GO is a superposition of contributions from C-OH and COOH groups. Reprinted with permission from Ref. . Copyright (2014) American Chemical Society.
Figure 4
Figure 4
pH-dependent photoluminescence of GO excited at 440 nm. (a) The pH effect on photoluminescence; (b) Plot of the photoluminescence intensities at 683 nm, 506 nm, and 479 nm with respect to the pH of GO solutions. Reprinted by permission from Macmillan Publishers Ltd: [Scientific Reports] (Ref. 11a), copyright (2011).
Figure 5
Figure 5
Schemastic illutration of sensor design based on GO. (a) GO as a fluorescent label; (b) GO as a FRET donor and its fluorscence can be quenched by a quencher, such as a gold nanoparticle, through FRET; (c) Charge transfer occurs between GO and a fluorophore in its close proximity; (d) GO as a quencher and can quench the fluorescence of a nearby fluorophore through FRET.
Figure 6
Figure 6
Two-photon fluorescence imaging (a) tunable excitation wavelength dependent two-photon imaging in the first and second biological transparency windows; (b) Two-photon fluorescence imaging of methicillin-resistant Staphylococcus aureus (MRSA) using aptamer modified GO, where the excitation wavelength for (b1) to (b4) are 1160 nm, 880 nm, 980 nm, and 760 nm, respectively. Reprinted by permission from Macmillan Publishers Ltd: [Scientific Reports] (Ref. 17), copyright (2014). (c)–(f) how a comparison of in vitro two-photon luminescence imaging of graphene oxide nanoparticles and molecular dye FITC. Reprinted from Ref. with permissions from Wiley.
Figure 7
Figure 7
Fluorescent sensors based on charge transfer. (a) Dopamine detection based on charge transfer between GO and dopamaine through π–π stacking. Rerpinted with permission from Ref. . Copyright (2011) American Chemical Society. (b) Hg2+ detection where Hg2+ is captured through thymine-Hg2+-thrymine interaction and quenches the fluorescence of GO. Reprinted from Ref. , Copyright (2013), with permission from Elsevier. (c) Hg2+ and I can both be detected on the same GO fluorescent biosensor platform. Reprinted with permission from Ref. . Copyright (2015) American Chemical Society.
Figure 8
Figure 8
GO as a FRET donor in a sensor for rotavirus detection where the fluorescence of GO gets quenched by gold nanoparticles. Reprinted from Ref. with permissions from Wiley.
Figure 9
Figure 9
Schematic illustration of sensor design strategies with GO as a quencher. (a) An aptamer-based sensor; (b) A DNA-based sensor; (c) A sandwich-structured immunoassay; (d) A competitive immunoassay.
Figure 10
Figure 10
GO as a quencher in sensors. (a) miRNA detection based on nano-sized graphene oxide (NGO) and peptide nucleic acid (PNA) where the fluorescence of the dye-labelled on the PNA probe is initially quenched by GO but later recovered after the probe detaches from NGO and hybridizes with a target miRNA. Reprinted with permission from Ref. . Copyright (2013) American Chemical Society. (b) Ovarian cancer biomarker CA-125 detection based on chemiluminescence resonance energy transfer (CRET). Reproduced from Ref. with permission of The Royal Society of Chemistry.
Figure 11
Figure 11
bio-imaging with GQDs utilizing the Giant Red-Edge Effect. (a) Fluorescence images of A549 cells cultured with GQDs under different excitations (shown on the upper right of each image). Reprinted by permission from Macmillan Publishers Ltd: [Light: Science & Applications ] (Ref. 38e), copyright (2015). (b) Fluorescence images with GQDs at different depths in tissue. Reprinted with permission from Ref. Ref. . Copyright (2017) American Chemical Society.

Similar articles

Cited by

References

    1. Novoselov KS, Fal’ko VI, Colombo L, Gellert PR, Schwab MG, Kim K. Nature. 2012;490:192–200. - PubMed
    2. Geim AK, Novoselov KS. Nat Mater. 2007;6:183–191. - PubMed
    3. Castro Neto AH, Guinea F, Peres NMR, Novoselov KS, Geim AK. Rev Mod Phys. 2009;81:109–162.
    1. Huang HM, Li ZB, She JC, Wang WL. J Appl Phys. 2012;111:054317.
    2. Mathkar A, Tozier D, Cox P, Ong PJ, Galande C, Balakrishnan K, Reddy ALM, Ajayan PM. J Phys Chem Lett. 2012;3:986–991. - PubMed
    1. Becerril HA, Mao J, Liu Z, Stoltenberg RM, Bao Z, Chen Y. ACS Nano. 2008;2:463–470. - PubMed
    2. Stankovich S, Dikin DA, Piner RD, Kohlhaas KA, Kleinhammes A, Jia Y, Wu Y, Nguyen ST, Ruoff RS. Carbon. 2007;45:1558–1565.
    3. Eda G, Fanchini G, Chhowalla M. Nat Nanotechnol. 2008;3:270–274. - PubMed
    1. Pan DY, Zhang JC, Li Z, Wu MH. Adv Mater. 2010;22:734–738. - PubMed
    2. Shen JH, Zhu YH, Yang XL, Li CZ. Chem Commun. 2012;48:3686–3699. - PubMed
    1. Zhu SJ, Zhang JH, Qiao CY, Tang SJ, Li YF, Yuan WJ, Li B, Tian L, Liu F, Hu R, Gao HN, Wei HT, Zhang H, Sun HC, Yang B. Chem Commun. 2011;47:6858–6860. - PubMed

LinkOut - more resources