. 2017 Jun 15;31(12):1272-1287.
doi: 10.1101/gad.299347.117. Epub 2017 Jul 25.

Ectopic application of the repressive histone modification H3K9me2 establishes post-zygotic reproductive isolation in Arabidopsis thaliana

Affiliations

Ectopic application of the repressive histone modification H3K9me2 establishes post-zygotic reproductive isolation in Arabidopsis thaliana

Hua Jiang et al. Genes Dev. .

Abstract

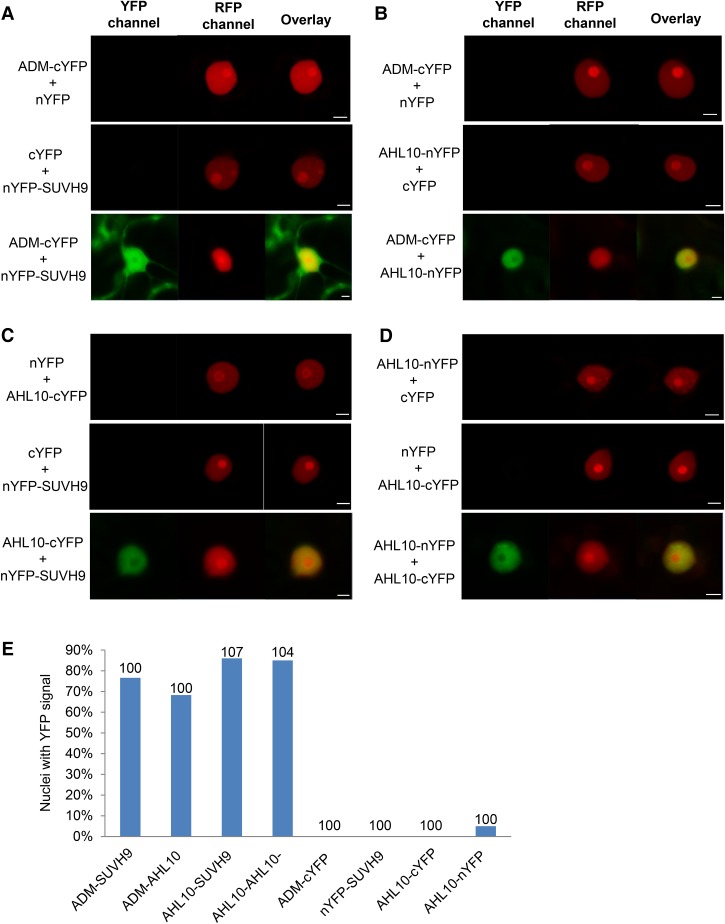
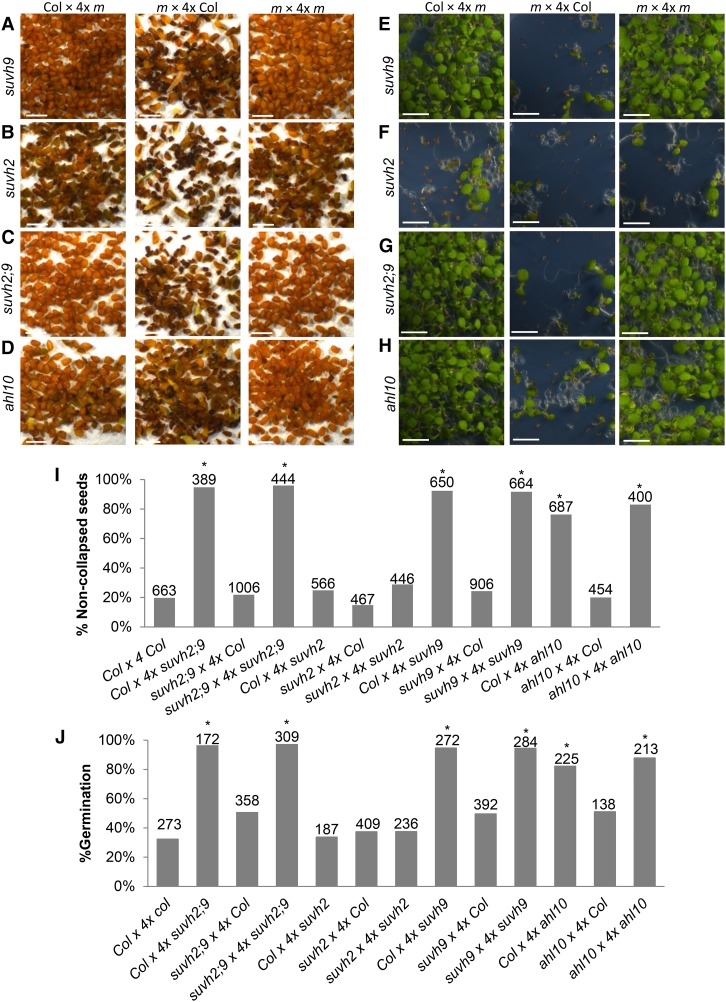
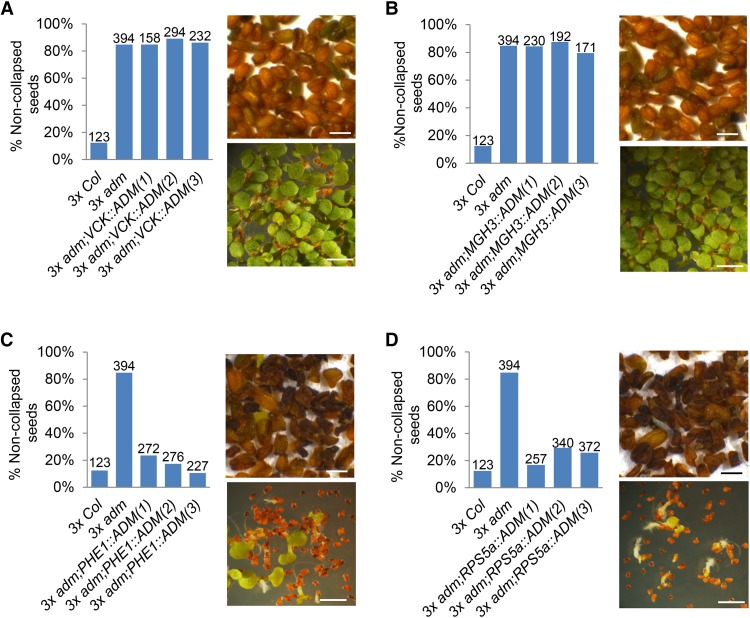
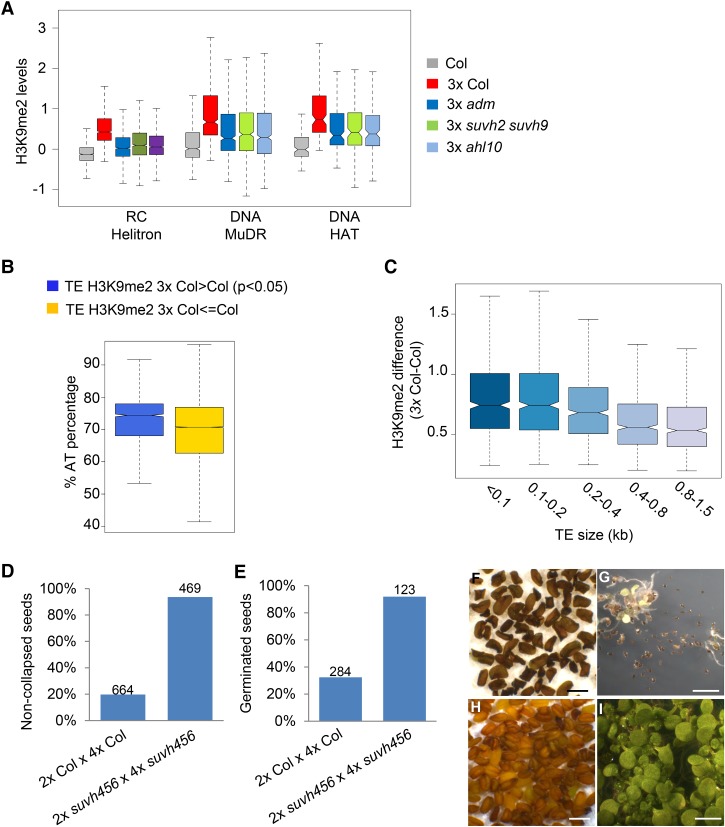
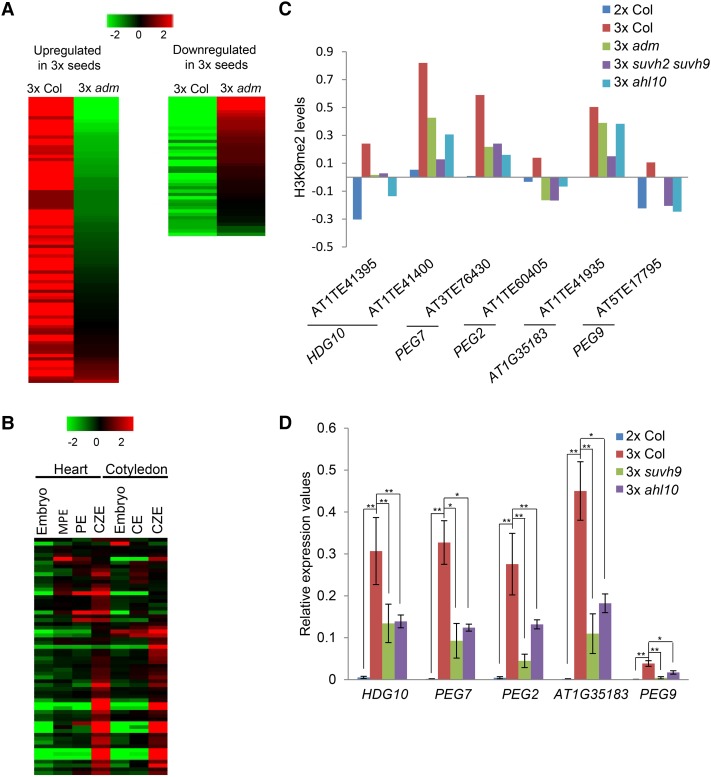
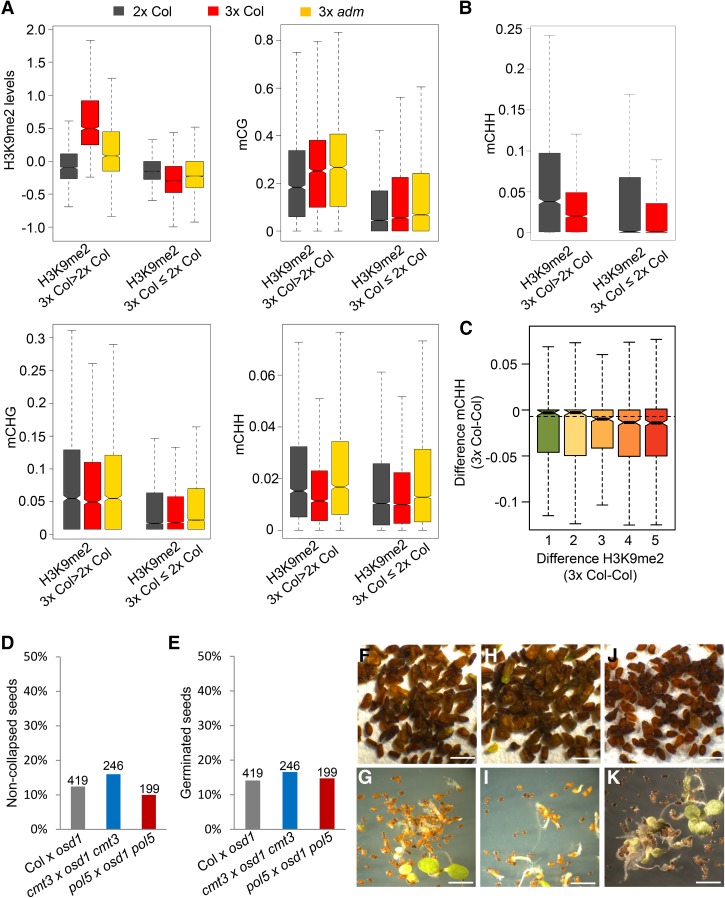
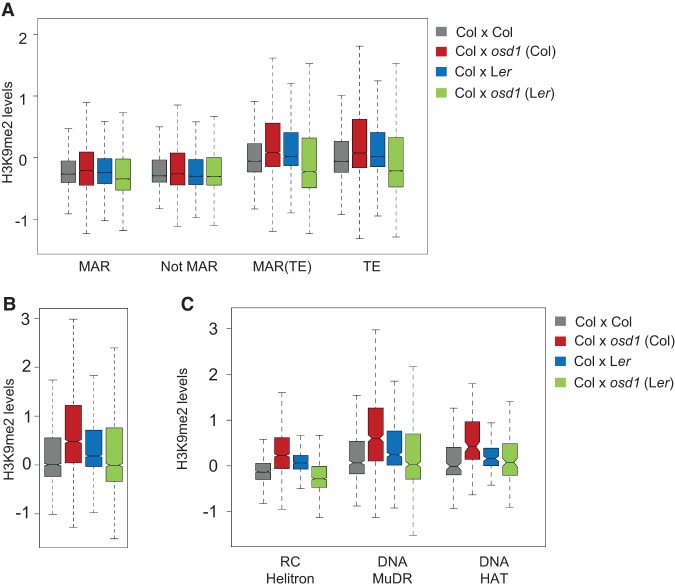
Hybrid seed lethality as a consequence of interspecies or interploidy hybridizations is a major mechanism of reproductive isolation in plants. This mechanism is manifested in the endosperm, a dosage-sensitive tissue supporting embryo growth. Deregulated expression of imprinted genes such as ADMETOS (ADM) underpin the interploidy hybridization barrier in Arabidopsis thaliana; however, the mechanisms of their action remained unknown. In this study, we show that ADM interacts with the AT hook domain protein AHL10 and the SET domain-containing SU(VAR)3-9 homolog SUVH9 and ectopically recruits the heterochromatic mark H3K9me2 to AT-rich transposable elements (TEs), causing deregulated expression of neighboring genes. Several hybrid incompatibility genes identified in Drosophila encode for dosage-sensitive heterochromatin-interacting proteins, which has led to the suggestion that hybrid incompatibilities evolve as a consequence of interspecies divergence of selfish DNA elements and their regulation. Our data show that imbalance of dosage-sensitive chromatin regulators underpins the barrier to interploidy hybridization in Arabidopsis, suggesting that reproductive isolation as a consequence of epigenetic regulation of TEs is a conserved feature in animals and plants.

Keywords: endosperm; heterochromatin; hybrid incompatibility; imprinted genes; polyploidy; transposable elements.


Figures

Figure 1.
Figure 1.
ADM interacts with SUVH9 and AHL10. Fusion constructs with N-terminal or C-terminal domains of YFP (nYFP or cYFP, respectively) were coexpressed in Nicotiana benthamiana leaves. Vectors expressing nYFP or cYFP alone with each corresponding fusion construct were used as negative controls. H3.1-RFP served as a transformation control. Water-mounted sections of leaf tissue were examined by confocal microscopy. Bars, 5 µm. (A) Interaction of ADM-cYFP with nYFP-SUVH9. (B) Interaction of ADM-cYFP with AHL10-nYFP. (C) Interaction of AHL10-cYFP with nYFP-SUVH9. (D) Interaction of AHL10-nYFP with AHL10-cYFP. (E) The percentage of nuclei showing a YFP signal in the respective combinations of tested interactions. The numbers above the bars correspond to the numbers of scored nuclei.
Figure 2.
Figure 2.
ahl10 and suvh9 seeds are viable. (AD) Pictures of mature 3× seeds derived from crosses of the indicated genotypes. (m) Mutant. Bar, 1 mm. (EH) 3× seedlings derived from crosses of the indicated genotypes at 7 d after germination. Bar, 1 cm. (I) The percentage of noncollapsed 3× seeds derived from crosses of the indicated genotypes. The numbers above the bars correspond to the numbers of analyzed seeds. Asterisks mark significance. χ2 test, P < 10E−10. (J) The percentage of germinated seeds derived from crosses of the indicated genotypes. The numbers above the bars correspond to the numbers of analyzed seeds. Asterisks mark significance. χ2 test, P < 10E−10.
Figure 3.
Figure 3.
Rescue of 3× seeds by adm occurs after fertilization. The percentage of noncollapsed 3× seeds derived after pollination with the pollen of osd1, osd1 adm, or osd1 adm expressing ADM under control of the indicated promoters. Three independent transgenic lines were tested for each construct. The numbers above the bars correspond to the numbers of analyzed seeds. At the right of the graph are pictures of mature seeds (top panel) and seedlings at 7 d after germination (bottom panel) of the corresponding genotypes. Bars, 1 cm. (A) osd1 adm mutants expressing the VCK::ADM transgene. (B) osd1 adm mutants expressing the MGH3::ADM transgene. (C) osd1 adm mutants expressing the PHE1::ADM transgene. (D) osd1 adm mutants expressing the RPS5a:ADM transgene.
Figure 4.
Figure 4.
ADM-dependent ectopic application of H3K9me2 in 3× seeds. (A) Box plots showing median values of z-score-normalized H3K9me2 at TEs belonging to the indicated families in the endosperm of seeds derived from crosses Col × Col (Col), Col × osd1 (3× Col), Col × osd1 adm (3× adm), Col × 4× suvh2 suvh9 (3× suvh2 suvh9), and Col × 4× ahl10 (3× ahl10). Shown are TEs that significantly gain H3K9me2 in 3× Col. limma, P < 0.05. Reduced H3K9me2 in the endosperm of the indicated mutants compared with 3× Col is significant. Kolmogorov-Smirnov test, P < 10E−5. (B) Box plots showing median values of AT percentage within specified groups of TEs. The difference is significant. Kolmogorov-Smirnov test, P < 10E−15. (C) Box plots showing median values of H3K9me2 differences within TEs of the indicated sizes. The difference between the first and last two categories is significant. Kolmogorov-Smirnov test, P < 10E−15. (AC) Boxes show medians and the interquartile range, and error bars show the full range excluding outliers. (D) The percentage of noncollapsed seeds of the indicated genotypes. The numbers above the bars correspond to the numbers of analyzed seeds. (E) The percentage of germinated seeds of the indicated genotypes. The numbers above the bars correspond to the numbers of analyzed seeds. (F) Picture of mature seeds derived from the cross 2× Col × 4× Col. Bar, 1 mm. (G) Picture of 3× Col seedlings 7 d after germination. Bar, 1 cm. (H) Picture of mature seeds derived from the cross 2× Col × 4× suvh456. Bar, 1 mm. (I) Picture of 3× suvh456 seedlings 7 d after germination. Bar, 1 cm.
Figure 5.
Figure 5.
Gain of H3K9me2 at TEs coincides with increased expression of neighboring genes. (A) Heat map of log2 fold expression changes in 3× seeds versus 2× seeds (3× Col) and 3× seeds versus 3× adm seeds (3× adm) of genes flanked by TEs gaining H3K9me2 in 3× seeds. Shown are genes that were either twofold up-regulated in 3× seeds versus 2× seeds (left panel) or twofold down-regulated in 3× adm seeds versus 3× seeds (right panel). 3× seeds and 3× adm seeds were generated using osd1 and osd1 adm as pollen donors crossed to Col maternal plants. (B) Cluster analysis of up-regulated TE-associated genes based on their expression in embryos and the endosperm during heart and cotyledon stages of seed development. Each row represents a gene, and each column represents a tissue type. Tissue types used were embryos, micropylar endosperm (MPE), peripheral endosperm (PE), chalazal endosperm (CZE), and cellular endosperm (CE). Red and green indicate tissues in which a particular gene is highly expressed or repressed, respectively. (C) Z-score-normalized H3K9me2 at TEs flanking the indicated PEGs in the endosperm of Col, 3×Col, 3× adm, 3× suvh2 suvh9, and 3× ahl10 seeds. (D) Quantitative RT–PCR analysis of PEGs in seeds of the indicated genotypes at 6 DAP. Data were normalized to PP2A. Data show results from biological triplicates. (*) P < 0.05; (**) P < 0.01, Student's t-test.
Figure 6.
Figure 6.
Gain of H3K9me2 at TEs in 3× seeds is independent of DNA methylation. (A) Box plots showing medians of H3K9me2 levels and DNA methylation [#C/(#C+#T)] in each sequence context in 4-DAP endosperm derived from seeds of crosses Col × osd1 (3× Col), Col × osd1 adm (3× adm), and Col × Col (2× Col). TEs belonging to RC/helitron, DNA MuDR, and DNA/HAT families that either gained or did not gain H3K9me2 in 3× seeds are shown. The differences in H3K9me2 and CHH methylation between 2× Col and 3× Col and between 3× Col and 3× adm in TEs gaining H3K9me2 in 3× seeds are significant. Kolmogorov-Smirnov test, P < 10E−15. (B) Box plot showing CHH methylation in 6-DAP endosperm derived from 3× (3× Col) and 2× (2× Col) seeds. The difference in TEs gaining H3K9me2 in 3× seeds is significant. Kolmogorov-Smirnov test, P < 10E−15. (C) Box plot showing the difference of CHH methylation between 3× (3× Col) and 2× (2× Col) seeds in relation to increasing H3K9me2 at TEs in 3× seeds (H3K9me2 3× Col > 2× Col). P < 0.05. The boxes show medians and the interquartile range, and the error bars show the full range excluding outliers. The difference between group 1 and group 5 is significant. Kolmogorov-Smirnov test, P < 0.005. (D) The percentage of noncollapsed seeds derived from the indicated crosses. The numbers above the bars correspond to the numbers of analyzed seeds. (E) The percentage of germinated seeds derived from the indicated crosses. The numbers above the bars correspond to the numbers of analyzed seeds. (F,H,J) Pictures of mature seeds derived from the indicated crosses: Col × osd1 (F), cmt3 × osd1 cmt3 (H), and pol5 × osd1 pol5 (J). Bar, 1 mm. (G,I,K) Pictures of seedlings at 7 d after germination: Col × osd1 (G), cmt3 × osd1 cmt3 (I), and pol5 × osd1 pol5 (K). Bar, 1 cm.
Figure 7.
Figure 7.
H3K9me2 is not increased at TEs in 3× Ler seeds. (A) Box plot showing median values of z-score-normalized H3K9me2 in predicted MARs, regions excluding the MAR (Not MAR), predicted MARs overlapping TEs [MAR (TE)], and TEs in the endosperm of the indicated genotypes. All differences are significant. Kolmogorov-Smirnov test, P < 10E−15. (B) Box plot showing median values of z-score-normalized H3K9me2 at TEs significantly gaining H3K9me2 in 3× Col seeds. P < 0.05. Genotypes are specified in A. All differences are significant. Kolmogorov-Smirnov test, P < 10E−15. (C) Box plot showing z-score-normalized H3K9me2 at TEs belonging to the indicated families and significantly gaining H3K9me2 in 3× Col seeds. P < 0.05. Genotypes are specified in A. The difference between 3× Col and 3× Ler is significant. Kolmogorov-Smirnov test, P < 10E−15. The boxes show medians and the interquartile range, and the error bars show the full range excluding outliers.

Similar articles

Cited by

References

    1. Barbash DA, Siino DF, Tarone AM, Roote J. 2003. A rapidly evolving MYB-related protein causes species isolation in Drosophila. Proc Natl Acad Sci 100: 5302–5307. - PMC - PubMed
    1. Bartolomei MS, Ferguson-Smith AC. 2011. Mammalian genomic imprinting. Cold Spring Harb Perspect Biol 3: a002592. - PMC - PubMed
    1. Birchler JA, Veitia RA. 2012. Gene balance hypothesis: connecting issues of dosage sensitivity across biological disciplines. Proc Natl Acad Sci 109: 14746–14753. - PMC - PubMed
    1. Birchler JA, Bhadra U, Bhadra MP, Auger DL. 2001. Dosage-dependent gene regulation in multicellular eukaryotes: implications for dosage compensation, aneuploid syndromes, and quantitative traits. Dev Biol 234: 275–288. - PubMed
    1. Blumenstiel JP. 2011. Evolutionary dynamics of transposable elements in a small RNA world. Trends Genet 27: 23–31. - PubMed

Publication types

MeSH terms

Substances