

18F-AV-1451 and CSF T-tau and P-tau as biomarkers in Alzheimer's disease
- PMID: 28743782
- PMCID: PMC5582410
- DOI: 10.15252/emmm.201707809
18F-AV-1451 and CSF T-tau and P-tau as biomarkers in Alzheimer's disease
Abstract
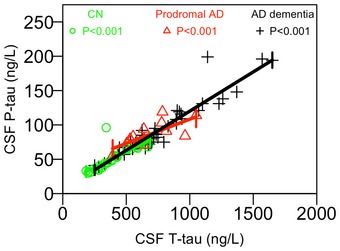
To elucidate the relationship between cerebrospinal fluid (CSF) total-tau (T-tau) and phosphorylated tau (P-tau) with the tau PET ligand 18F-AV-1451 in Alzheimer's disease (AD), we examined 30 cognitively healthy elderly (15 with preclinical AD), 14 prodromal AD, and 39 AD dementia patients. CSF T-tau and P-tau were highly correlated (R = 0.92, P < 0.001), but they were only moderately associated with retention of 18F-AV-1451, and mainly in demented AD patients. 18F-AV-1451, but not CSF T-tau or P-tau, was strongly associated with atrophy and cognitive impairment. CSF tau was increased in preclinical AD, despite normal 18F-AV-1451 retention. However, not all dementia AD patients exhibited increased CSF tau, even though 18F-AV-1451 retention was always increased at this disease stage. We conclude that CSF T-tau and P-tau mainly behave as biomarkers of "disease state", since they appear to be increased in many cases of AD at all disease stages, already before the emergence of tau aggregates. In contrast, 18F-AV-1451 is a biomarker of "disease stage", since it is increased in clinical stages of the disease, and is associated with brain atrophy and cognitive decline.
Keywords: Alzheimer; biomarker; cerebrospinal fluid; positron emission tomography; tau.
© 2017 The Authors. Published under the terms of the CC BY 4.0 license.
Figures

- A–L
Observed data and correlations for CSF T‐tau by regional 18F‐AV‐1451, and for CSF P‐tau by regional 18F‐AV‐1451. The y‐axes show 18F‐AV‐1451 data in the a priori defined tau stage I–II, III, IV, V and VI regions, and in the merged tau stage I–V region. Each symbol represents one person. The fitted lines are from linear regression models adjusted for the interaction between the CSF biomarker and diagnosis, and age, sex and time between lumbar puncture and PET scan. P‐values from these models are shown, extracted for each diagnostic group (CN, controls; Pro AD, prodromal AD; AD dem, AD dementia). Corresponding β‐coefficients are presented in Table EV1.
- A–D
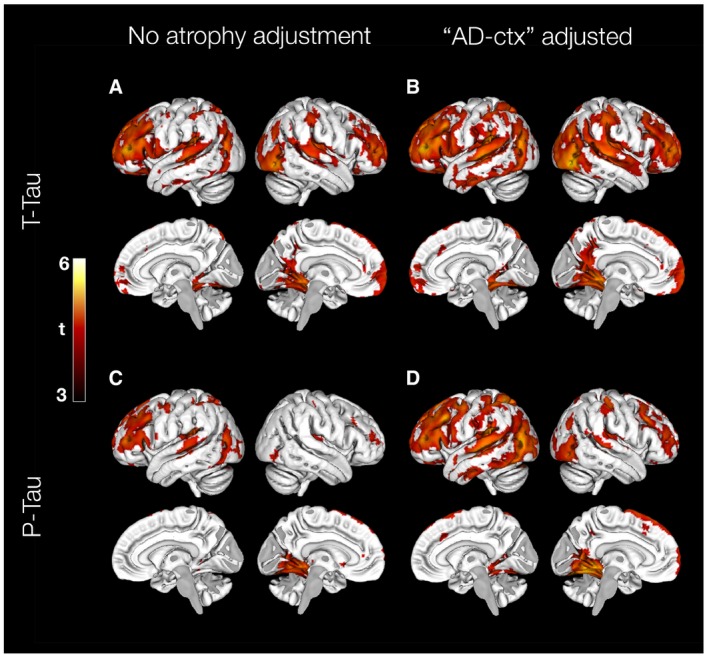
Associations of CSF T‐tau (A) and P‐tau (C) on 18F‐AV‐1451 uptake, adjusted for age, sex, diagnosis and time between lumbar puncture and PET scan. Associations of CSF T‐tau (B) and P‐tau (D) on 18F‐AV‐1451 uptake when also adjusting for atrophy (using cortical thickness in the “AD‐cortex” region). All results are shown at a statistical significance threshold of P < 0.001 (uncorrected).
- A
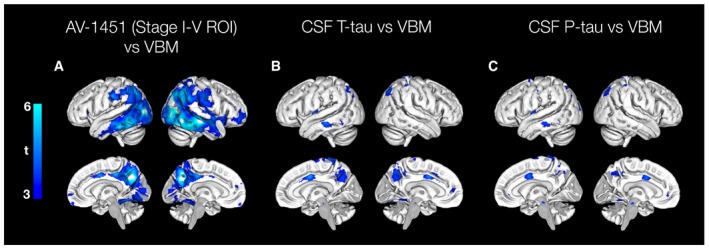
Voxel‐wise association between GM intensity and 18F‐AV‐1451 uptake in the tau stage I–V composite region, adjusted for age, sex and diagnosis. The model yielded suprathreshold clusters in the posterior lateral temporal lobes, lateral parietal and occipital cortex, as well as the precuneus at a statistical threshold of P < 0.001 (uncorrected).
- B, C
Voxel‐wise association between GM intensity and CSF T‐tau or P‐tau, adjusted for age, sex and diagnosis. The model with T‐tau as the independent variable produced small, scattered significant clusters in the precuneus, the middle cingulate gyrus, parietal and left temporal cortex. The model with P‐tau produced a similar pattern, except for the association in precuneus.
- A, B
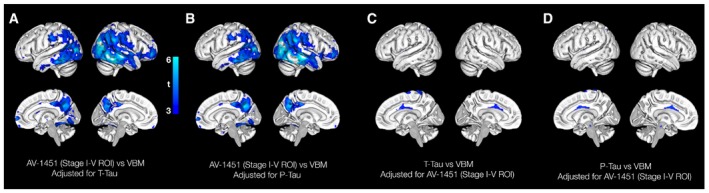
VBM analyses for 18F‐AV‐1451 when adjusted for CSF T‐tau or P‐tau.
- C, D
VBM analyses for CSF T‐tau and P‐tau when adjusted for 18F‐AV‐1451.
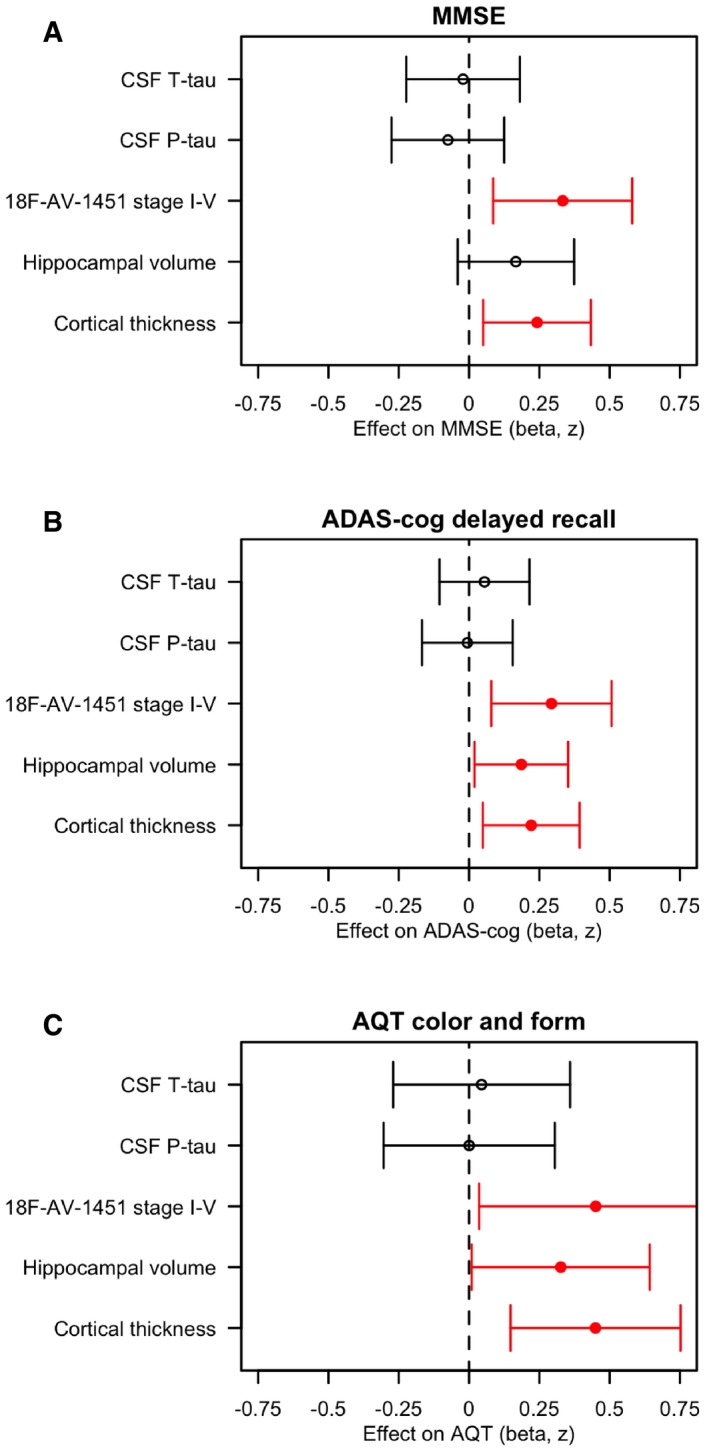
- A–C
Associations of CSF T‐tau, P‐tau, 18F‐AV1451 retention in the stage I–V composite region, hippocampal volume and cortical thickness (in the temporal lobe, “AD‐cortex”, see Materials and Methods for details) with the cognitive tests MMSE, ADAS‐cog delayed recall, and AQT colour and form naming. The estimates are β‐coefficients with 95% confidence intervals (error bars) from linear regression models adjusted for age, sex, diagnosis, education and (for hippocampal volume) intracranial volume. All data were scaled and centred. If necessary, the signs were inverted to make a more pathological biomarker associated with greater cognitive impairment. Significant associations are shown in red. In sum, higher 18F‐AV1451 retention and thinner cortex were associated with worse MMSE, ADAS‐cog delayed recall and AQT; and smaller hippocampal volume was associated with worse ADAS‐cog delayed recall and AQT.
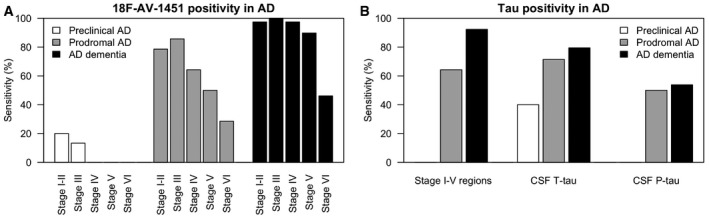
- A, B
The sensitivity of 18F‐AV‐1451 in different tau stage regions for preclinical AD, prodromal AD and AD dementia, and the sensitivity of 18F‐AV‐1451 in the tau stage I–V composite region, CSF T‐tau and P‐tau. Cut‐offs were defined using the mean levels plus two standard deviations in Aβ‐negative controls, as explained in the main text.
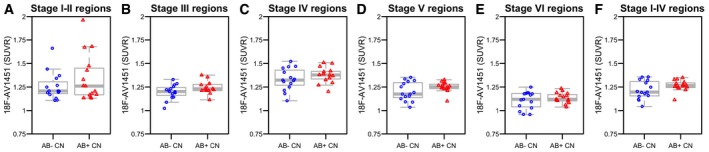
- A–F
Regional 18F‐AV‐1451 by Aβ‐status in controls. The boxplots show medians and interquartile ranges. There were no significant differences between Aβ‐negative and Aβ‐positive controls (tau stage I–II region, P = 0.53; tau stage III region, P = 0.19; tau stage IV region, P = 0.63; tau stage V region, P = 0.30; tau stage VI region, P = 0.72; and tau stage I–V composite region, P = 0.31). Tests were done by linear regression models adjusted for age and sex.
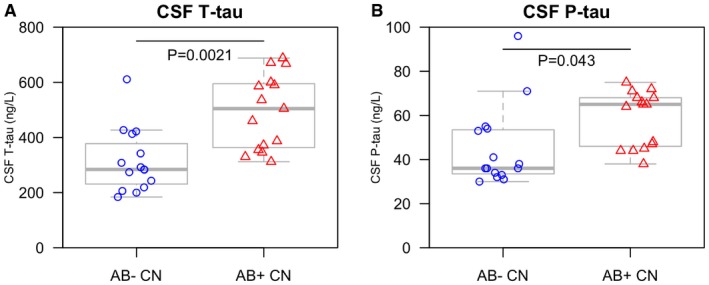
- A, B
CSF T‐tau and P‐tau were compared between Aβ‐negative and Aβ‐positive controls. Aβ‐positivity (i.e. preclinical AD) was associated with higher levels of CSF T‐tau and P‐tau, adjusted for age and sex. We also compared CSF T‐tau and P‐tau between Aβ‐negative and Aβ‐positive subjects when including all subjects with a negative 18F‐AV‐1451 signal in the tau stage I–V tau composite region (30 CN, five prodromal AD and three AD dementia patients). The Aβ‐dependent effects for CSF T‐tau and P‐tau were even greater in this group, with higher CSF T‐tau (β = 222, t = 3.9, P = 0.00048) and P‐tau (β = 22.7, t = 2.9, P = 0.0054) associated with Aβ‐positivity. The boxplots show medians and interquartile ranges.
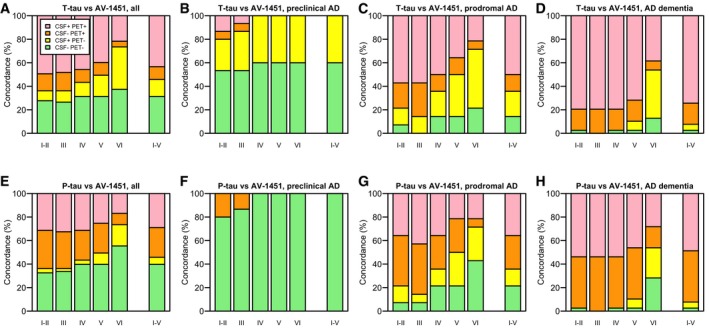
- A–H
Concordance between CSF T‐tau and 18F‐AV‐1451, and CSF P‐tau and 18F‐AV‐1451. Panels (A) and (E) include all subjects, and panels (B–D) and (F–H) include AD patients at different disease stages. The cut‐off for positive CSF T‐tau was > 542 ng/l. The cut‐off for positive CSF P‐tau was > 81 ng/l. For 18F‐AV‐1451, the cut‐offs were > 1.55, 1.35, 1.57, 1.40 and 1.30 SUVR, for tau stage I–II, III, IV, V and VI regions, respectively, and > 1.41 SUVR for the tau stage I–V composite region. Note that every participant is represented in each category on the x‐axes, since every participant was classified as positive or negative for 18F‐AV‐1451 in every tau stage region.
References
-
- American Psychiatric Association & American Psychiatric Association, Work Group to Revise DSM‐III (1987) Diagnostic and statistical manual of mental disorders: DSM‐III‐R, 3rd edn Washington, DC: American Psychiatric Association;
-
- Andreasen N, Minthon L, Clarberg A, Davidsson P, Gottfries J, Vanmechelen E, Vanderstichele H, Winblad B, Blennow K (1999) Sensitivity, specificity, and stability of CSF‐tau in AD in a community‐based patient sample. Neurology 53: 1488–1494 - PubMed
-
- Arriagada PV, Growdon JH, Hedley‐Whyte ET, Hyman BT (1992) Neurofibrillary tangles but not senile plaques parallel duration and severity of Alzheimer's disease. Neurology 42: 631–639 - PubMed
-
- Blennow K, Hampel H (2003) CSF markers for incipient Alzheimer's disease. Lancet Neurol 2: 605–613 - PubMed
MeSH terms
Substances
LinkOut - more resources
Full Text Sources
Other Literature Sources
Medical
