. 2017 Jul 25;8(1):127.
doi: 10.1038/s41467-017-00201-7.

Thrombopoiesis is spatially regulated by the bone marrow vasculature

Affiliations

Thrombopoiesis is spatially regulated by the bone marrow vasculature

David Stegner et al. Nat Commun. .

Abstract

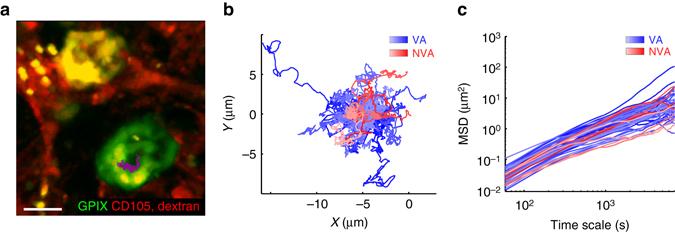
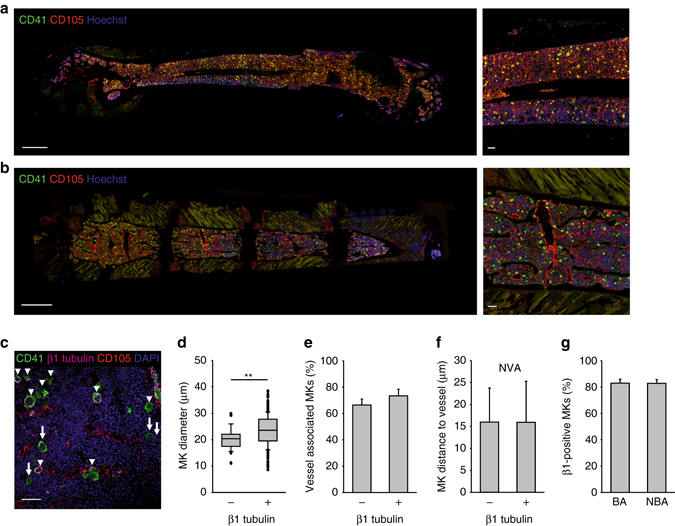
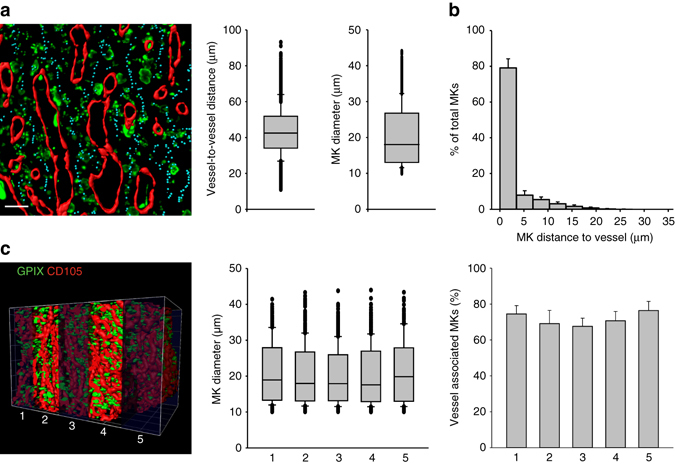
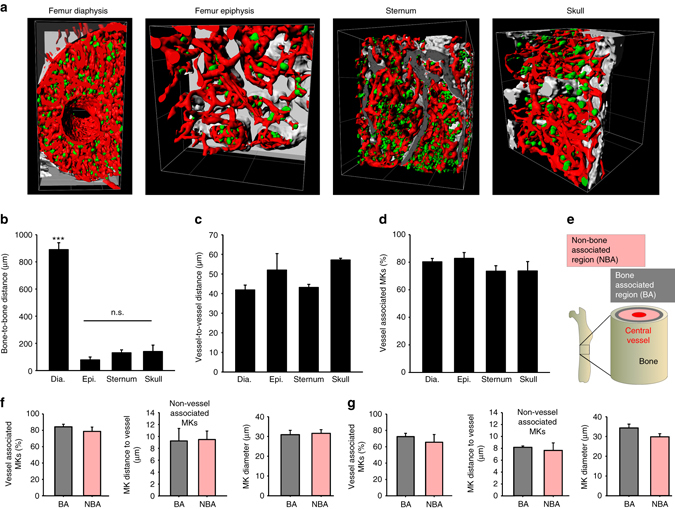
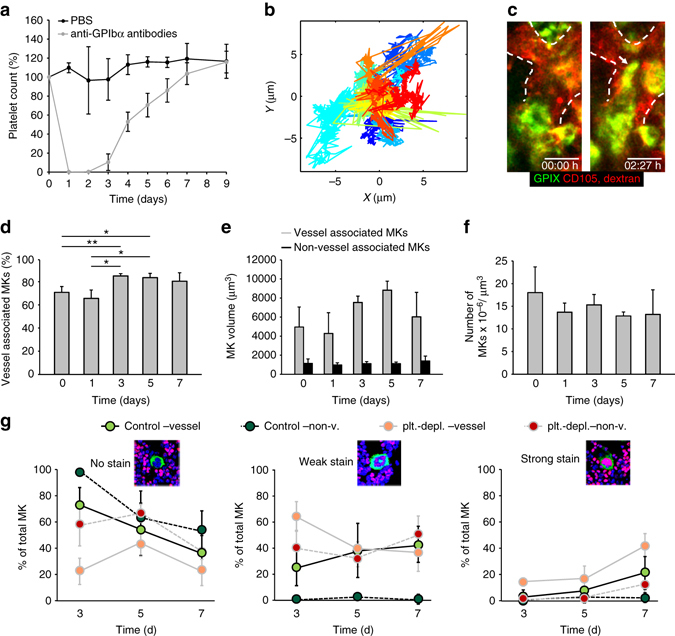
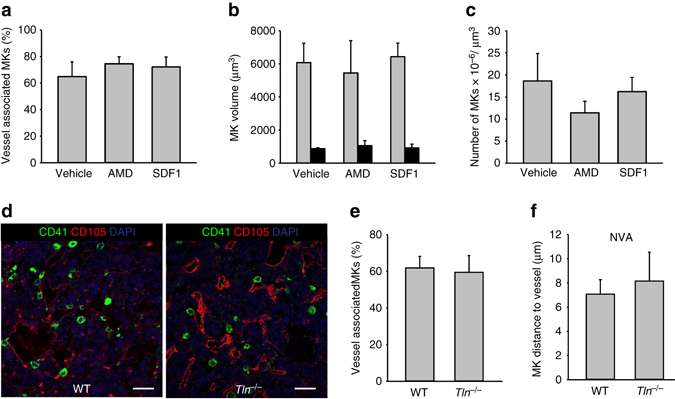
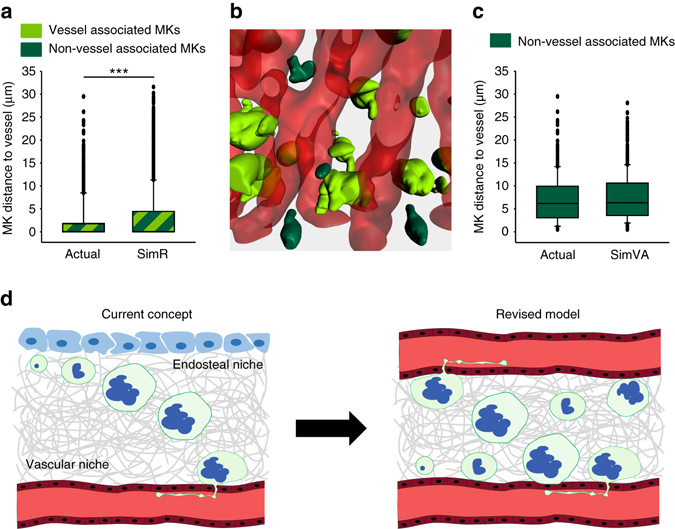
In mammals, megakaryocytes (MKs) in the bone marrow (BM) produce blood platelets, required for hemostasis and thrombosis. MKs originate from hematopoietic stem cells and are thought to migrate from an endosteal niche towards the vascular sinusoids during their maturation. Through imaging of MKs in the intact BM, here we show that MKs can be found within the entire BM, without a bias towards bone-distant regions. By combining in vivo two-photon microscopy and in situ light-sheet fluorescence microscopy with computational simulations, we reveal surprisingly slow MK migration, limited intervascular space, and a vessel-biased MK pool. These data challenge the current thrombopoiesis model of MK migration and support a modified model, where MKs at sinusoids are replenished by sinusoidal precursors rather than cells from a distant periostic niche. As MKs do not need to migrate to reach the vessel, therapies to increase MK numbers might be sufficient to raise platelet counts.Megakaryocyte maturation is thought to occur as the cells migrate from a vessel-distant (endosteal) niche to the vessel within the bone. Here, the authors show that megakaryocytes represent largely sessile cells in close contact with the vasculature and homogeneously distributed in the bone marrow.


Conflict of interest statement

The authors declare no competing financial interests.

Figures

Fig. 1
Fig. 1
MK tracking reveals low motility of MKs in vivo. a A representative centroid track (magenta) from a MK (green, scale bar 15 µm) monitored for over 3 h. Frame rate: 1 f/min b Trajectories of individual MKs (n = 54 from six different mice) over a time period of 3 h; individual trajectories of MKs are represented by different blue (vessel-associated, n = 46) and red (non-vessel associated, n = 8) shadings. Frame rate: 1 f/min c MSD analysis of individual MKs (n = 54) for different time scales. Corresponding α coefficients can be derived from slopes in the log-log-plot; MSD curves of individual MKs are represented by different blue (vessel-associated, n = 46) and red (non-vessel associated, n = 8) shadings
Fig. 2
Fig. 2
MKs are largely sessile and distributed within the BM. Distribution of megakaryocytes (MKs, CD41+, green) in cryo-sections of femur a and sternum b showing vessels (CD105+, red) and nuclei (Hoechst33258, blue, Scale bar: 1 mm (left panels), 100 µm (right panels). c MKs were counter-stained for β1-tubulin (magenta, indicated with arrowheads—in contrast to β1 MKs which are indicated with arrows); scale bar 20 µm. These mature MKs were larger d, but distributed similarly as depicted by the percentage of vessel-associated MKs e and the distance to vessels of non-vessel associated (NVA) MKs f. g The percentage of β1-tubulin positive CD41-cells within 100 µm distance from the bone cortex (BA bone-associated) and more distant MKs (NBA non-bone associated) was similar. Bar graphs represent mean ± SD; n = 4. **p < 0.01. There are no significant differences in eg (p > 0.05; Mann–Whitney U test)
Fig. 3
Fig. 3
The intervascular space limits MK distribution within the BM. a Reconstruction of sternal BM revealed a dense blood vessel network (red, CD105) with limited space for MKs (green, GPIX) shown by vessel-to-vessel distances and average MK diameter (n = 5 mice). Cyan dots represent the center (maximal distance) between two adjacent vessels. Scale bar 50 µm. b Most MKs are localized adjacent to sternal sinusoids and c MK diameters and MK distribution, shown by the percentage of vessel associated MKs, were comparable throughout the whole sternum in five different sections of the reconstructed BM. Bar graphs represent mean ± SD; n = 5; grid square = 100 µm. There are no significant differences in c (p > 0.05; Mann–Whitney U test)
Fig. 4
Fig. 4
The inter-bone space is fully vascularized and contains MKs. a Reconstruction of BM along with bone structures for different types of bone revealed that the entire BM contains MKs (green, GPIX) and blood vessels (red, CD105). Grid square = 200 µm. b Quantitative analyses revealed that bone-to-bone distances differ between femur diaphysis (dia.) on the one hand and femur epiphysis (epi.), sternum, skull on the other hand. However, the vessel-to-vessel distances c and the percentage of vessel associated MKs d are comparable. MKs were grouped in bone associated (BA) or non-bone associated (NBA, more than 100 µm distance from the bone cortex) as depicted schematically e. A subsequent analysis of MK parameters for femur f or sternum g revealed that the percentage of vessel-associated MKs, the MK distance to the vessel of non-vessel-associated MKs or MK diameters were similar between BA and NBA MKs in both types of bone. Bar graphs represent mean ± SD; n = 4; ***p < 0.001 (Mann–Whitney U test)
Fig. 5
Fig. 5
Platelet depletion does not affect MK distribution or migration within the BM. a Mice displayed severe, but reversible thrombocytopenia after platelets were depleted by anti-GPIbα antibodies (five mice per group). b Trajectories of individual MKs in cranial BM on d3.5 after platelet depletion; each color represents one MK track. c A representative MK that remained sessile for 2.5 h before starting to form proplatelets in a vessel (dashed line) (see also Supplementary Movie 10; scale bar 20 µm). df Sterna were analyzed by LSFM on day 1, 3, 5, and 7 following platelet depletion (five mice per day). Bar graphs represent mean ± SD. Increase in vessel associated MKs upon platelet depletion d correlates with an increase in MK-volume of vessel associated (gray bars, e) but not of non-vessel associated MKs (black bars, e). f Total MK numbers remain unaltered. Bar graphs represent mean ± SD. *p < 0.05, **p < 0.01 (Mann–Whitney U test). There are no significant differences in e or f (p > 0.05; one-way ANOVA). g DNA synthesis rate in MKs in vivo after platelet depletion (five mice per day). Femur bones were sectioned and stained for EdU (red), which is incorporated into nuclei (blue). MKs are stained with anti-CD41 antibody (green). EdU incorporation was detected in vessel-associated (vessel) and non-vessel-associated (non-v.) MKs at the indicated time points in platelet depleted (plt-depl) and control injected mice
Fig. 6
Fig. 6
CXCR4-blockade or talin-deficiency does not affect MK distribution within the BM. Treatment with 5 mg/kg bodyweight AMD3100 (AMD) or 16 µg/kg bodyweight SDF1 did not modify MK localization a, volume b or numbers (four mice per group) (c). d, e Talin-deficiency (Tln /) did not affect MK distribution (Scale bar 50 µm) or MK to vessel distances of non-vessel associated (NVA) MKs (f) (n = 5 for Tln /, n = 4 for WT). Bar graphs represent mean ± SD. There are no significant differences (p > 0.05; one-way ANOVA)
Fig. 7
Fig. 7
MKs display a vessel-biased random distribution. MK distribution was simulated (n = 6 simulations) using blood vessels (red) and MKs (green) derived from sternal BM imaging data. a The average distance of random distributed MKs to the vessel (SimR) is increased compared to actual data. ***p < 0.001. b Simulated vessel-associated MKs are depicted in light green, non-vessel-associated MKs are depicted in dark green. c Random simulation of only the non-vessel associated MK population results in average distances comparable to those obtained by 3D imaging data. d According to the current model of megakaryopoiesis (left panel), blood cell precursors migrate from the endosteal niche towards the vessel sinusoids during maturation. Our data support a revised model (right panel) where MKs reside directly at the sinusoids and are replenished by precursors originating from the sinusoidal niche rather than a periostic niche

Similar articles

Cited by

References

    1. Grozovsky R, Giannini S, Falet H, Hoffmeister KM. Regulating billions of blood platelets: glycans and beyond. Blood. 2015;126:1877–1884. doi: 10.1182/blood-2015-01-569129. - DOI - PMC - PubMed
    1. Patel S, Hartwig J, Italiano J. The biogenesis of platelets from megakaryocyte proplatelets. J. Clin. Invest. 2005;115:3348–3354. doi: 10.1172/JCI26891. - DOI - PMC - PubMed
    1. Chang Y, Bluteau D, Debili N, Vainchenker W. From hematopoietic stem cells to platelets. J. Thromb. Haemost. 2007;5:318–327. doi: 10.1111/j.1538-7836.2007.02472.x. - DOI - PubMed
    1. Lecine P, Italiano JE, Jr., Kim SW, Villeval JL, Shivdasani RA. Hematopoietic-specific beta 1 tubulin participates in a pathway of platelet biogenesis dependent on the transcription factor NF-E2. Blood. 2000;96:1366–1373. - PubMed
    1. Lefrancais E, et al. The lung is a site of platelet biogenesis and a reservoir for haematopoietic progenitors. Nature. 2017;544:105–109. doi: 10.1038/nature21706. - DOI - PMC - PubMed

Publication types

MeSH terms