. 2017 Jul 25;7(1):6349.
doi: 10.1038/s41598-017-06484-6.

Toll-like Receptor 4 Deficiency Reduces Oxidative Stress and Macrophage Mediated Inflammation in Hypertensive Kidney

Affiliations

Toll-like Receptor 4 Deficiency Reduces Oxidative Stress and Macrophage Mediated Inflammation in Hypertensive Kidney

Sathnur Pushpakumar et al. Sci Rep. .

Abstract

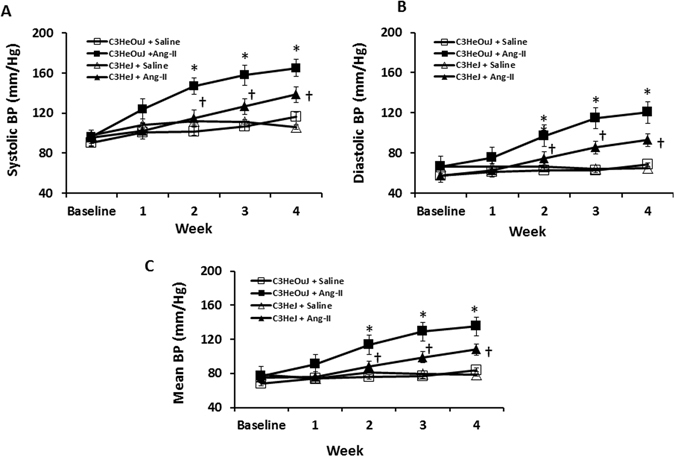
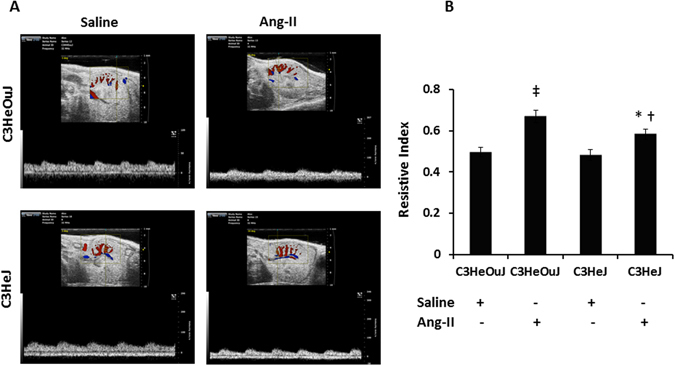
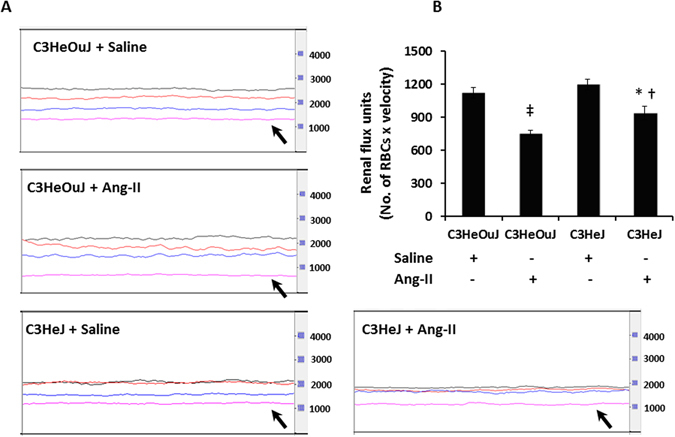
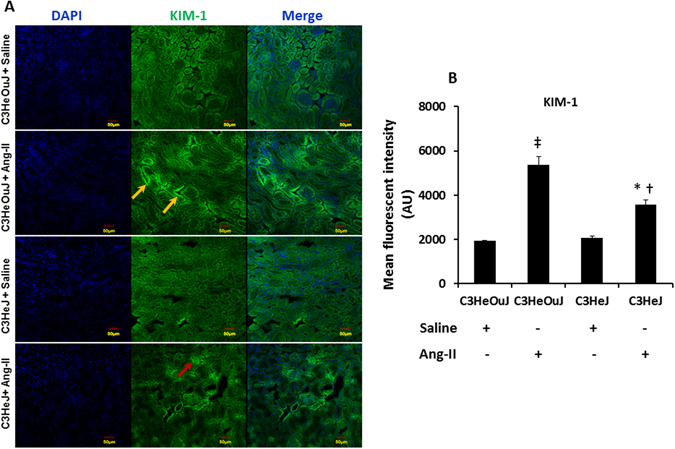
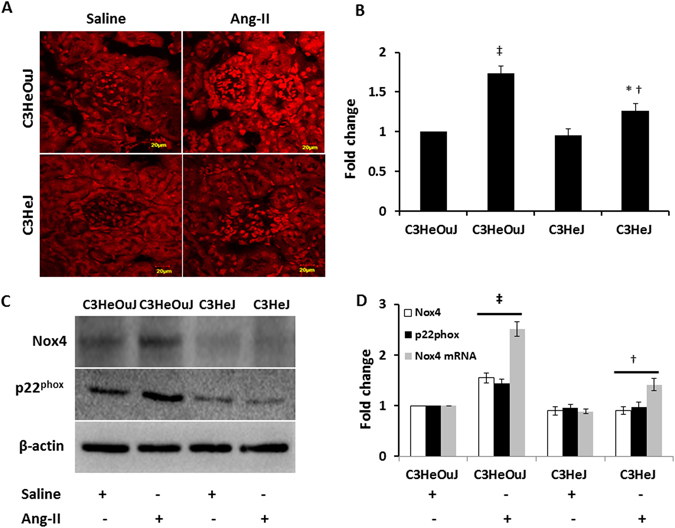
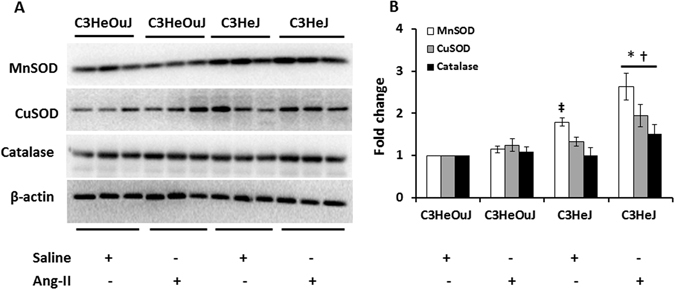
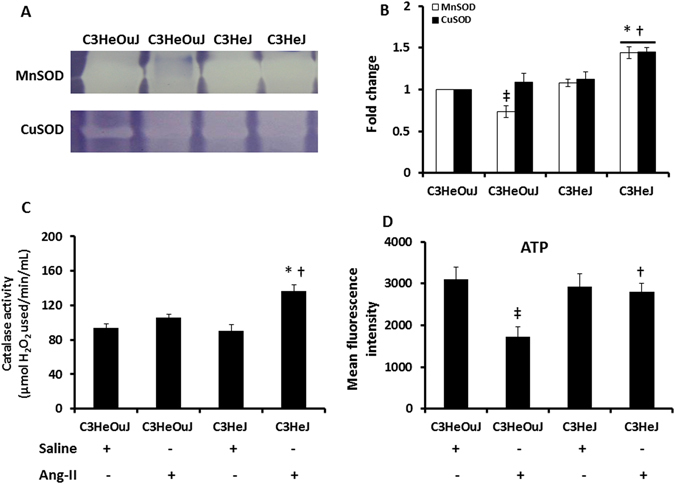
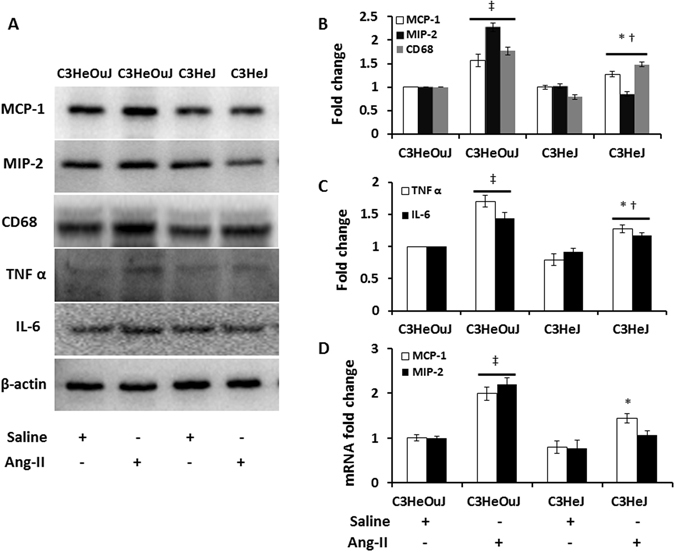
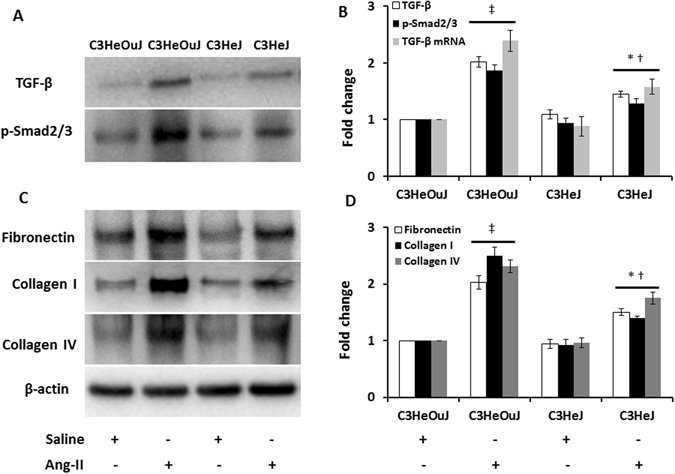
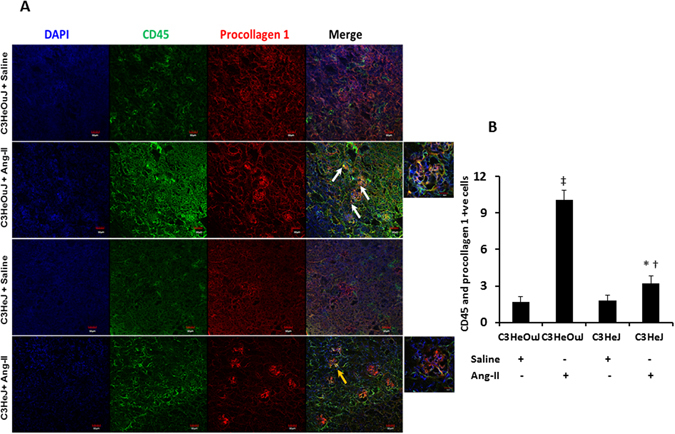
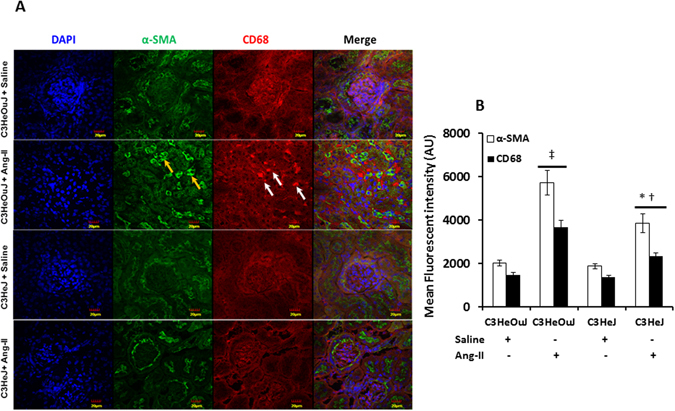
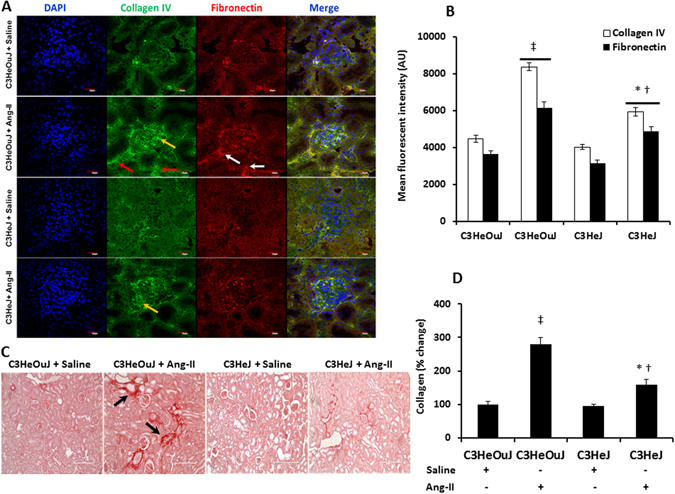
Oxidative stress and inflammation are integral to hypertension-induced renal injury. A unifying feature for the two components is Toll-like receptors (TLR), which are key regulators of the innate immune system. Recent studies implicate TLR4 activation and oxidative stress in cardiovascular diseases and also as a link between inflammation and hypertension. However, its role in hypertension induced renal injury remains unexplored. In the present study, we investigated whether TLR-4 deficiency reduces Ang-II-induced renal injury and fibrosis by attenuating reactive oxygen species (ROS) production and inflammation. C3H/HeOuJ mice with normal TLR-4 and C3H/HeJ Lps-d with dysfunctional TLR4 (TLR4 deficiency) were treated without or with Ang-II. In response to Ang-II, TLR4 deficient mice had reduced renal resistive index and increased renal cortical blood flow compared to mice with normal TLR4. Further, TLR4 deficiency reduced oxidative stress and increased antioxidant capacity (MnSOD, CuSOD and Catalase activity). TLR4 deficiency was also associated with reduced inflammation (MCP-1, MIP-2, TNF-α, IL-6 and CD68), decreased accumulation of bone marrow-derived fibroblasts and TGF-β expression. Our data suggests that in C3H/HeJ Lps-d mice, deficiency of functional TLR4 reduces oxidative stress and macrophage activation to decrease TGF-β-induced extracellular matrix protein deposition in the kidney in Ang-II induced hypertension.


Conflict of interest statement

The authors declare that they have no competing interests.

Figures

Figure 1
Figure 1
TLR4 deficiency mice exhibit blunted response to Ang-II induced hypertension. Time course of systolic, diastolic and mean blood pressure changes following Ang-II treatment in C3H/HeOuJ (C3HeOuJ, normal TLR4) and C3H/HeJ (C3HeJ, TLR4 deficiency) mice. n = 7/group tested by ANOVA followed by Student’s t-test. *p < 0.05 vs. Saline groups; p < 0.05 vs. C3HeOuJ + Ang-II.
Figure 2
Figure 2
The resistive index of intrarenal cortical artery is decreased in TLR4 deficiency mice to Ang-II. (A) Representative images of left kidney in short axis. The transducer is fixed to obtain a window showing cortical vessels. The pulse wave cursor is then centered on a cortical artery with its axis in parallel and vascular signals are obtained. Resistive index is calculated by the formula (PSV-EDV)/PSV. PSV, peak systolic velocity; EDV, end diastolic velocity. (B) Bar graph shows mean resistive index ± SEM. n = 6/group tested by ANOVA and Student’s t-test. *p < 0.05 vs. C3HeJ + saline, p < 0.05 vs. C3HeOuJ + Ang-II, p < 0.05 vs. C3HeOuJ + saline. C3HeOuJ: normal TLR4, C3HeJ: TLR4 deficiency.
Figure 3
Figure 3
TLR4 deficiency mice maintain better renal cortical blood flux than mice with normal TLR4 in response to Ang-II treatment. (A) Representative line tracing of aorta (black), renal artery (red), renal vein (blue) and renal cortex (pink). (B) Data shows mean flux ± SEM. n = 6/group tested by ANOVA and Student’s t-test. RBC, red blood cell. *p < 0.05 vs. C3HeJ + saline, p < 0.05 vs. C3HeOuJ + Ang-II, p < 0.05 vs. C3HeOuJ + saline. C3HeOuJ: normal TLR4, C3HeJ: TLR4 deficiency.
Figure 4
Figure 4
TLR4 deficiency protects the kidney from Ang-II mediated injury. (A) Representative images show Kidney injury molecule-1 immunofluorescence. Kidney sections from mice with normal TLR4 show increased KIM-1 fluorescence to Ang-II treatment in tubular areas (yellow arrows) compared to TLR4 deficiency mice (red arrow). (B) Data shows mean fluorescent intensity ± SEM. n = 5/group, tested by Kruskal-Wallis test. Scale bar - 50 µm. Magnification ×20. *p < 0.05 vs. C3HeJ + saline, p < 0.05 vs. C3HeOuJ + Ang-II, p < 0.05 vs. C3HeOuJ + saline. C3HeOuJ: normal TLR4, C3HeJ: TLR4 deficiency.
Figure 5
Figure 5
TLR4 deficiency reduces Ang-II-induced oxidative fluorescence and Nox4 and p22PHOX expression. (A) Representative images of dihydroethidium (DHE) stained kidneys. Sections from mice with normal TLR4 exhibit intense DHE fluorescence suggesting increased oxidative stress. (B) Data shows fold change of mean intensity ± SEM. (C) Representative cropped immunoblot images of Nox4 and p22PHOX. Fifty micrograms of protein from each group were separated on SDS-PAGE and incubated with appropriate antibodies overnight. (D) mRNA fold change of Nox4 assessed by real-time PCR. Results are expressed as fold change relative to control mice (C3HeOuJ + Saline). Immunoblot data was normalized to β-actin. Values are presented as mean ± SEM. n = 6/group, tested by Kruskal-Wallis test and Mann-Whitney rank sum test. Scale bar: 20 µm. Magnification ×60. *p < 0.05 vs. C3HeJ + saline, p < 0.05 vs. C3HeOuJ + Ang-II, p < 0.05 vs. C3HeOuJ + saline. C3HeOuJ: normal TLR4, C3HeJ: TLR4 deficiency.
Figure 6
Figure 6
The expression of MnSOD, CuSOD and Catalase is upregulated in Ang-II treated TLR4 deficiency mice. (A) Fifty micrograms of protein from each group were separated on SDS-PAGE and incubated with appropriate antibodies overnight. (B) Data was normalized to β-actin and are presented as mean ± SEM. *p < 0.05 vs. C3H/HeJ + Saline, p < 0.05 vs. C3H/HeOuJ groups. n = 6/group.
Figure 7
Figure 7
The enzyme activity of MnSOD, CuSOD, catalase and the levels of ATP are decreased following Ang-II treatment in mice with normal TLR4. (A) Representative images of gels stained for MnSOD and CuSOD activity. Hundred micrograms of protein were separated in 12% native gels as described in the Materials and Methods. (B) Data shows fold change of mean intensity ± SEM, n = 6/group. (C) The residual amount of H2O2 was used as a surrogate for catalase activity. Data shows catalase activity (µmol of H2O2 used/min/mL) as mean ± SEM. (D) Data showing ATP levels in all groups as mean fluorescent intensity ± SEM. n = 5/group, tested by Kruskal-Wallis test and Mann-Whitney rank sum test. *p < 0.05 vs. C3HeJ + saline, p < 0.05 vs. C3HeOuJ + Ang-II, p < 0.05 vs. C3HeOuJ + saline. C3HeOuJ: normal TLR4, C3HeJ: TLR4 deficiency.
Figure 8
Figure 8
TLR4 deficiency reduces pro-inflammatory chemokines and cytokines expression and classically activated M1 macrophage. Fifty micrograms of protein from each group were separated on SDS-PAGE and incubated with appropriate antibodies overnight. (A) Representative cropped immunoblot images for MCP-1, MIP-2, CD68, a marker for M1 type macrophage, TNF α and IL-6 showing reduced expression in TLR4 deficiency mice in response to Ang-II treatment, (B,C) Data normalized to to β-actin and presented as mean ± SEM, (D) mRNA fold change for MCP-1 and MIP-2 assessed by real-time PCR. Results are expressed as fold change relative to control mice (C3HeOuJ + Saline). n = 5/group, tested by Kruskal-Wallis test and Mann-Whitney rank sum test. *p < 0.05 vs. C3HeJ + saline, p < 0.05 vs. C3HeOuJ + Ang-II, p < 0.05 vs. C3HeOuJ + saline. C3HeOuJ: normal TLR4, C3HeJ: TLR4 deficiency.
Figure 9
Figure 9
TLR4 deficiency decreases the expression and level of TGF-β, p-Smad2/3 and extracellular matrix proteins in Ang-II treated mice. (A) Representative cropped immunoblot images for TGF-β, p-Smad2/3, (B) mRNA fold change of TGF-β assessed by real-time PCR, (C) Representative cropped immunoblot images for fibronectin, collagen I and collagen IV, (B,D) Data was normalized to β-actin and presented as mean ± SEM. n = 6/group, tested by Kruskal-Wallis test and Mann-Whitney rank sum test. *p < 0.05 vs. C3HeJ + saline, p < 0.05 vs. C3HeOuJ + Ang-II, p < 0.05 vs. C3HeOuJ + saline. C3HeOuJ: normal TLR4, C3HeJ: TLR4 deficiency.
Figure 10
Figure 10
Infiltration of bone marrow derived fibroblasts is decreased in TLR4 deficiency mice following Ang-II treatment. (A) Representative images of kidneys stained for CD45 (green) and procollagen 1 (red) from C3H/HeOuJ and C3H/HeJ. C3HeOuJ mice treated with Ang-II show increased colocalization for both antigens (white arrows) compared to C3HeJ mice (yellow arrow). Outset images show yellow color in areas of colocalization. (B) Quantitative analysis of no. of cells positive for CD45 and procollagen 1. Data is presented as mean ± SEM. n = 5/group tested by Kruskal-Wallis test and Mann-Whitney rank sum test. Magnification ×20, Scale bar: 20 µm. Outset image magnification ×100. Scale bar: 20 µm. *p < 0.05 vs. C3HeJ + saline, p < 0.05 vs. C3HeOuJ + Ang-II, p < 0.05 vs. C3HeOuJ + saline. C3HeOuJ: normal TLR4, C3HeJ: TLR4 deficiency.
Figure 11
Figure 11
The expression of α-SMA and CD68 is decreased in mice with TLR4 deficiency. (A) Representative immunofluorescence image for fibroblast marker, α-SMA and CD68, a marker for inflammatory macrophage. The α-SMA (yellow arrows) and CD68 (white arrows) expression is increased in tubulo-interstitial areas in mice with normal TLR4 to Ang-II treatment. (B) Data is presented as mean fluorescent intensity ± SEM. n = 5/group, tested by Kruskal-Wallis test and Mann-Whitney rank sum test. Magnification ×60. Scale bar: 20 µm. *p < 0.05 vs. C3HeJ + saline, p < 0.05 vs. C3HeOuJ + Ang-II, p < 0.05 vs. C3HeOuJ + saline. C3HeOuJ: normal TLR4, C3HeJ: TLR4 deficiency.
Figure 12
Figure 12
TLR4 deficiency decreases extracellular proteins, collagen and fibronectin deposition in the kidney. (A) Representative images of kidneys stained for collagen IV in the glomerular basement membrane (yellow arrow) and tubules (red arrows) and fibronectin (white arrows). (B) Quantitative analysis of fluorescent intensity, data is presented as mean ± SEM. n = 5/group, tested by Kruskal-Wallis test and Mann-Whitney rank sum test. Magnification ×60. Scale bar: 20 µm. (C) Representative images for Picrosirius red staining for collagen (Black arrows). (D) Data is presented as mean percent change from control mice ± SEM. n = 5/group, tested by Kruskal-Wallis test and Mann-Whitney rank sum test. Magnification ×20. Scale bar: 200 µm. n = 6/group tested by Kruskal-Wallis test and Mann-Whitney rank sum test. *p < 0.05 vs. C3HeJ + saline, p < 0.05 vs. C3HeOuJ + Ang-II, p < 0.05 vs. C3HeOuJ + saline. C3HeOuJ: normal TLR4, C3HeJ: TLR4 deficiency.

References

    1. Dinh QN, Drummond GR, Sobey CG, Chrissobolis S. Roles of inflammation, oxidative stress, and vascular dysfunction in hypertension. Biomed Res Int. 2014;2014:406960. doi: 10.1155/2014/406960. - DOI - PMC - PubMed
    1. Datla SR, Griendling KK. Reactive oxygen species, NADPH oxidases, and hypertension. Hypertension. 2010;56:325–330. doi: 10.1161/HYPERTENSIONAHA.109.142422. - DOI - PMC - PubMed
    1. Cai H, Harrison DG. Endothelial dysfunction in cardiovascular diseases: the role of oxidant stress. Circulation research. 2000;87:840–844. doi: 10.1161/01.RES.87.10.840. - DOI - PubMed
    1. Chae CU, Lee RT, Rifai N, Ridker PM. Blood pressure and inflammation in apparently healthy men. Hypertension. 2001;38:399–403. doi: 10.1161/01.HYP.38.3.399. - DOI - PubMed
    1. Schillaci G, et al. Increased C-reactive protein concentrations in never-treated hypertension: the role of systolic and pulse pressures. Journal of hypertension. 2003;21:1841–1846. doi: 10.1097/00004872-200310000-00010. - DOI - PubMed

Publication types

MeSH terms