

Thy-1+ Cancer-associated Fibroblasts Adversely Impact Lung Cancer Prognosis
- PMID: 28744021
- PMCID: PMC5527099
- DOI: 10.1038/s41598-017-06922-5
Thy-1+ Cancer-associated Fibroblasts Adversely Impact Lung Cancer Prognosis
Abstract
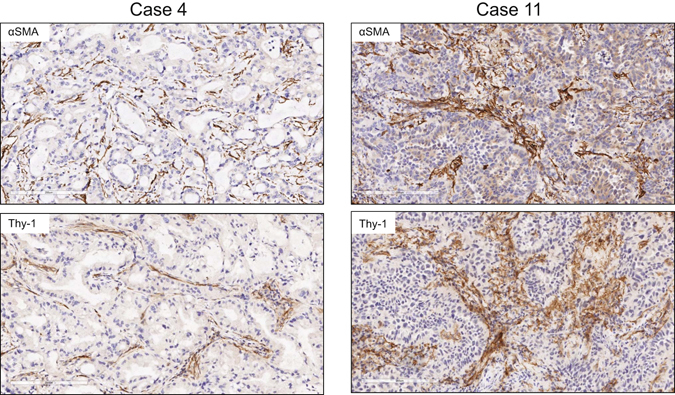
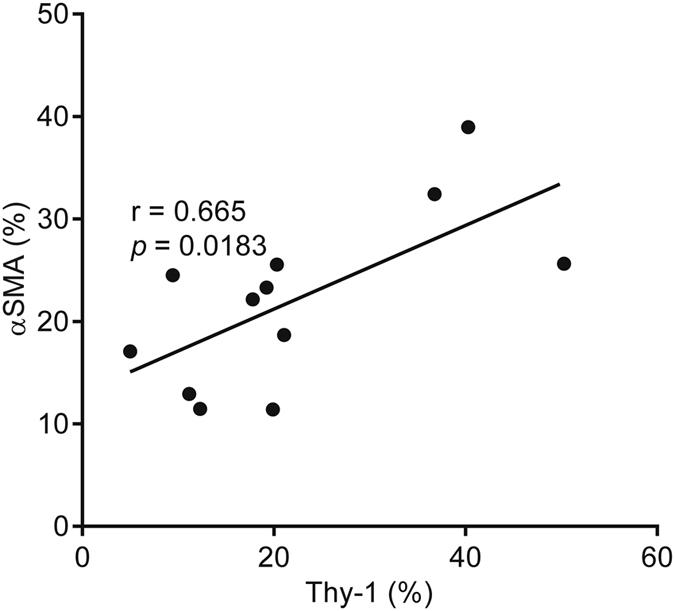
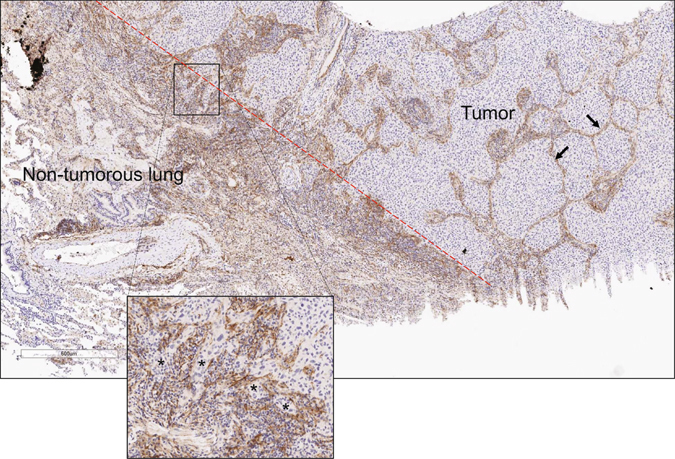
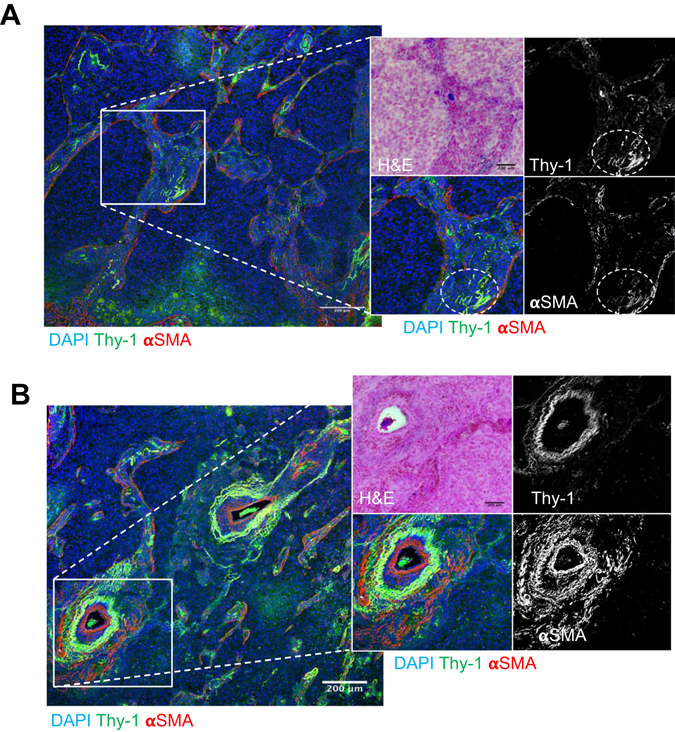
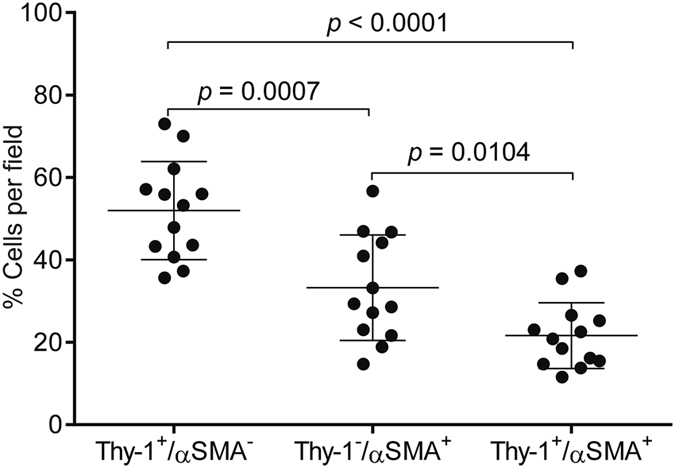
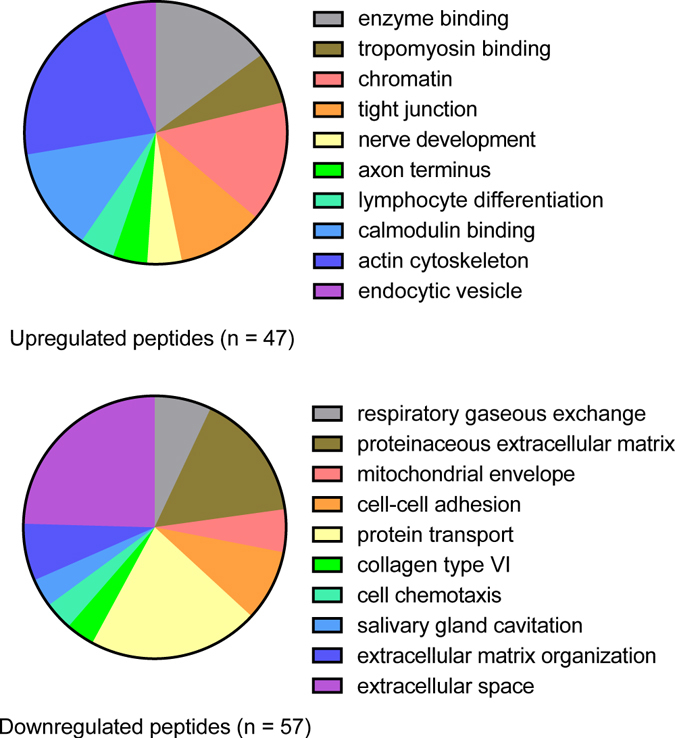
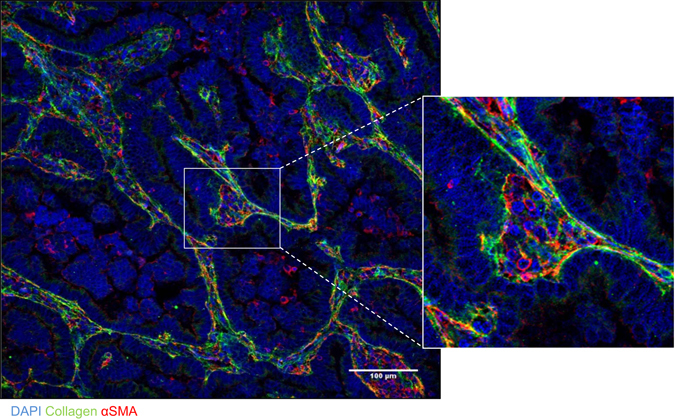
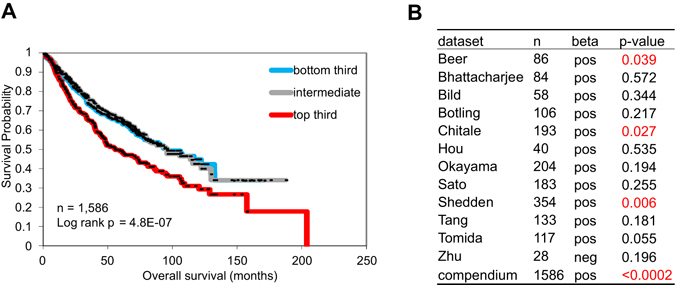
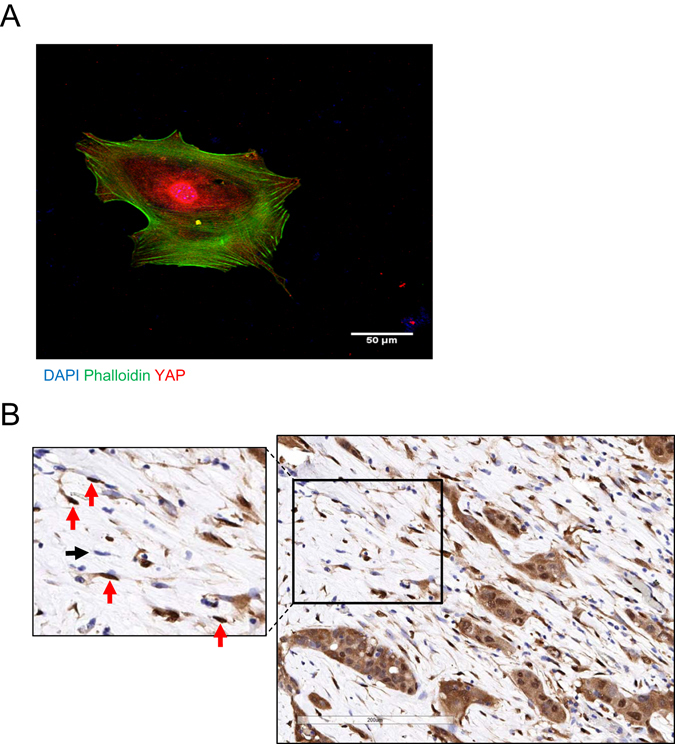
Cancer-associated fibroblasts (CAFs) regulate diverse intratumoral biological programs and can promote or inhibit tumorigenesis, but those CAF populations that negatively impact the clinical outcome of lung cancer patients have not been fully elucidated. Because Thy-1 (CD90) marks CAFs that promote tumor cell invasion in a murine model of KrasG12D-driven lung adenocarcinoma (KrasLA1), here we postulated that human lung adenocarcinomas containing Thy-1+ CAFs have a worse prognosis. We first examined the location of Thy-1+ CAFs within human lung adenocarcinomas. Cells that co-express Thy-1 and α-smooth muscle actin (αSMA), a CAF marker, were located on the tumor periphery surrounding collectively invading tumor cells and in perivascular regions. To interrogate a human lung cancer database for the presence of Thy-1+ CAFs, we isolated Thy-1+ CAFs and normal lung fibroblasts (LFs) from the lungs of KrasLA1 mice and wild-type littermates, respectively, and performed global proteomic analysis on the murine CAFs and LFs, which identified 425 proteins that were differentially expressed. Used as a probe to identify Thy-1+ CAF-enriched tumors in a compendium of 1,586 lung adenocarcinomas, the presence of the 425-gene signature predicted a significantly shorter survival. Thus, Thy-1 marks a CAF population that adversely impacts clinical outcome in human lung cancer.
Conflict of interest statement
The authors declare that they have no competing interests.
Figures
Similar articles
-
Cancer-Associated Fibroblasts Induce a Collagen Cross-link Switch in Tumor Stroma.Mol Cancer Res. 2016 Mar;14(3):287-95. doi: 10.1158/1541-7786.MCR-15-0307. Epub 2015 Dec 2. Mol Cancer Res. 2016. PMID: 26631572 Free PMC article.
-
FHL2 expression by cancer-associated fibroblasts promotes metastasis and angiogenesis in lung adenocarcinoma.Int J Cancer. 2025 Jan 15;156(2):431-446. doi: 10.1002/ijc.35174. Epub 2024 Sep 8. Int J Cancer. 2025. PMID: 39244734 Free PMC article.
-
Vimentin Is Required for Lung Adenocarcinoma Metastasis via Heterotypic Tumor Cell-Cancer-Associated Fibroblast Interactions during Collective Invasion.Clin Cancer Res. 2018 Jan 15;24(2):420-432. doi: 10.1158/1078-0432.CCR-17-1776. Epub 2017 Dec 5. Clin Cancer Res. 2018. PMID: 29208669 Free PMC article.
-
Regulation of heterogeneous cancer-associated fibroblasts: the molecular pathology of activated signaling pathways.J Exp Clin Cancer Res. 2020 Jun 16;39(1):112. doi: 10.1186/s13046-020-01611-0. J Exp Clin Cancer Res. 2020. PMID: 32546182 Free PMC article. Review.
-
Cancer-associated fibroblasts of colorectal cancer and their markers: updates, challenges and translational outlook.Future Oncol. 2020 Oct;16(29):2329-2344. doi: 10.2217/fon-2020-0384. Epub 2020 Jul 20. Future Oncol. 2020. PMID: 32687721 Review.
Cited by
-
Fibroblasts in urothelial bladder cancer define stroma phenotypes that are associated with clinical outcome.Sci Rep. 2020 Jan 14;10(1):281. doi: 10.1038/s41598-019-55013-0. Sci Rep. 2020. PMID: 31937798 Free PMC article.
-
The role of cancer-associated fibroblasts in tumorigenesis of gastric cancer.Cell Death Dis. 2022 Oct 16;13(10):874. doi: 10.1038/s41419-022-05320-8. Cell Death Dis. 2022. PMID: 36244987 Free PMC article. Review.
-
mRNA Subtype of Cancer-Associated Fibroblasts Significantly Affects Key Characteristics of Head and Neck Cancer Cells.Cancers (Basel). 2022 May 3;14(9):2286. doi: 10.3390/cancers14092286. Cancers (Basel). 2022. PMID: 35565415 Free PMC article.
-
Identifying Lung Cancer Cell Markers with Machine Learning Methods and Single-Cell RNA-Seq Data.Life (Basel). 2021 Sep 9;11(9):940. doi: 10.3390/life11090940. Life (Basel). 2021. PMID: 34575089 Free PMC article.
-
A transcriptome-wide association study integrating multi-omics bioinformatics and Mendelian randomization reveals the prognostic value of ADAMDEC1 in colon cancer.Arch Toxicol. 2025 Feb;99(2):645-665. doi: 10.1007/s00204-024-03910-3. Epub 2024 Dec 16. Arch Toxicol. 2025. PMID: 39680087
References
-
- Donnem T, et al. Prognostic impact of platelet-derived growth factors in non-small cell lung cancer tumor and stromal cells. Journal of thoracic oncology: official publication of the International Association for the Study of Lung Cancer. 2008;3:963–970. doi: 10.1097/JTO.0b013e3181834f52. - DOI - PubMed
Publication types
MeSH terms
Substances
Grants and funding
LinkOut - more resources
Full Text Sources
Other Literature Sources
Medical
Molecular Biology Databases
Miscellaneous
