. 2017 Jul 11:10:211.
doi: 10.3389/fnmol.2017.00211. eCollection 2017.

Neuronal Cholesterol Accumulation Induced by Cyp46a1 Down-Regulation in Mouse Hippocampus Disrupts Brain Lipid Homeostasis

Affiliations

Neuronal Cholesterol Accumulation Induced by Cyp46a1 Down-Regulation in Mouse Hippocampus Disrupts Brain Lipid Homeostasis

Sophie Ayciriex et al. Front Mol Neurosci. .

Abstract

Impairment in cholesterol metabolism is associated with many neurodegenerative disorders including Alzheimer's disease (AD). However, the lipid alterations underlying neurodegeneration and the connection between altered cholesterol levels and AD remains not fully understood. We recently showed that cholesterol accumulation in hippocampal neurons, induced by silencing Cyp46a1 gene expression, leads to neurodegeneration with a progressive neuronal loss associated with AD-like phenotype in wild-type mice. We used a targeted and non-targeted lipidomics approach by liquid chromatography coupled to high-resolution mass spectrometry to further characterize lipid modifications associated to neurodegeneration and cholesterol accumulation induced by CYP46A1 inhibition. Hippocampus lipidome of normal mice was profiled 4 weeks after cholesterol accumulation due to Cyp46a1 gene expression down-regulation at the onset of neurodegeneration. We showed that major membrane lipids, sphingolipids and specific enzymes involved in phosphatidylcholine and sphingolipid metabolism, were rapidly increased in the hippocampus of AAV-shCYP46A1 injected mice. This lipid accumulation was associated with alterations in the lysosomal cargoe, accumulation of phagolysosomes and impairment of endosome-lysosome trafficking. Altogether, we demonstrated that inhibition of cholesterol 24-hydroxylase, key enzyme of cholesterol metabolism leads to a complex dysregulation of lipid homeostasis. Our results contribute to dissect the potential role of lipids in severe neurodegenerative diseases like AD.

Keywords: Cyp46a1; ER stress; cholesterol; gene silencing; lipid dysregulation; lipidomics; neurodegeneration.


Figures

Figure 1
Figure 1
Measurement of cholesterol and oxysterols content 4 weeks after hippocampal injection of AAV-shCYP46A1 vector. AAV-scramble (control) or AAV-shCYP46A1 vector was injected in the stratum lacunosum moleculare of hippocampus in C57BL/6 mice. Sterols were extracted, derivatized and analyzed by UPLC-ESI-Q-TOF in MS scan mode. Cholesterol, 24-, 25-, and 27-hydroxycholesterol contents were quantified and normalized to AAV-scramble content (n = 5 mice). Unpaired t-test was performed. * P < 0.05, **P < 0.01; ns, non-significant.
Figure 2
Figure 2
Multivariate data analysis of AAV-scramble and AAV-shCYP46A1 hippocampus lipid data. After extraction, the lipid content of AAV-scramble (control) and AAV-shCYP46A1 hippocampus 4 weeks after injection were analyzed by UPLC-ESI-MSE. (A) PCA, OPLS-DA scores plots and OPLS-DA loadings S-plot for ESI+ mode. For the PCA score plot, the principal component 1 (87%) and principal component 2 (5%) account for 92% of the variance. For the OPLS-DA score plot: one orthogonal and two predictive components, R2X(cum) = 0.837, R2Y(cum) = 0.947, Q2(cum) = 0.927 with a p-value, p = 7.27e-11. S-plot from OPLS-DA analysis emphasizes variables that strongly contributed to the class separation between the two groups. (B) PCA, OPLS-DA scores plots and OPLS-DA loadings S-plot for ESI- mode. For the PCA score plot, the principal component 1 (87%) and principal component 2 (4%) account for 91% of the variance. For the OPLS-DA score plot: one orthogonal and two predictive components, R2X(cum) = 0.757, R2Y(cum) = 0.953, Q2(cum) = 0.905 927 with a p-value, p = 1.14e-9. S-plot from OPLS-DA analysis emphasizes variables that strongly contributed to the class separation between the two groups. AAV-scramble and AAV-shCYP46A1 are represented by black and gray dots, respectively. Details of variables are shown in Tables 1, 2.
Figure 3
Figure 3
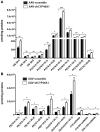
Relative quantification of lipids in hippocampus of C57Bl/6 mice after injection of AA V5-scramble (control) and AA V5-shCYP46A1. (A,B) Rise of phosphatidylcholine (PC), diacylglycerol (DAG), ceramides (Cer), sulfatide, phosphatidylethanolamine plasmalogen (PE-P) and phosphatidylethanolamine (PE) in AAV-shCYP46A1 hippocampus compared to the control. The results are expressed as nmol per mg of proteins and as the mean ± SD (n = 5 mice per group). Measurements were performed in triplicate. Unpaired t-test was performed. *P < 0.05, **P < 0.01, and ***P < 0.001.
Figure 4
Figure 4
De novo synthesis of phosphatidylcholine via the Kennedy pathway (A). Quantitative expression of spliced XBP1 form (B) and choline-phosphate cytidylyltransferase α (PCYT1A) (C) and choline-phosphate cytidylyltransferase β (PCYT1B) (D) genes after injection of AAV5-scramble and AAV-shCYP46A1 vectors in the hippocampus of C57BL/6 mice. Quantitative expression of murine spliced XBP1 (B), Pcyt1a (C) and Pcyt1b (D) genes were performed after 3 and 4 weeks post-injection (n = 5 mice per vector, per time). Expression data are normalized to the expression of AAV-scramble. Unpaired t-test was performed. *P < 0.05; **P < 0.01; ns, non-significant.
Figure 5
Figure 5
Sphingolipid metabolism (A). Quantitative expression of ceramide synthase 2 (LASS2) (B), acid sphingomyelinase (SMPD1) (C) and neutral sphingomyelinase (SMPD3) (D) genes in C57BL/6 mice after cerebral injections of AAV-scramble and AAV-shCYP46A1 vectors. Quantitative expression of murine Lass2 (B), Smpd1 (C) and Smpd3 (D) genes were performed 3 and 4 weeks post-injection (n = 5 mice). Expression data are normalized to the expression of AAV5-scramble (control). Unpaired t-test was performed. *P < 0.05; ns, non-significant.
Figure 6
Figure 6
Quantitative expression of UDP-glucose ceramide glucosyltransferase (UCGC) (A) and ST3 beta-galactoside alpha-2,3-sialyltransferase (ST3GAL1) (B) after hippocampal injections of AAV-scramble and AAV-shCYP46A1 vectors. Quantitative expression of murine Ucgc (A), St3gal1 (B) genes were performed 3 and 4 weeks post-injection (n = 5 mice). Expression data are normalized to the expression of AAV-scramble (control). Unpaired t-test was performed. *P < 0.05; ns, non-significant.
Figure 7
Figure 7
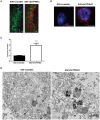
Accumulation and ultrastructural modifications of lysosomes in CA3a neurons of AAV-shCYP46A1 injected mice. (A) Representative eGFP immunostaining (green) and LAMP-1 immunoreactivity (lysosomal cell, red) (scale bar: 50 μm) (B) Representative image by laser confocal microscopy showing increased puncta-like immunoreactivity of LAMP-1 (red) in CA3a neurons of the hippocampus of C57BL/6 mice 4 weeks after injection of AAV-shCYP46A1 vector compared to AAV-scramble. Nuclei are counterstained with DAPI (blue) (scale bar: 6 μm). (C) Quantification of the number of LAMP-1-positive lysosomes in CA3a pyramidal cells at 4 weeks after AAV5-shCYP injection normalized to values from AAV5-scramble injected mice (30 cells of 5 mice per vector per time; 2-tailed unpaired t-test was performed. ***P < 0.0001. (D) Electron micrographs showing abnormal lysosomes in CA3a neurons of C57BL/6 mice 4 weeks after injection of AAV-shCYP46A1 vector (scale bar: 1 μm). (M): mitochondria, (L1): primary lysosomes, (L2): secondary lysosomes.
Figure 8
Figure 8
Cholesterol overload in neurons induced by Cyp46a1 down-regulation in mice hippocampus disrupts lipid metabolism and lysosomal trafficking.

References

    1. Anstey K. J., Lipnicki D. M., Low L. F. (2008). Cholesterol as a risk factor for dementia and cognitive decline: a systematic review of prospective studies with meta-analysis. Am. J. Geriatr. Psychiatry 16, 343–354. 10.1097/01.JGP.0000310778.20870.ae - DOI - PubMed
    1. Ariga T., Wakade C., Yu R. K. (2011). The pathological roles of ganglioside metabolism in Alzheimer's disease: effects of gangliosides on neurogenesis. Int. J. Alzheimers. Dis. 2011:193618. 10.4061/2011/193618 - DOI - PMC - PubMed
    1. Ayciriex S., Gerber H., Osuna G. M., Chami M., Stahlberg H., Shevchenko A., et al. . (2016). The lipidome associated with the gamma-secretase complex is required for its integrity and activity. Biochem. J. 473, 321–334. 10.1042/BJ20150448 - DOI - PubMed
    1. Ayciriex S., Regazzetti A., Gaudin M., Prost E., Dargere D., Massicot F., et al. . (2012). Development of a novel method for quantification of sterols and oxysterols by UPLC-ESI-HRMS: application to a neuroinflammation rat model. Anal. Bioanal. Chem. 404, 3049–3059. 10.1007/s00216-012-6396-6 - DOI - PubMed
    1. Barrachina M., Maes T., Buesa C., Ferrer I. (2006). Lysosome-associated membrane protein 1 (LAMP-1) in Alzheimer's disease. Neuropathol. Appl. Neurobiol. 32, 505–516. 10.1111/j.1365-2990.2006.00756.x - DOI - PubMed