

Age-Related Alterations in the Retinal Microvasculature, Microcirculation, and Microstructure
- PMID: 28744554
- PMCID: PMC5527847
- DOI: 10.1167/iovs.17-21460
Age-Related Alterations in the Retinal Microvasculature, Microcirculation, and Microstructure
Erratum in
-
Erratum.Invest Ophthalmol Vis Sci. 2017 Aug 1;58(10):4247. doi: 10.1167/iovs.17-21460a. Invest Ophthalmol Vis Sci. 2017. PMID: 28846774 Free PMC article. No abstract available.
Abstract
Purpose: To characterize age-related alterations in the retinal microcirculation, microvascular network, and microstructure in healthy subjects.
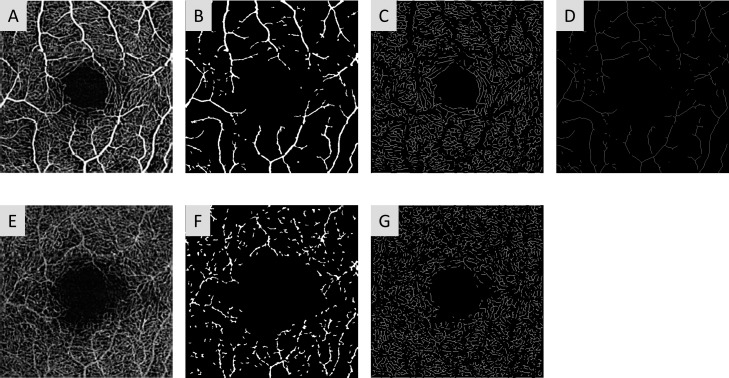
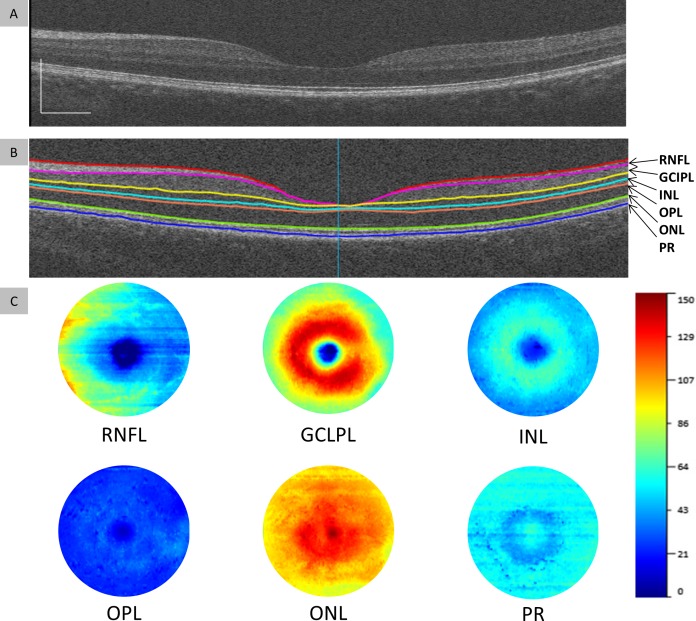
Methods: Seventy-four healthy subjects aged from 18 to 82 years were recruited and divided into four age groups (G1 with age <35 years, G2 with age 35 ∼ 49 years, G3 with age 50 ∼ 64 years, and G4 with age ≥65 years). Custom ultra-high resolution optical coherence tomography (UHR-OCT) was used to acquire six intraretinal layers of the macula. OCT angiography (OCTA) was used to image the retinal microvascular network. The retinal blood flow velocity (BFV) was measured using a Retinal Function Imager (RFI).
Results: Compared to G1, G2 had significant thinning of the retinal nerve fiber layer (RNFL) (P < 0.05), while G3 had thinning of the RNFL and ganglion cell and inner plexiform layer (GCIPL) (P < 0.05), in addition to thickening of the outer plexiform layer (OPL) and photoreceptor layer (PR) (P < 0.05). G4 had loss in retinal vessel density, thinning in RNFL and GCIPL, and decrease in venular BFV, in addition to thickening of the OPL and PR (P < 0.05). Age was negatively related to retinal vessel densities, the inner retinal layers, and venular BFV (P < 0.05). By contrast, age was positively related to OPL and PR (P < 0.05).
Conclusions: During aging, decreases in retinal vessel density, inner retinal layer thickness, and venular BFV were evident and impacted each other as observed by simultaneous changes in multiple retinal components.
Figures


Similar articles
-
Segmentation of the Four-Layered Retinal Vasculature Using High-Resolution Optical Coherence Tomography Angiography Reveals the Microcirculation Unit.Invest Ophthalmol Vis Sci. 2018 Dec 3;59(15):5847-5853. doi: 10.1167/iovs.18-25301. Invest Ophthalmol Vis Sci. 2018. PMID: 30535425
-
Visualization of Focal Thinning of the Ganglion Cell-Inner Plexiform Layer in Patients with Mild Cognitive Impairment and Alzheimer's Disease.J Alzheimers Dis. 2018;64(4):1261-1273. doi: 10.3233/JAD-180070. J Alzheimers Dis. 2018. PMID: 30040712
-
Age-Related Alterations in Retinal Tissue Perfusion and Volumetric Vessel Density.Invest Ophthalmol Vis Sci. 2019 Feb 1;60(2):685-693. doi: 10.1167/iovs.18-25864. Invest Ophthalmol Vis Sci. 2019. PMID: 30786280 Free PMC article.
-
Quantitative depth-resolved microcirculation imaging with optical coherence tomography angiography (Part Ι): Blood flow velocity imaging.Microcirculation. 2018 Aug;25(6):e12375. doi: 10.1111/micc.12375. Microcirculation. 2018. PMID: 28419622 Review.
-
A Mini Review of Clinical and Research Applications of the Retinal Function Imager.Curr Eye Res. 2018 Mar;43(3):273-288. doi: 10.1080/02713683.2017.1414853. Epub 2018 Jan 8. Curr Eye Res. 2018. PMID: 29308926 Review.
Cited by
-
Focal Thickness Reduction of the Ganglion Cell-Inner Plexiform Layer Best Discriminates Prior Optic Neuritis in Patients With Multiple Sclerosis.Invest Ophthalmol Vis Sci. 2019 Oct 1;60(13):4257-4269. doi: 10.1167/iovs.19-27574. Invest Ophthalmol Vis Sci. 2019. PMID: 31618762 Free PMC article.
-
An Analysis of Metabolic Changes in the Retina and Retinal Pigment Epithelium of Aging Mice.Invest Ophthalmol Vis Sci. 2021 Nov 1;62(14):20. doi: 10.1167/iovs.62.14.20. Invest Ophthalmol Vis Sci. 2021. PMID: 34797906 Free PMC article.
-
Genetic susceptibility to schizophrenia through neuroinflammatory pathways is associated with retinal thinning: Findings from the UK-Biobank.medRxiv [Preprint]. 2024 Apr 17:2024.04.05.24305387. doi: 10.1101/2024.04.05.24305387. medRxiv. 2024. Update in: Nat Ment Health. 2025;3(5):538-547. doi: 10.1038/s44220-025-00414-6. PMID: 38633770 Free PMC article. Updated. Preprint.
-
Regional and Layer Specific Retinal Capillary Red Blood Cell Velocimetry in Healthy Human Subjects.Transl Vis Sci Technol. 2025 Jul 1;14(7):21. doi: 10.1167/tvst.14.7.21. Transl Vis Sci Technol. 2025. PMID: 40719546 Free PMC article.
-
Longitudinal Study of Retinal Structure, Vascular, and Neuronal Function in Patients With Relapsing-Remitting Multiple Sclerosis: 1-Year Follow-Up.Transl Vis Sci Technol. 2021 May 3;10(6):6. doi: 10.1167/tvst.10.6.6. Transl Vis Sci Technol. 2021. PMID: 34111252 Free PMC article.
References
-
- Yu DY,, Cringle SJ. Oxygen distribution and consumption within the retina in vascularised and avascular retinas and in animal models of retinal disease. Prog Retin Eye Res. 2001; 20: 175–208. - PubMed
-
- Burgansky-Eliash Z,, Nelson DA,, Bar-Tal OP,, et al. Reduced retinal blood flow velocity in diabetic retinopathy. Retina. 2010; 30: 765–773. - PubMed
Publication types
MeSH terms
Grants and funding
LinkOut - more resources
Full Text Sources
Other Literature Sources
Medical
Research Materials
