

The impact of T1 versus EPI spatial normalization templates for fMRI data analyses
- PMID: 28745021
- PMCID: PMC5565844
- DOI: 10.1002/hbm.23737
The impact of T1 versus EPI spatial normalization templates for fMRI data analyses
Abstract
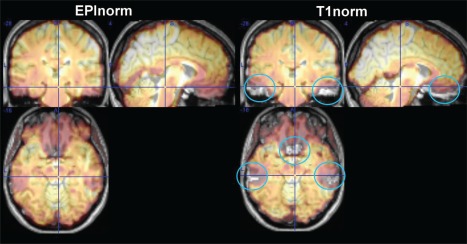
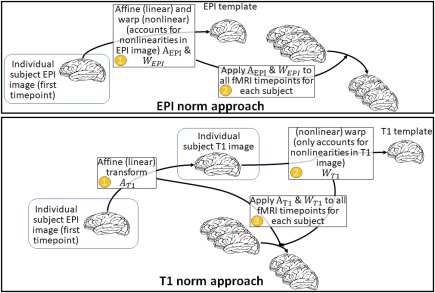
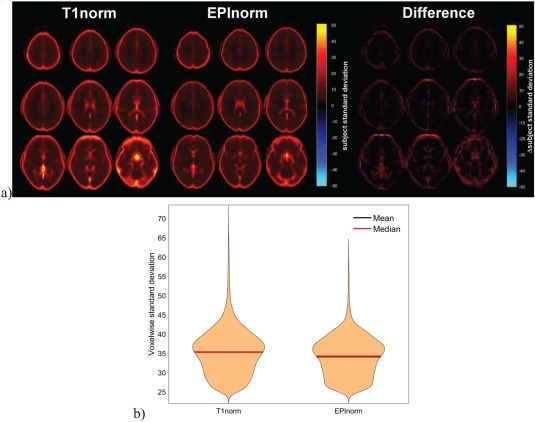
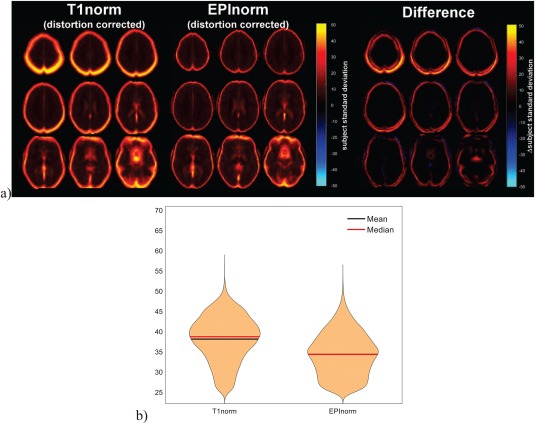
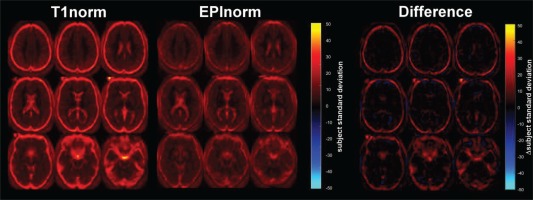
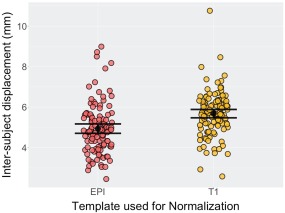
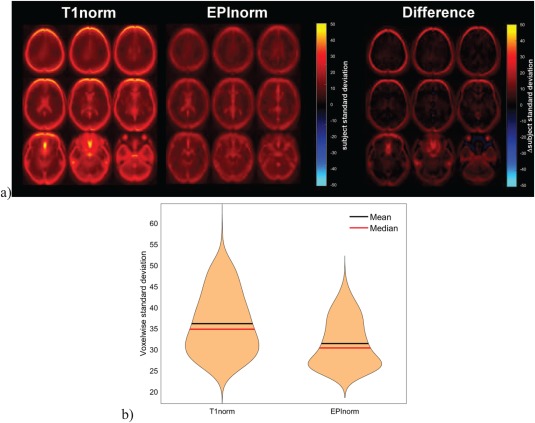
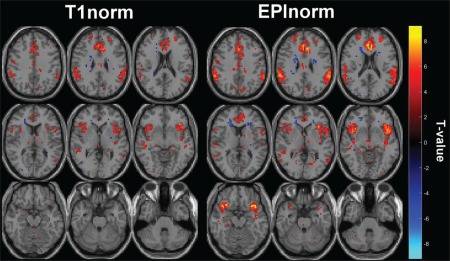
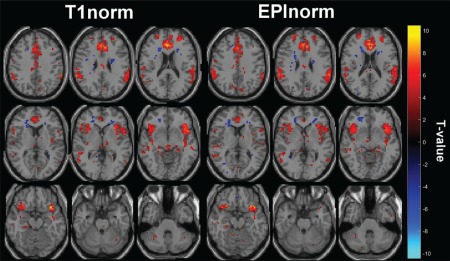
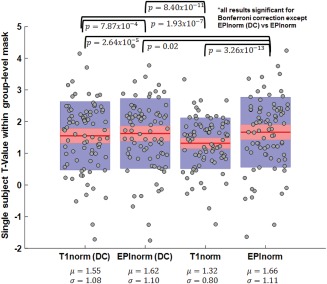
Spatial normalization of brains to a standardized space is a widely used approach for group studies in functional magnetic resonance imaging (fMRI) data. Commonly used template-based approaches are complicated by signal dropout and distortions in echo planar imaging (EPI) data. The most widely used software packages implement two common template-based strategies: (1) affine transformation of the EPI data to an EPI template followed by nonlinear registration to an EPI template (EPInorm) and (2) affine transformation of the EPI data to the anatomic image for a given subject, followed by nonlinear registration of the anatomic data to an anatomic template, which produces a transformation that is applied to the EPI data (T1norm). EPI distortion correction can be used to adjust for geometric distortion of EPI relative to the T1 images. However, in practice, this EPI distortion correction step is often skipped. We compare these template-based strategies empirically in four large datasets. We find that the EPInorm approach consistently shows reduced variability across subjects, especially in the case when distortion correction is not applied. EPInorm also shows lower estimates for coregistration distances among subjects (i.e., within-dataset similarity is higher). Finally, the EPInorm approach shows higher T values in a task-based dataset. Thus, the EPInorm approach appears to amplify the power of the sample compared to the T1norm approach when not using distortion correction (i.e., the EPInorm boosts the effective sample size by 12-25%). In sum, these results argue for the use of EPInorm over the T1norm when no distortion correction is used. Hum Brain Mapp 38:5331-5342, 2017. © 2017 The Authors Human Brain Mapping Published by Wiley Periodicals, Inc.
Keywords: coregistration; echo planar image; fMRI; spatial normalization.
© 2017 The Authors Human Brain Mapping Published by Wiley Periodicals, Inc.
Figures
References
-
- Andersson JL, Skare S, Ashburner J (2003): How to correct susceptibility distortions in spin‐echo echo‐planar images: Application to diffusion tensor imaging. NeuroImage 20:870–888. - PubMed
-
- Ardekani BA, Bachman A, Strother S, Fujibayashi Y, Yonekura Y (2004): Impact of inter‐subject image registration on group analysis of fMRI data in international congress series. Elsevier; 1265:49–59.
-
- Ardekani BA, Guckemus S, Bachman A, Hoptman MJ, Wojtaszek M, Nierenberg J (2005): Quantitative comparison of algorithms for inter‐subject registration of 3D volumetric brain MRI scans. J Neurosci Methods 142:67–76. - PubMed
-
- Ashburner J, Friston KJ (2005): Unified segmentation. NeuroImage 26:839–851. - PubMed
Publication types
MeSH terms
Grants and funding
- P20 GM103472/GM/NIGMS NIH HHS/United States
- R01 MH109329/MH/NIMH NIH HHS/United States
- R01 DA026964/DA/NIDA NIH HHS/United States
- K23 MH107734/MH/NIMH NIH HHS/United States
- R01 EB005846/EB/NIBIB NIH HHS/United States
- R01 EB006841/EB/NIBIB NIH HHS/United States
- R01 MH085328/MH/NIMH NIH HHS/United States
- R01 HD082257/HD/NICHD NIH HHS/United States
- K23 MH101322/MH/NIMH NIH HHS/United States
- R01 EB020407/EB/NIBIB NIH HHS/United States
- R01 MH078160/MH/NIMH NIH HHS/United States
- R01 MH106564/MH/NIMH NIH HHS/United States
- R01 EB000840/EB/NIBIB NIH HHS/United States
- K01 MH109766/MH/NIMH NIH HHS/United States
LinkOut - more resources
Full Text Sources
Other Literature Sources
Medical
