. 2017 Aug 3;548(7665):103-107.
doi: 10.1038/nature23283. Epub 2017 Jul 26.

Stimulation of functional neuronal regeneration from Müller glia in adult mice

Affiliations

Stimulation of functional neuronal regeneration from Müller glia in adult mice

Nikolas L Jorstad et al. Nature. .

Abstract

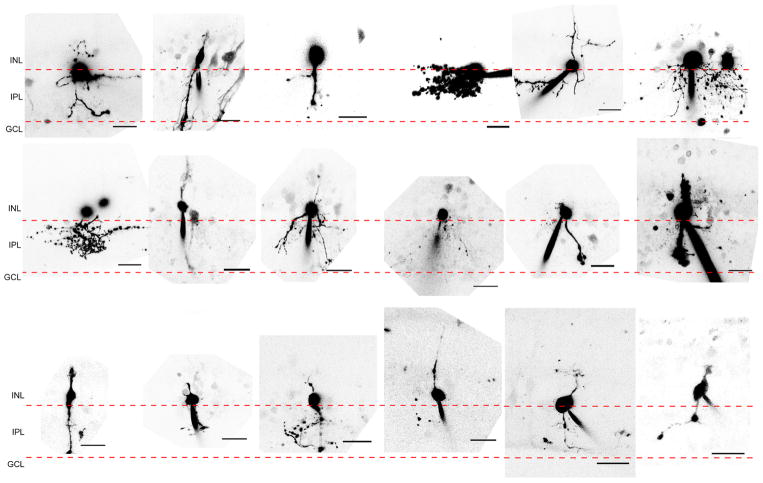
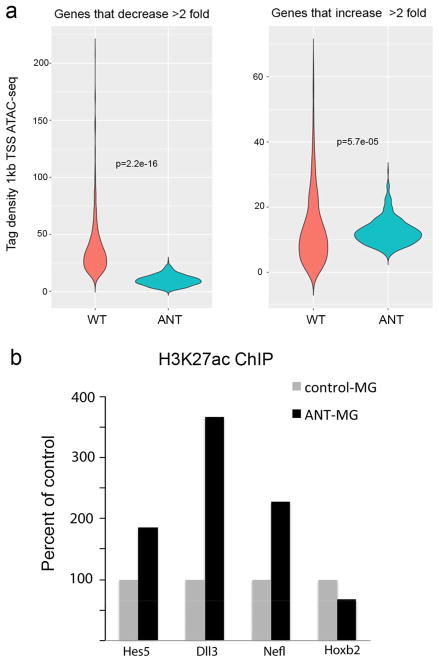
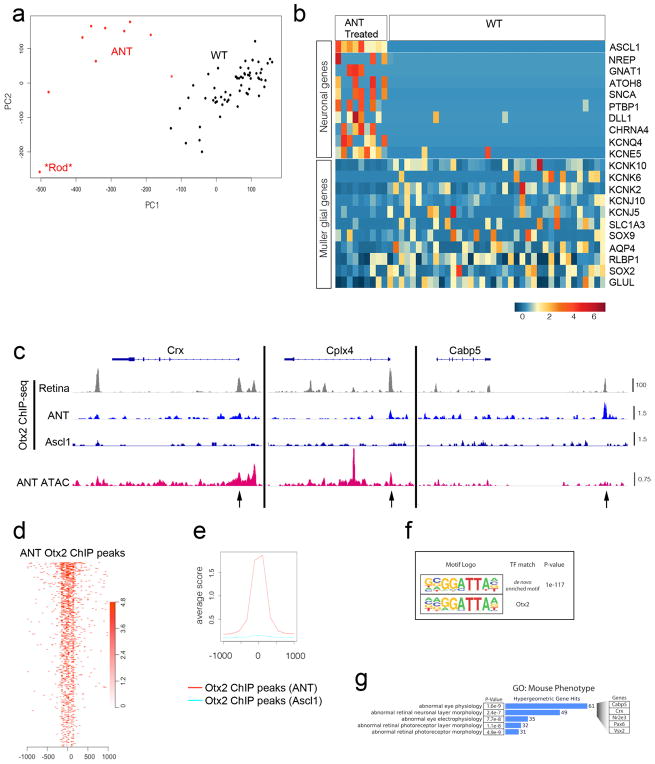
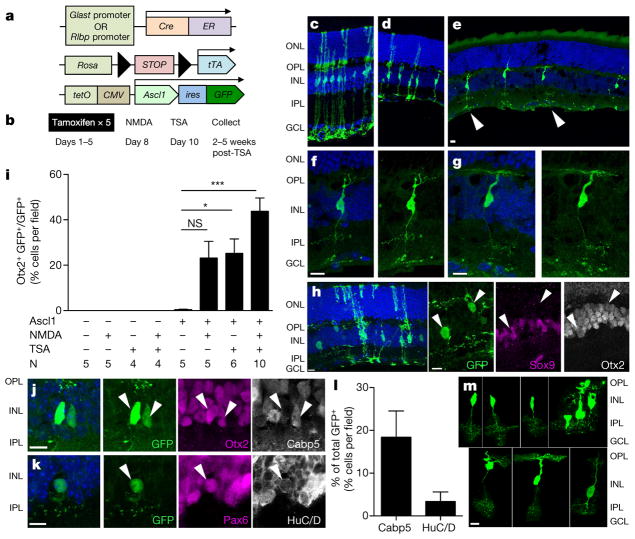
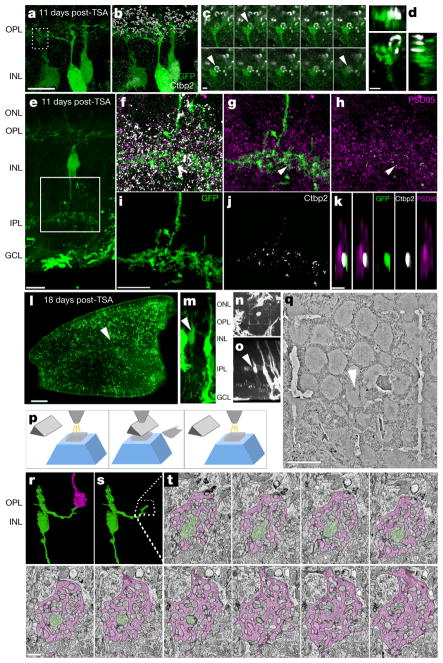
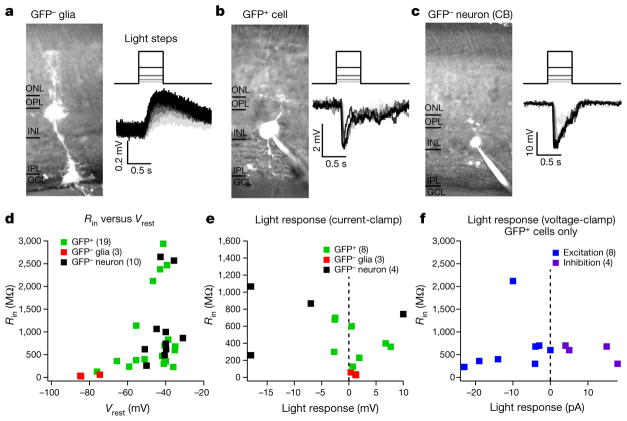
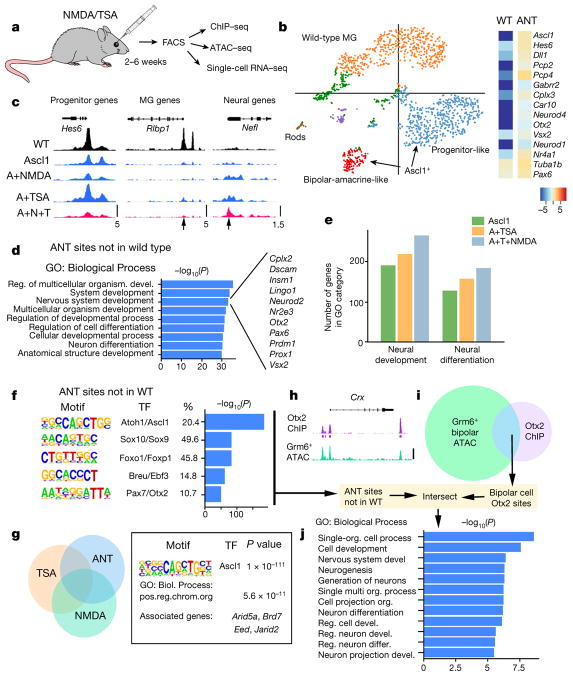
Many retinal diseases lead to the loss of retinal neurons and cause visual impairment. The adult mammalian retina has little capacity for regeneration. By contrast, teleost fish functionally regenerate their retina following injury, and Müller glia (MG) are the source of regenerated neurons. The proneural transcription factor Ascl1 is upregulated in MG after retinal damage in zebrafish and is necessary for regeneration. Although Ascl1 is not expressed in mammalian MG after injury, forced expression of Ascl1 in mouse MG induces a neurogenic state in vitro and in vivo after NMDA (N-methyl-d-aspartate) damage in young mice. However, by postnatal day 16, mouse MG lose neurogenic capacity, despite Ascl1 overexpression. Loss of neurogenic capacity in mature MG is accompanied by reduced chromatin accessibility, suggesting that epigenetic factors limit regeneration. Here we show that MG-specific overexpression of Ascl1, together with a histone deacetylase inhibitor, enables adult mice to generate neurons from MG after retinal injury. The MG-derived neurons express markers of inner retinal neurons, synapse with host retinal neurons, and respond to light. Using an assay for transposase-accessible chromatin with high-throughput sequencing (ATAC-seq), we show that the histone deacetylase inhibitor promotes accessibility at key gene loci in the MG, and allows more effective reprogramming. Our results thus provide a new approach for the treatment of blinding retinal diseases.


Conflict of interest statement

The authors declare no competing financial interests.

Figures

Extended Data Figure 1
Extended Data Figure 1. Animal age and numbers used in study
a, Histogram showing ages at which all Glast-creER and Rlbp1-creER mice used for the study received their first tamoxifen injection. There were 108 Glast-creER and Rlbp1-creER mice used for the study (122.7 ± 64.1 days, mean postnatal age ±s.d.). b, Histogram showing ages at which all ANT-treated mice used for the study received their first tamoxifen injection. There were 54 ANT-treated mice used for the study (136.4 ± 57.8 days, mean postnatal age ± s.d.). ANT-treated mice are classified according to experimental assay (H3K27ac ChIP-PCR; RNA-seq (10x Genomics)/H3K27ac ChIP-PCR, cells from these mice were split for both assays; RNA-seq (Fluidigm), single-cell RNA-seq; Otx2 ChIP–seq; IHC, immunohistochemistry; SBFSEM, serial block-face scanning electron microscopy; Ephys, whole-cell electrophysiology; ATAC–seq).
Extended Data Figure 2
Extended Data Figure 2. TSA increases histone acetylation
a, Western blot for H3K27ac and H3 24 h after TSA or DMSO intravitreal injection. b, Graph shows TSA significantly increases H3K27ac relative to H3 by unpaired t-test at **P = 0.0033, n = 5 per group. c, Graph showing the percentage of GFP+ cells that express Otx2 in various conditions in Rlbp1-creER animals. Numbers were similar to Glast-creER animals, showing no Otx2 in control mice lacking Ascl1 and approximately 36% of GFP+ cells expressing Otx2 when all three factors were present. Data were analysed by one-way ANOVA with Tukey’s post hoc test. d, Graph showing the percentage of GFP+ cells that express Sox9 in various conditions in Glast-creER and Rlbp1-creER animals. A significant reduction in the number of cells expressing Sox9 was seen by one-way ANOVA with Tukey’s post hoc test at *P <0.05, **P <0.01, ***P < 0.001 when animals expressing Ascl1 were treated with NMDA and TSA. Data in bd are shown as mean ±standard error. e, Graph showing the percentage of ANT-treated GFP+ cells that express Otx2 is not significantly different with age by Student’s t-test (n = 4 and 11 mice for 7 weeks and 15–21 weeks, respectively). Data in e is shown as mean ±s.d.
Extended Data Figure 3
Extended Data Figure 3. Neurogenesis and proliferation from Ascl1-expressing MG
a, Panel of images showing morphologies between MG and neurons. Images are from retinas that were collected 2–5 weeks post-TSA. Examples of ‘hybrid’ morphologies were observed at all post-TSA time points analysed. First image of panel has normal glial morphology for comparison. b, Example of EdU-labelled GFP+Otx2+ MG in ONL; cells stained with all three markers were very rare: <1% of GFP+ MG (approximately 1 cell per retinal section from 3 mice). c, Diagram showing experimental treatment paradigm for proliferation analysis. d, Ascl1-overexpressing mice treated with mouse epidermal growth factor (mEGF) and NMDA showed examples of Sox9+EdU+ MG. e, Majority of MG did not label with EdU when Ascl1-overexpressing mice only received intravitreal EdU injections (No Treatment). f, Graph showing the percentage of GFP+ cells expressing Sox9 and that were labelled with EdU. A significant increase in Sox9+EdU+ MG was seen when treated with NMDA and mEGF by Student’s t-test at **P = 0.0033, n = 5 per group. g, Ascl1-overexpressing mice treated with mEGF and NMDA showed examples of Otx2+EdU+ MG. h, Ascl1-overexpressing mice only receiving intravitreal EdU injections (No Treatment) had no MG that expressed Otx2 and labelled with EdU. i, Graph showing the percentage of GFP+ cells that express Otx2 and were labelled with EdU. A significant increase in Otx2+EdU+ MG was seen when treated with NMDA and mEGF by Student’s t test at *P = 0.0105, n = 5 per group. All data are shown as mean ± standard error, all scale bars are 10 μm.
Extended Data Figure 4
Extended Data Figure 4. MG-derived neurons form synaptic specializations in IPL
a, Confocal images of MG-derived bipolar-like cells with processes in IPL (scale bars, 10 μm). b, Super-resolution Zeiss Airyscan raw images of white boxes from a showing IPL processes stained with presynaptic ribbon marker CtBP2 (Ribeye, white) and postsynaptic marker PSD95 (magenta). c, Images from b masked in Amira to show presynaptic CtBP2 within GFP processes. d, Images of masked presynaptic CtBP2 staining apposed to postsynaptic PSD95 staining. e, Images of masks that were traced in Amira around GFP processes in IPL (scale bars, 10 μm). f, Images of masked CtBP2 staining that is within GFP processes. g, Images of CtBP2 superposed with PSD95 staining from c (white arrows) rotated in xz plane (scale bars, 1 μm). Images are from retinas that were collected 11 days post-TSA.
Extended Data Figure 5
Extended Data Figure 5. MG-derived GFP+ cells exhibit diverse morphologies
Panel of images showing 2D projections of GFP+ cells imaged post-recording (scale bars, 20 μm).
Extended Data Figure 6
Extended Data Figure 6. FACS purification of GFP+ cells
a, b, Live imaging of Ascl1-overexpressing retinas either untreated (a) or ANT-treated (b) before dissociation and FACS purification. c, Representative graph shows gating (P1 gate = viable cells) for viable cells from non-viable cells and debris. d, Gating P1 fraction for GFP fluorescence (P3 gate = GFP+ fraction). e, f, Post-sort on P3 fraction shows majority of GFP+ cells (88.7%) are viable after sorting.
Extended Data Figure 7
Extended Data Figure 7. ANT treatment results in MG-derived bipolar/amacrine-like cell cluster
a, Principal component analyses of 10x Genomics single-cell RNA-seq from aggregate wild-type and ANT-treated cells showing k-means clustering. b, Clusters identifying wild-type (brown, 701 cells) and ANT-treated (green, 825 cells) cells. c, Plots showing expression levels of glial genes Glul and Rlbp1. Expression of glial genes is reduced in the ANT-treated cells and further reduced in the MG-derived bipolar/amacrine-like cells. d, Plots showing expression levels of progenitor genes Ascl1 and Dll1. Ascl1 expression was only seen in ANT-treated cells. Dll1 appears to be increased in the large ANT-treated cluster but decreased in the bipolar/amacrine-like cluster. e, Plots showing expression levels of bipolar genes Otx2 and Cabp5. Both genes are enriched in the bipolar/amacrine-like cluster. f, Plots showing expression levels for amacrine genes Prox1 and Neurod4. Both genes are enriched in the bipolar/amacrine-like cluster. g, Plots showing expression levels for rod genes Rho and Nrl. Rod contamination shows enrichment for both genes in small cluster. h, Heat map of top 20 upregulated and differentially expressed genes for each cluster (scale, log2 fold change). Single-cell data are from retinas that were collected from ANT-treated mice 19 days post-TSA.
Extended Data Figure 8
Extended Data Figure 8. Epigenetic changes in MG-derived neurons
a, Violin plots of ATAC–seq tag density in the region 1 kb upstream of the promoters of genes that either decrease by twofold or increase by twofold between the wild-type and ANT-reprogrammed MG to show that the changes in gene expression are accompanied by changes in DNA accessibility during reprogramming with Ascl1, NMDA and TSA. The changes in gene expression were taken from the average of all Ascl1+ cells in the single-cell RNA-seq data from the Fluidigm data and compared with the wild-type MG from the same dataset. Notably, many progenitor genes, like Hes6 and Ascl1, show chromatin accessibility at putative cis-regulatory regions in all treatment conditions (including wild type) even though these genes are not normally expressed in the mature retina. b, H3K27ac ChIP was carried out on FACS-purified ANT-reprogrammed MG and wild-type MG. The data are shown as a per cent of control for three neural genes that show increases in expression and a control gene (Hoxb2) that does not change with ANT treatment. There was a substantial increase in H3K27ac for each of the genes tested. ChIP-PCR data are from ANT-treated retinas that were collected 19 days post-TSA.
Extended Data Figure 9
Extended Data Figure 9. FACS-purified ANT-treated cells show increased neuronal gene expression and Otx2 binding
a, Principal component analysis from Fluidigm single-cell mRNA-seq showing 48 wild-type MG (black), 9 ANT-treated cells (red), and 1 cell that was probably a contaminating rod photoreceptor (asterisk). The ANT-treated cells formed a separate cluster from the wild-type MG. b, Heat map showing ANT-treated MG-derived cells and wild-type MG. Each column is an individual cell, with example neural and glial genes as rows. Reprogramming with ANT leads to downregulation of glial genes and an increase in neural genes. Scale is log2(CPM). ANT-treated retinas were collected 46 days post-TSA. c, IGV browser tracks at bipolar genes Crx, Cplx4 and Cabp5 showing: Otx2 ChIP–seq from whole adult mouse retina (grey); Otx2 ChIP–seq from FACS-purified ANT-treated and Ascl1-only cells (blue); and DNA accessibility from ATAC–seq of FACS-purified ANT-treated cells (red). Scale for all tracks shown to the right as reads per million. Black arrows mark open chromatin in promoter regions that are bound by Otx2 in ANT-treated but not control Ascl1 cells, and are appropriate regions of binding based on a whole-retina Otx2 ChIP–seq dataset. d, e, Otx2 ChIP–seq peaks from ANT-treated cells show central enrichment at Otx2 ChIP–seq sites from whole adult retina, but this is not present in the Otx2 ChIP–seq from MG that expressed Ascl1 but received none of the other treatments (TSA, NMDA). f, Top-scoring transcription factor binding motif enrichment (HOMER software suite) from ANT-treated Otx2 ChIP–seq peak calls along with the closest matching transcription factor motif (TF match) and P value for de novo motif enrichment. g, Gene Ontology enrichment for category ‘Mouse Phenotype’ of peaks from d, showing P value for term enrichment, the number of associated genes (blue bars), and example genes from these enriched terms (expanded at right). ChIP–seq was performed on 490,430 and 692,271 pooled cells from 17 ANT-treated Rlbp1-Ascl1 and 15 untreated Rlbp1-Ascl1 mice, respectively. Retinas were collected 9–18 days post-TSA.
Figure 1
Figure 1. Conversion of MG into neurons by Ascl1 and TSA in vivo in adult mice
a, Mice strains used to express Ascl1 in MG. b, Paradigm for experiments. cg, Morphologies of Ascl1-overexpressing MG treated with c vehicle, d NMDA, and e NMDA + TSA; f, g, higher magnification of e (arrows). ONL, outer nuclear layer; OPL, outer plexiform layer; INL, inner nuclear layer, IPL, inner plexiform layer; GCL, ganglion cell layer. Images of cells in relative isolation chosen to highlight morphological phenotypes. h, Otx2+ MG-derived neurons lose Sox9 expression (arrows). i, Quantification of Otx2 in each condition in Glast-creER animals. *P <0.05; ***P < 0.001, one-way ANOVA with Tukey’s post hoc test. j, k, MG-derived neurons express bipolar cell-specific marker Cabp5 (j) and amacrine cell markers Pax6 and HuC/D (i; arrow). l, Quantification of Cabp5 or HuC/D in ANT-treated retinas (n = 3 mice per group). m, Representative images of MG-derived neuronal morphologies. Bipolar-like cells have processes in both the OPL and IPL, whereas amacrine-like cells have processes restricted to the IPL. All data are shown as mean ±standard error, all scale bars are 10 μm.
Figure 2
Figure 2. MG-derived neurons form synaptic connections with retinal circuitry
a, b, Super-resolution image of MG-derived neurons. c, Box from a shows Ctbp2 ribbon apposed to GFP+ process (arrows), series of 0.16-μm-thick z-stack. d, Orthogonal projection. e, MG-derived bipolar-like cell with processes in IPL. f–k, Super-resolution images from c (box) labelled as indicated; g–k, masked in Amira (see Methods). k, Image of Ctbp2 superposed with PSD95 from g (arrows), xz plane. l, m, MG-derived neuron before branding (arrow). n, Two-photon image of branded box around MG-derived neuron. o, Orthogonal projection of n. p, SBFSEM technique (see Methods). q, SBFSEM image of cell from n (arrow). r, s, Three-dimensional reconstruction of cell from n with process (green) penetrating cone terminal (magenta). t, SBFSEM image series of cell from n colour as in r. Scale bars are 10 μm (a, e, i, q), 1 μm (c, d, k, t) or 200 μm (l).
Figure 3
Figure 3. MG-derived GFP+ cells exhibit larger and faster visual responses than normal GFP MG
ac, Example recordings from GFP MG (a), MG-derived GFP+ cell (b) and GFP cone bipolar cell (c). Traces are visual responses to 500-ms steps in luminance, recorded in current-clamp. d, Population data for input resistance and resting membrane potential measurements. e, Population data for visual responses recorded with the current-clamp technique. f, Population data for light-evoked excitatory and inhibitory synaptic inputs recorded with the voltage-clamp technique. All cells recorded were from five ANT-treated mice. Recordings were performed at 4, 5, 10, 12 and 15 weeks post-TSA. Visual responses were found in cells regardless of post-TSA duration. GFP MG: Vrest, −81 ± 6 mV; Rin,41 ±17 MΩ; maximal response to light stimulation, 0.95 ± 0.52 mV; n = 3. GFP+ cells: Vrest, −46±11 mV, n = 19; Rin, 871 ±868 MΩ, n = 20; maximal response to light stimulation, 3.2 ±2.7 mV, n = 8; excitatory input, −10±8 pA, n = 8; inhibitory input, 10 ±7 pA, n = 4. GFP neurons: Vrest, −42±6 mV, n = 10; Rin, 1,088 ±836 MΩ, n = 10; maximal response to light stimulation, 13 ±6 mV, n = 4. All responses are written mean ±s.d.
Figure 4
Figure 4. ANT treatment enables epigenetic changes and expression of neuronal genes in MG
a, FACS-purified MG-derived neurons subjected to genomic analyses. b, k-means clustering of single-cell RNA-seq from wild-type (WT) and ANT-treated cells shown as a t-SNE plot. Heat map showing average expression of neural genes for all Ascl1+ cells in the ANT condition (19 days post-TSA) compared with wild type. c, ATAC–seq-normalized reads shown for sample progenitor (Hes6), MG (Rlbp1) and neural (Nefl) genes. DNA accessibility changes with Ascl1 expression (arrows). Scale at the bottom track for each set (reads per million, RPM). ANT-treated mice 15 days post-TSA. d, Gene Ontology enrichment for regions of increased DNA accessibility in ANT-treated cells compared with wild type. Examples of the ‘Nervous system development’ category are shown to the right. e, The number of genes in enriched GO categories from MG expressing Ascl1, Ascl1 and TSA, and from ANT-treated retinas. f, Top 5 transcription factor motifs in peaks of ANT, but not wild type; percentage of peaks with motif and enrichment score. g, ATAC–seq peaks for ANT versus TSA and NMDA were compared; ANT-specific peaks analysed for motif enrichment and Gene Ontology. Two of the top ten GO enriched Biological Processes were chromatin-remodelling genes. h, i, Otx2 ChIP–seq peaks from total retina, was compared with ATAC–seq from Grm6+ FACS-purified bipolar cells and the overlapping (bipolar-specific Otx2 peaks) regions intersected with the ANT peaks that were not present in the wild type (scale bar, 100 counts per million reads (CPM) for Otx2-ChIP and 10 CPM for ATAC–seq). j, Gene Ontology enrichment for Biological Process of peaks that overlap with ANT and bipolar cell Otx2 sites showing P value for term enrichment for neural genes.

References

    1. Fischer AJ, Reh TA. Müller glia are a potential source of neural regeneration in the postnatal chicken retina. Nat Neurosci. 2001;4:247–252. - PubMed
    1. Raymond PA, Barthel LK, Bernardos RL, Perkowski JJ. Molecular characterization of retinal stem cells and their niches in adult zebrafish. BMC Dev Biol. 2006;6:36. - PMC - PubMed
    1. Fausett BV, Goldman D. A role for alpha1 tubulin-expressing Müller glia in regeneration of the injured zebrafish retina. J Neurosci. 2006;26:6303–6313. - PMC - PubMed
    1. Wan J, Goldman D. Retina regeneration in zebrafish. Curr Opin Genet Dev. 2016;40:41–47. - PMC - PubMed
    1. Thummel R, Kassen SC, Montgomery JE, Enright JM, Hyde DR. Inhibition of Müller glial cell division blocks regeneration of the light-damaged zebrafish retina. Dev Neurobiol. 2008;68:392–408. - PMC - PubMed

Publication types

MeSH terms

Substances