. 2017 Aug 10;548(7666):219-223.
doi: 10.1038/nature23274. Epub 2017 Jul 26.

Prolonged Mek1/2 suppression impairs the developmental potential of embryonic stem cells

Affiliations

Prolonged Mek1/2 suppression impairs the developmental potential of embryonic stem cells

Jiho Choi et al. Nature. .

Abstract

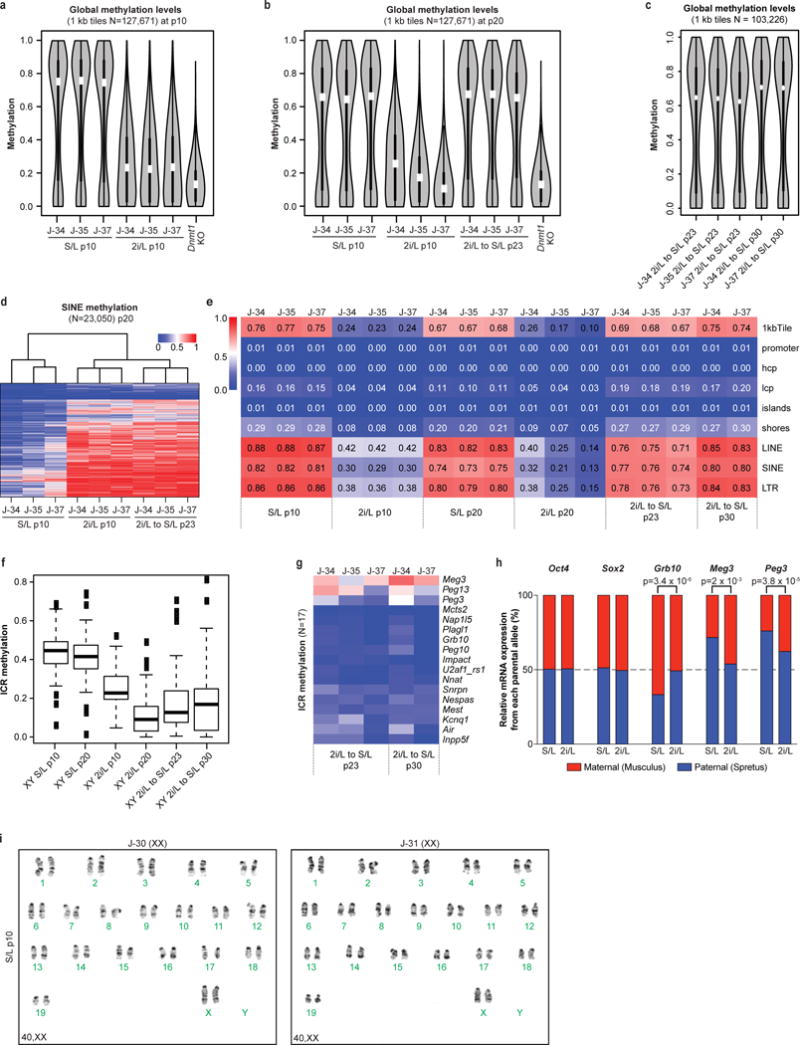
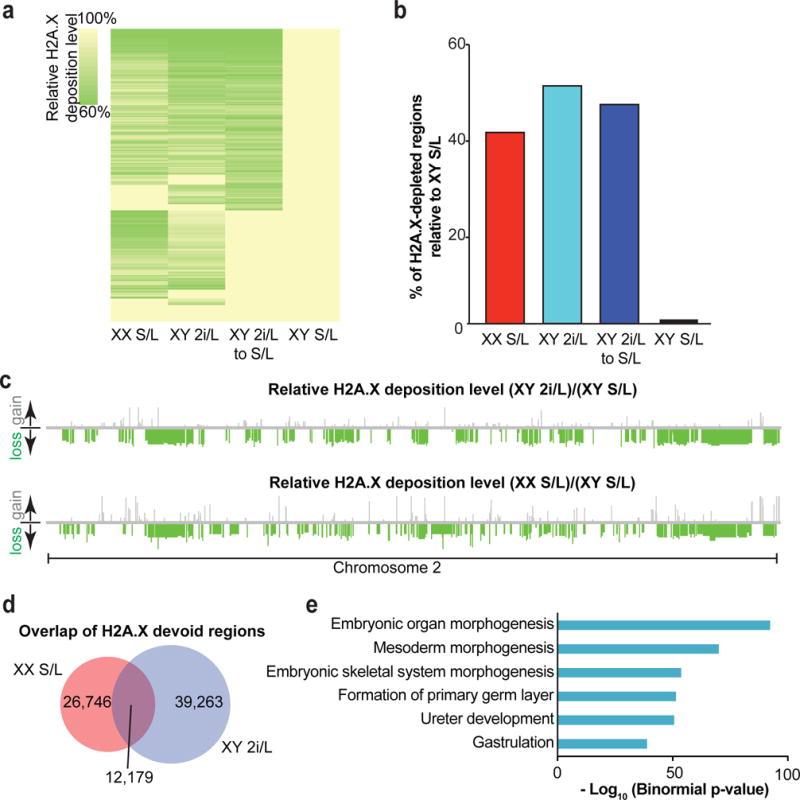
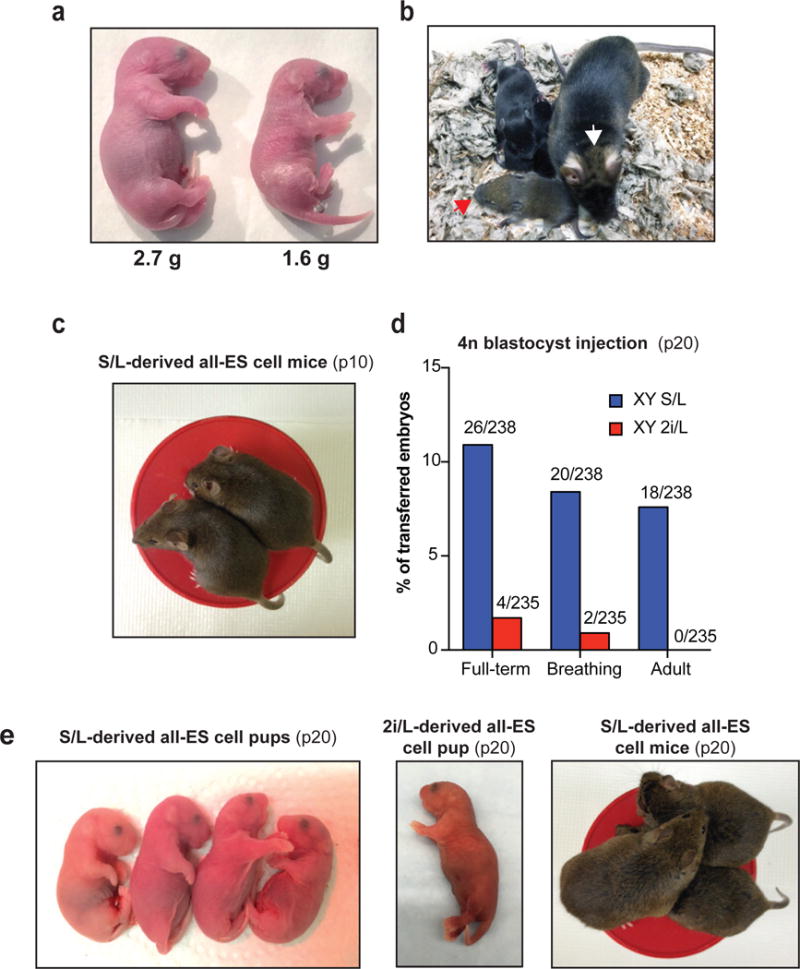
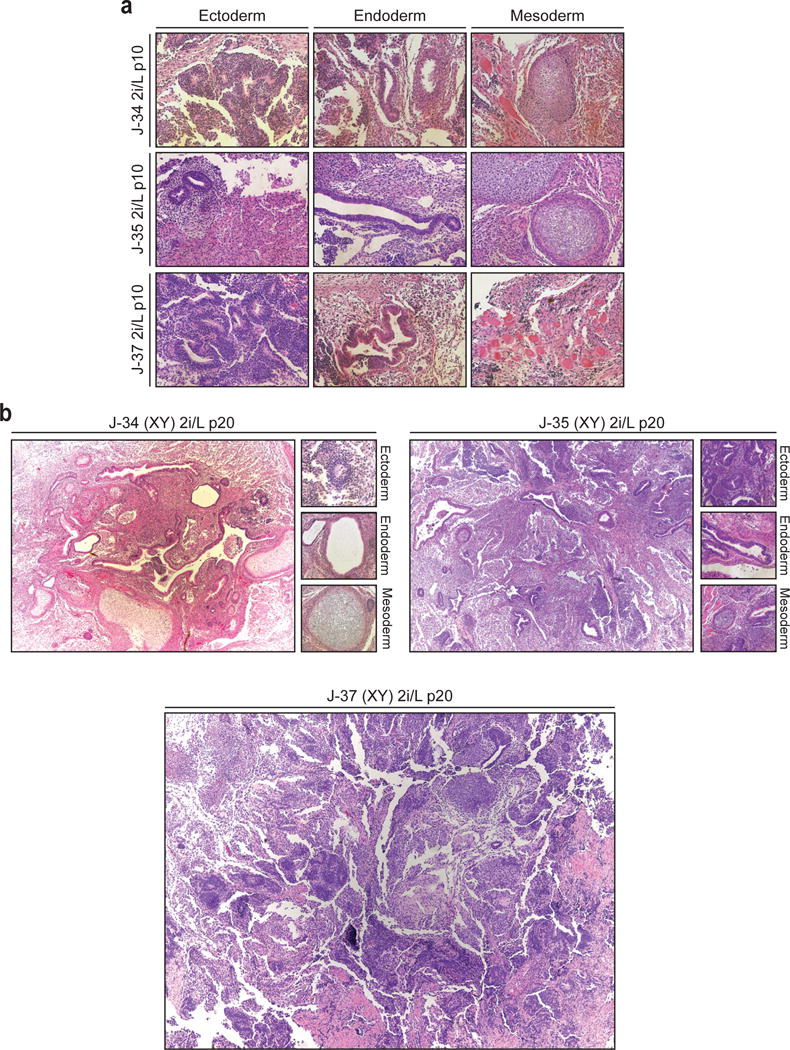
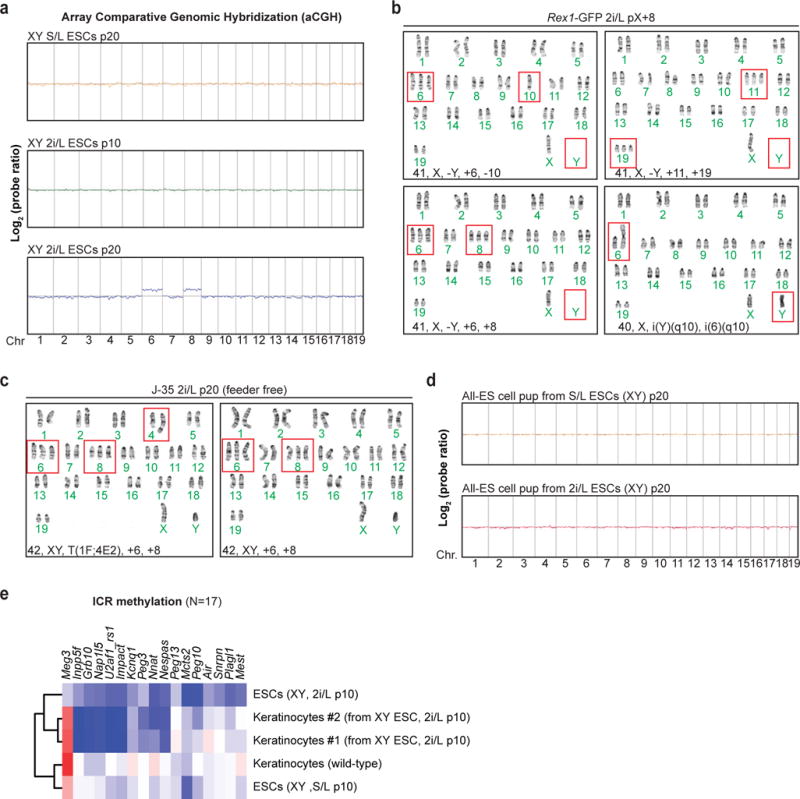
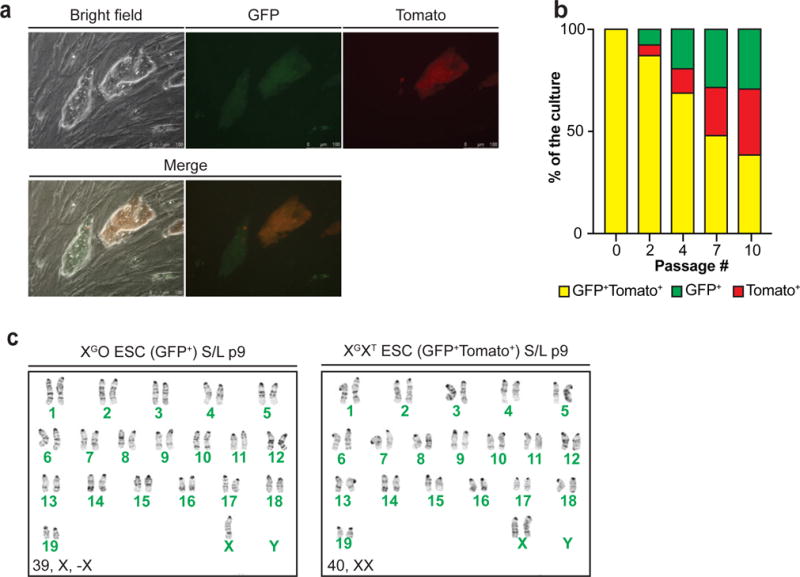
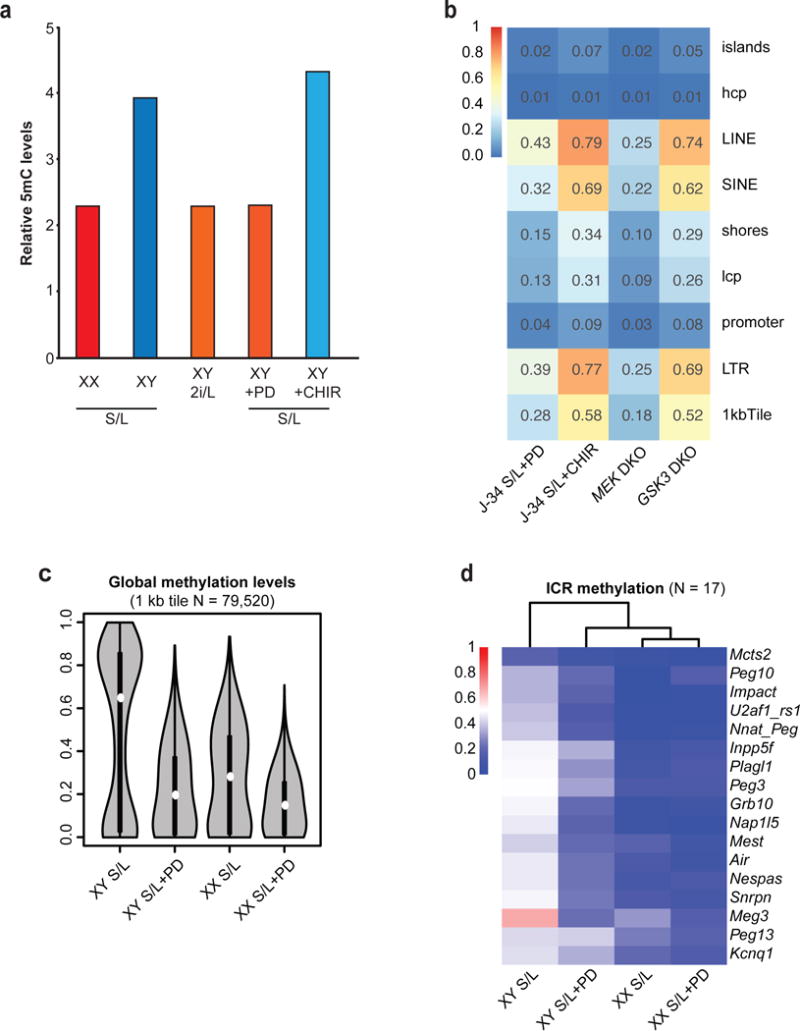
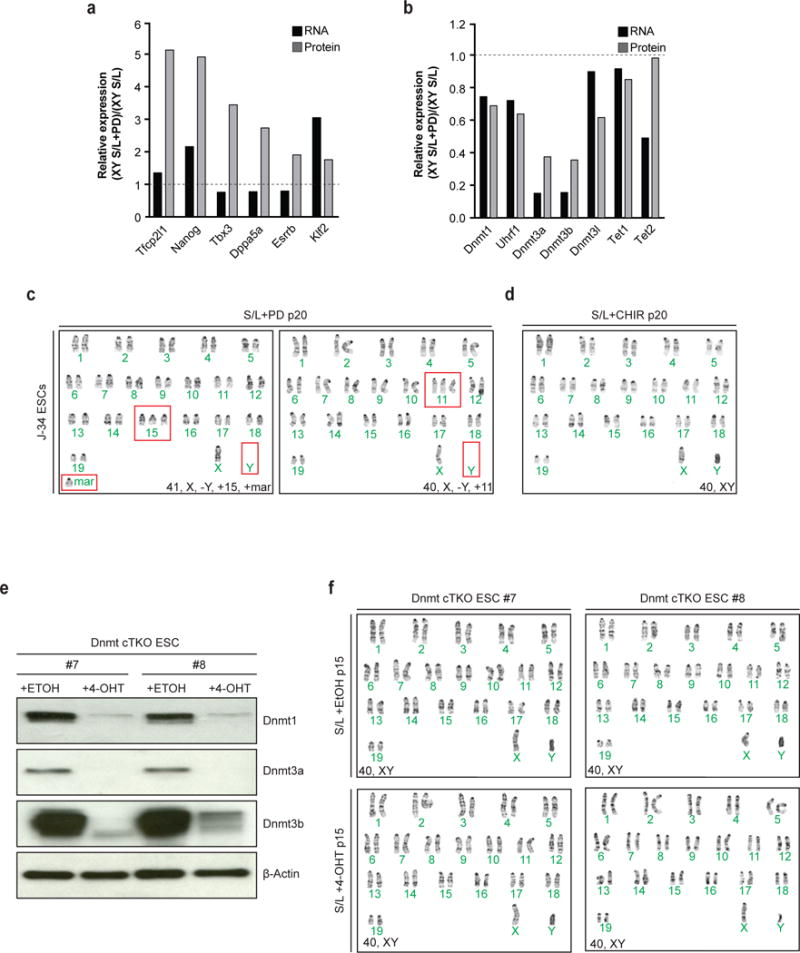
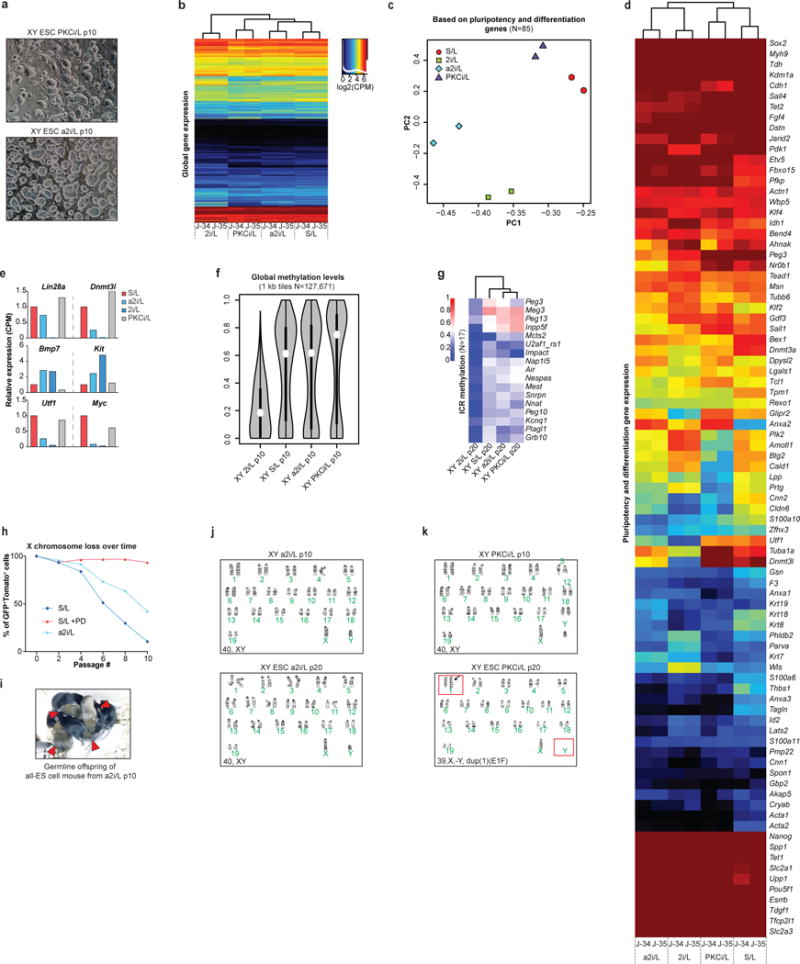
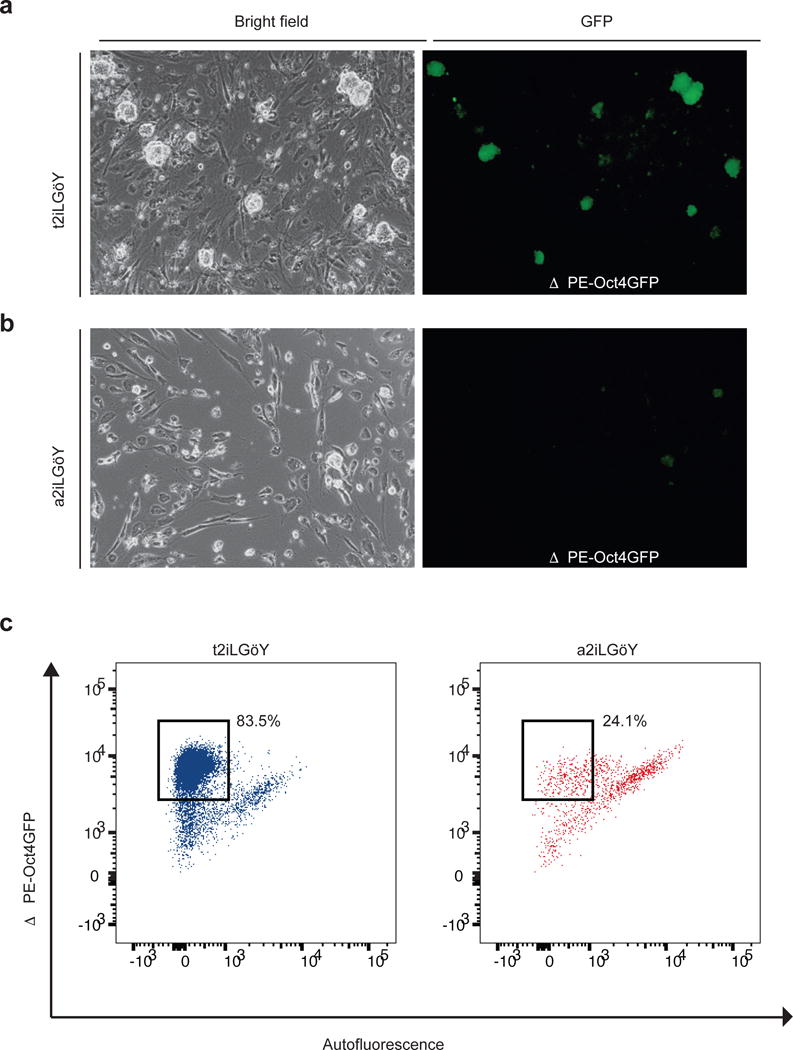
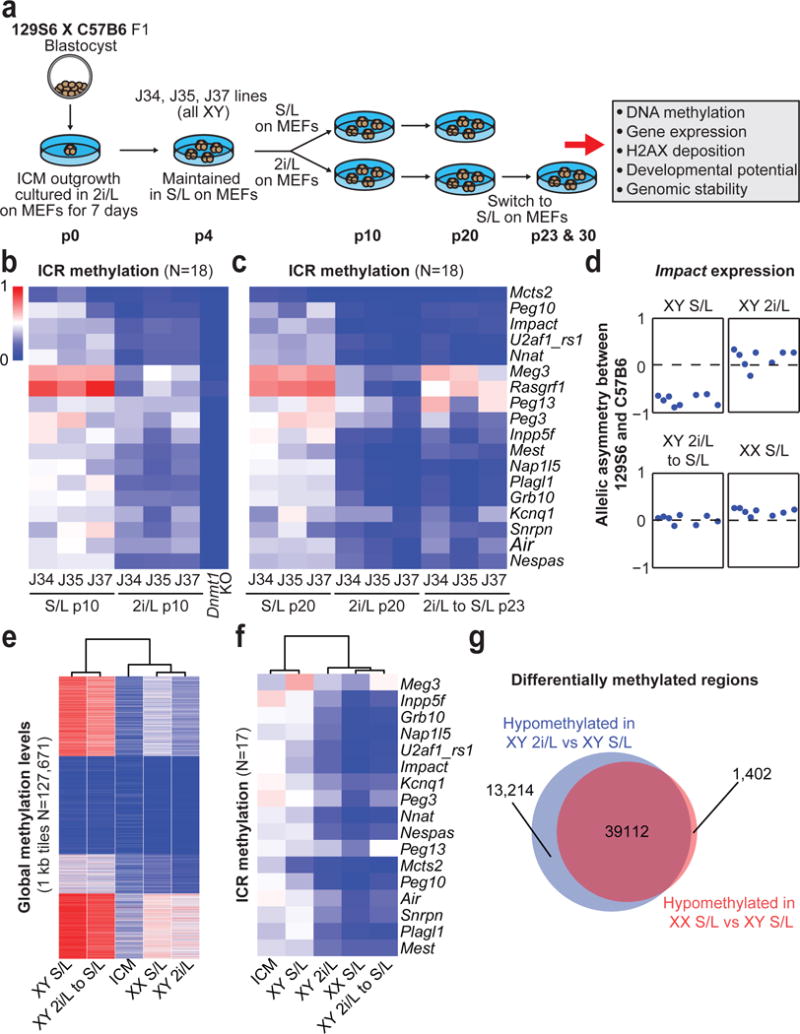
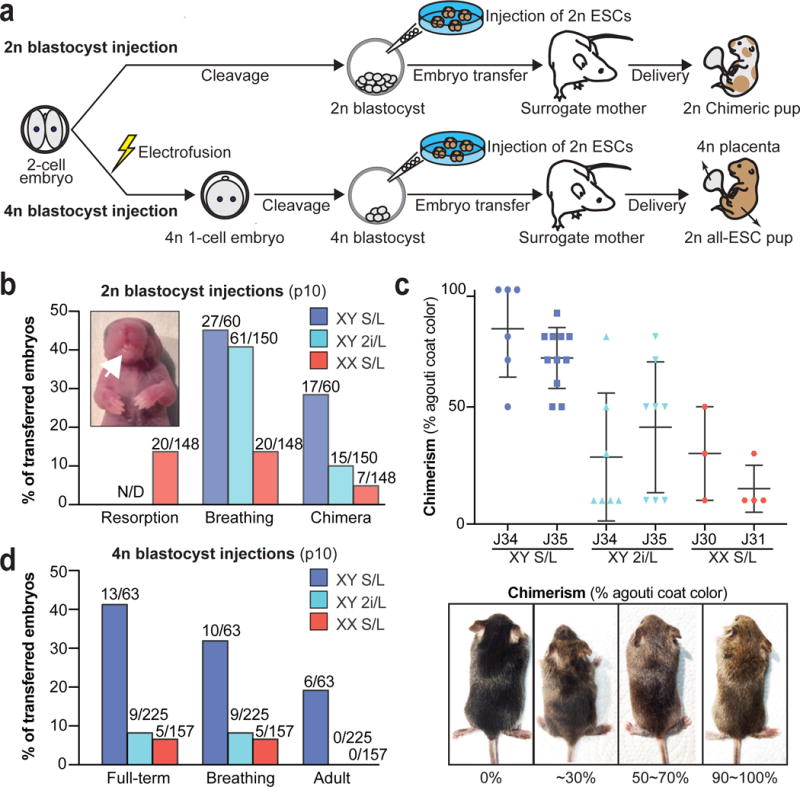
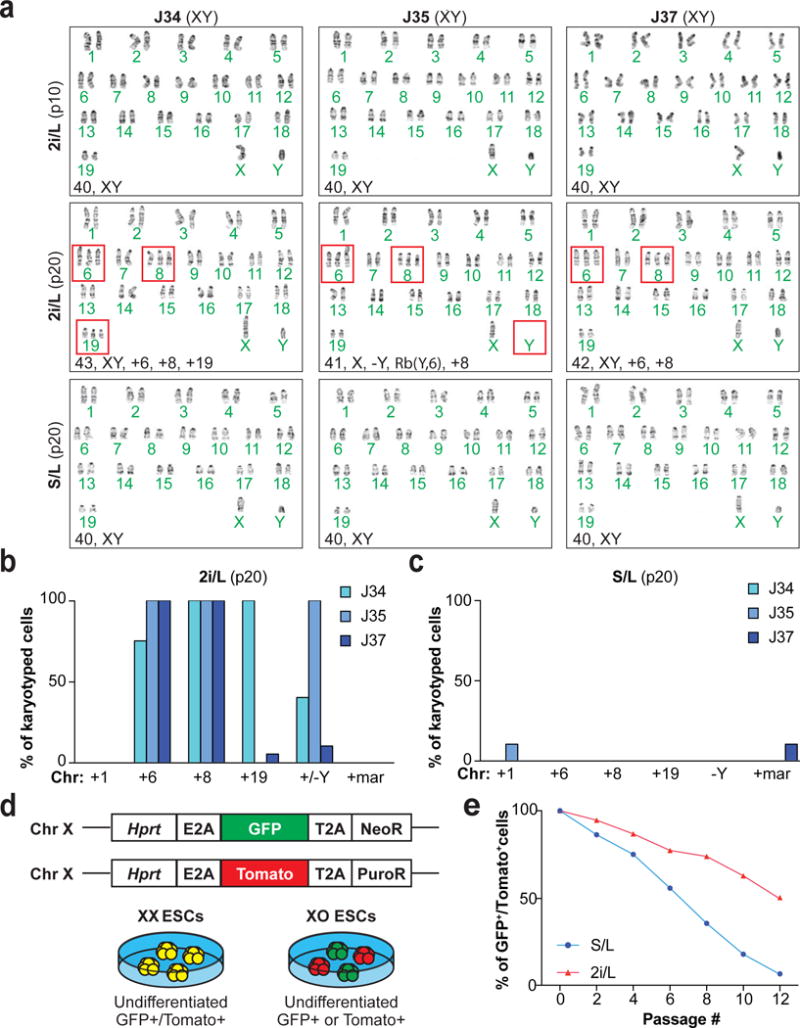
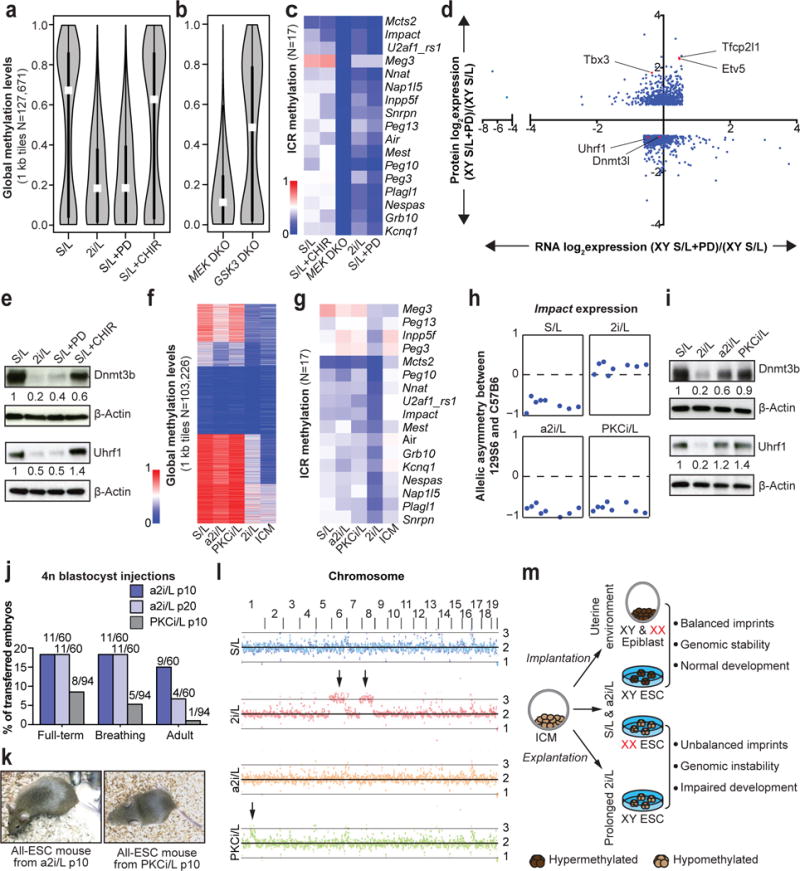
Concomitant activation of the Wnt pathway and suppression of Mapk signalling by two small molecule inhibitors (2i) in the presence of leukaemia inhibitory factor (LIF) (hereafter termed 2i/L) induces a naive state in mouse embryonic stem (ES) cells that resembles the inner cell mass (ICM) of the pre-implantation embryo. Since the ICM exists only transiently in vivo, it remains unclear how sustained propagation of naive ES cells in vitro affects their stability and functionality. Here we show that prolonged culture of male mouse ES cells in 2i/L results in irreversible epigenetic and genomic changes that impair their developmental potential. Furthermore, we find that female ES cells cultured in conventional serum plus LIF medium phenocopy male ES cells cultured in 2i/L. Mechanistically, we demonstrate that the inhibition of Mek1/2 is predominantly responsible for these effects, in part through the downregulation of DNA methyltransferases and their cofactors. Finally, we show that replacement of the Mek1/2 inhibitor with a Src inhibitor preserves the epigenetic and genomic integrity as well as the developmental potential of ES cells. Taken together, our data suggest that, although short-term suppression of Mek1/2 in ES cells helps to maintain an ICM-like epigenetic state, prolonged suppression results in irreversible changes that compromise their developmental potential.


Conflict of interest statement

The authors declare no competing financial interests. Readers are welcome to comment on the online version of the paper.

Figures

Extended Data Figure 1
Extended Data Figure 1. Effect of maintaining the naïve state on DNA methylation in ESCs
(a–c) Violin plots showing global methylation levels of ESCs at p10 (a), p20 (b) and after being placed back into S/L at p23 and 30 (c) by reduced representation bisulfite sequencing (RRBS). Hypomethylated Dnmt1 knock-out (KO) ESCs were included as control. White dots, median value. (d) Heatmap of DNA methylation levels at SINE elements in ESCs. (e) Median methylation levels of different genomic elements in the indicated conditions. (f) Box plot showing methylation levels of ICRs cultured in each condition. (g) ICR methylation levels after being re-exposed to S/L for the indicated passages. (h) RNA sequencing was performed on a F1 Mus musculus × Mus spretus stem cell line cultured in 2i/L for 6 passages. Normalized read counts of mRNA transcripts expressed from the paternal or maternal alleles are shown based on multiple allele-discriminating SNPs for each gene (6 or more SNPs per gene). Statistical analysis (two-tail t-tests) for allelic biases of the SNPs is shown. (i) Karyotyping results from two female ESC lines cultured in S/L for 10 passages.
Extended Data Figure 2
Extended Data Figure 2. Effects of prolonged 2i/L culture on H2A.X deposition in ESCs
(a) Heatmap showing global H2A.X deposition loss relative to male ESCs cultured in S/L. Three ESC lines per condition (male S/L, male 2i/L, female S/L) at passage 10 and two ESC lines (male 2i/L to S/L) at passage 30 were analyzed (see Fig. 1a). (b) Bar graph quantifying the percentage of H2A.X depleted regions relative to male ESCs cultured in S/L. Each bar represents median values of biological replicates of samples in (a). (c) Relative H2A.X deposition on a representative chromosome. Relative losses (green bars) or gains (gray bars) of H2A.X are mapped to their location on chromosome 2. (d) Overlap of devoid H2A.X regions common to both female ESCs cultured in S/L and male cells cultured in 2i/L. (e) H2A.X devoid regions present in the overlap identified in (d) were significantly enriched for genes involved in the listed developmental pathways. The GREAT bioinformatic database was used to bin the genes identified into transcriptional networks.
Extended Data Figure 3
Extended Data Figure 3. Developmental potential of ESCs cultured in S/L and 2i/L
(a) Representative image of a chimeric pup derived from female ESCs cultured in S/L (left) compared to a pup obtained through natural mating (right). Body weight of each pup was shown below. (b) Representative image of a low-grade adult chimera with patches of agouti hairs generated using female ESCs in S/L (white arrow). Her agouti germline offspring (red arrowhead) was generated by crossing her to a C57B6 wild-type mouse. (c) Representative image of all-ESC adult mice generated from male ESCs cultured in S/L for 10 passages. (d) Bar graphs showing percentages of transferred 4n blastocysts that survived to birth (“Full-term”), established regular breathing (“Breathing”) or survived past 5 weeks (“Adult”) using male ESCs grown in either S/L (blue bars) or 2i/L (red bars) until passage 20. The number of animals obtained per total number of transferred embryos is shown. (e) Representative images of all-ESC neonates produced from male ESCs cultured in S/L (left) and 2i/L (middle) at passage 20. Representative image of all-ESC adult mice generated from ESCs cultured in S/L at passage 20 (right).
Extended Data Figure 4
Extended Data Figure 4. Differentiation potential of male ESCs cultured in 2i/L
(a) Karyotype analysis of male ESC lines grown in 2i/L at p10. (b) Representative images of teratomas produced with three male ESC lines grown in 2i/L at p20 with depiction of germ layer differentiation where detectable.
Extended Data Figure 5
Extended Data Figure 5. Effects of prolonged 2i/L culture on chromosomal stability in ESCs
(a) Array comparative genomic hybridization (aCGH) analysis of the J-35 ESC line cultured in S/L or 2i/L condition for the indicated passage numbers. (b) Karyotype analysis of Rex1-dGFP ESC line grown in 2i/L for 8 passages after receiving the line. Red boxes indicate abnormal chromosomes detected. (c) Karyotype analysis of J35 ESC line grown in 2i/L in the absence of a layer of MEF feeder cells for 16 passages (p20). Red boxes indicate abnormal chromosomes detected. (d) aCGH analysis on DNA isolated from a newborn pup generated by 4n blastocyst injection using ESCs cultured in S/L or 2i/L at 20 passages. (e) Combined dendrogram and heatmap depicting ICR methylation levels in ESCs (n=3 biological replicates) and keratinocytes using RRBS analysis. “2i/L Keratinocytes” were explantated from chimeric adult mice derived from male 2i/L ESC p10 and purified by drug selection (G418).
Extended Data Figure 6
Extended Data Figure 6. Characterization of the XGXT ESC line
(a) Fluorescence microscopic images of XGXT ESCs. GFP/tdTomato double-positive cells (yellow cells in Merge 1 and 2) indicate two active X chromosomes while GFP+Tomato colony depicts cells that lost one of the X chromosomes. (b) GFP/tdTomato double-positive XGXT ESCs were sorted at passage 5 and plated in S/L (p6) before measuring the percentage of double-positive and single-positive cells at p8, 10, 13 and 16 using flow cytometry. (c) Karyotype analysis of undifferentiated, XGO (GFP-positive) or XTO (tdTomato-positive) ESCs (left) and GFP/tdTomato double-positive XGXT ESCs (right). GFP/tdTomato double-positive XGXT ESCs were sorted at passage 5 and maintained in S/L for 9 passages before analyzed. This result confirms that the progressive loss of GFP or TdTomato signal was due to the loss of an X and not X-inactivation due to differentiation.
Extended Data Figure 7
Extended Data Figure 7. Consequences of PD and CHIR treatment on DNA methylation
(a) Global methylation levels of were analyzed by 5mC dot blot analysis for male and female ESC lines cultured in the indicated conditions for 6 passages. (b) Median methylation levels at the indicated genetic elements following inhibition or loss of Mek1/2 or Gsk3α/β, respectively. (c) Violin plots showing global methylation levels of male and female ESCs cultured in S/L for 6 passages and then cultured for an additional 3 passages in S/L supplemented with PD. White boxes indicate median methylation levels. (d) Heatmap and dendrogram of ICR methylation levels in male and female ESCs shown in (c).
Extended Data Figure 8
Extended Data Figure 8. Chromosomal aberrations that occur in 2i/L cultured ESCs are in part due to Mek1/2 inhibition
(a) Quantification of relative RNA and protein levels of pluripotency-related genes between male ESCs in S/L (n=2 technical replicates) and male ESCs in S/L+PD (n=2 technical replicates). (b) Quantification of relative RNA and protein levels of genes that facilitate DNA methylation between male ESCs in S/L (n=2 technical replicatges) and male ESCs in S/L+PD (n=2 technical replicates) (see Fig. 4d). (c–d) Karyotype analysis of male ESCs cultured in S/L for 4 passages and subsequently cultured in either S/L+PD (c) or S/L+CHIR (d) for additional 16 passages. +Mar stands for chromosomal fragment of unknown origin. Red boxes indicate abnormal chromosomes detected. (e) Western blot analysis of a Dnmt cTKO ESC line for Dnmt1, Dnmt3a and Dnmt3b after treatment with either 4-OHT or EtOH for one passage. (f) Karyotype analysis of a Dnmt cTKO ESC line that was treated with either 4-OHT or EtOH for one passage and subsequently cultured for 15 passages in S/L.
Extended Data Figure 9
Extended Data Figure 9. Characterization of alternative culture conditions for ESCs
(a) Representative images of XY ESCs cultured in the indicated conditions. (b) Heatmap and dendrogram of global gene expression levels in male ESCs cultured in the indicated conditions. (c) Principal component analysis of ESCs cultured in S/L, 2i/L, a2i/L or PKCi/L using a previously published set of known pluripotency and differentiation genes. Two male ESC lines maintained in S/L for 4 passages were switched to each condition and cultured for additional 6 passages (final passage 10). (d) Heatmap and dendrogram showing expression levels of pluripotency and developmental genes in male ESC lines cultured in the indicated conditions. (e) Relative expression levels of transcripts associated with naïve pluripotency in (d). (f) Violin plots of global methylation levels in the indicated ESC lines. White dots, median value. (g) Heatmap and dendrogram of ICR methylation levels in the indicated ESCs lines. (h) Flow-cytometric analysis of GFP and TdTomato after culturing XGXT ESCs in S/L, S/L+PD and a2i/L for the indicated passages. (i) Agouti germline offspring (red arrows), obtained from across between an all-ESC male generated from p10 a2i/L-cultured ESCs and a C57B6 female. (j–k) Karyotype analysis of male ESCs cultured in a2i/L for 6 or 16 passages (j), or PKCi/L for 6 or 16 passages (k). Red boxes indicate abnormal chromosomes detected.
Extended Data Figure 10
Extended Data Figure 10. MEK1/2-independent culture of naïve hESCs
(a) Representative image of human ESCs (hESCs) carrying a naïve-specific OCT4-EGFP reporter (ΔPE-Oct4GFP) cultured in the presence of small molecule inhibitors of the ROCK, MEK1/2, GSK3 and PKC kinases (t2iLGöY). Bright field image (left) and GFP expression (right). (b) Representative image of ΔPE-Oct4GFP hESCs cultured in the presence of small molecule inhibitors of the ROCK, SRC, GSK3 and PKC kinases (a2iLGöY). Bright field image (left) and GFP expression (right). (c) Flow-cytometric analysis of EGFP expression in ΔPE-Oct4GFP hESCs cultured in t2iLGöY or a2iLGöY.
Figure 1
Figure 1. Erosion of genomic imprints in 2i/L-cultured male ESCs and S/L-cultured female ESCs
(A) Schematic of experimental design. p, passage. (B,C) ICR methylation levels in ESCs at p10 (B) and p20, 23 (C). (D) Allelic expression of the imprinted gene Impact. (E,F) Global (D) and ICR (E) methylation levels in male ESCs at p20 and 23 (n=3 biological replicates) and female ESCs at p6 (n=3 biological replicates). ICM, Inner cell mass. (G) Overlap of differentially methylated regions.
Figure 2
Figure 2. Prolonged 2i/L culture impairs the developmental potential of ESCs
(A) Schematic of blastocyst injection protocol. (B) 2n blastocyst injections. Numbers of animals obtained per total number of transferred embryos are shown. White arrow indicates the protruding tongue of a female pup. N/D, not determined. Details in Supplementary Table 1. (C) Quantification of coat color chimerism of the chimeras from (B) (top). Representative images of the varying degrees of chimerism (below). (D) 4n blastocyst injections. Numbers of animals obtained per total number of transferred embryos are shown. Details in Supplementary Table 2.
Figure 3
Figure 3. Impact of prolonged 2i/L culture on chromosomal stability
(A) Karyotyping analysis of male ESC lines. Red boxes indicate abnormal chromosomes detected. (B–C) Quantification of the chromosomal abnormalities found in 2i/L-cultured (B) and S/L-cultured (C) male ESCs at p20. (D) Schematic of the XGXT ESC line and expected differences between XX and XO ESCs. (E) Quantification of X chromosome loss in XGXT ESCs cultured in S/L or 2i/L.
Figure 4
Figure 4. Mek1/2 suppression underlies the epigenetic and chromosomal changes observed in ESCs
(A) Global methylation levels of male ESC cultured in indicated conditions (n=3 biological replicates). White dots, median value. (B) Global methylation levels of Mek1/2 double knock-out (DKO) iPSCs and GSk3α/β DKO ESCs cultured in S/L. White dots, median value. (C) ICR methylation levels in male pluripotent stem cells with the indicated pharmacological or genetic perturbations. (D) Differential protein levels between S/L and S/L+PD (>1.5-fold) are plotted along the y-axis and the corresponding differentially expressed RNAs are plotted along the x-axis. (E) Western blot analysis of Dnmt3b and Uhrf1 in the labeled consitions. (F–G) Global (F) and ICR (G) methylation levels in male ESCs cultured in indicated conditions. ICM, inner cell mass. (H) Allelic expression of the imprinted gene Impact. (I) Western blot analysis of Dnmt3b and Uhrf1 in the labeled conditions. (J) 4n blastocyst injections. Numbers of animals obtained per total number of transferred embryos are shown. Details in Supplementary Table 2. (K) Adult all-ESC mice generated using a2i/L-cultured (left) or PKCi/L-cultured (right) male ESCs. (L) Chromosomal copy number analysis by whole genome sequencing. Black arrows indicate trisomies 6 and 8 in 2i/L-cultured ESC lines and the partial amplification of chromosome 1 in PKCi/L-cultured ESC lines, respectively. (M) Graphical summary of results.

Comment in

References

    1. Ying QL, et al. The ground state of embryonic stem cell self-renewal. Nature. 2008;453:519–523. - PMC - PubMed
    1. Raggioli A, Junghans D, Rudloff S, Kemler R. Beta-catenin is vital for the integrity of mouse embryonic stem cells. PLoS ONE. 2014;9:e86691. - PMC - PubMed
    1. Chen H, et al. Erk signaling is indispensable for genomic stability and self-renewal of mouse embryonic stem cells. Proc Natl Acad Sci USA. 2015;112:E5936–43. - PMC - PubMed
    1. Chen RZ, Pettersson U, Beard C, Jackson-Grusby L, Jaenisch R. DNA hypomethylation leads to elevated mutation rates. Nature. 1998;395:89–93. - PubMed
    1. Gaudet F, et al. Induction of tumors in mice by genomic hypomethylation. Science. 2003;300:489–492. - PubMed

Publication types