. 2017 Jul 26;13(7):e1006931.
doi: 10.1371/journal.pgen.1006931. eCollection 2017 Jul.

Dynamic hyper-editing underlies temperature adaptation in Drosophila

Affiliations

Dynamic hyper-editing underlies temperature adaptation in Drosophila

Ilana Buchumenski et al. PLoS Genet. .

Abstract

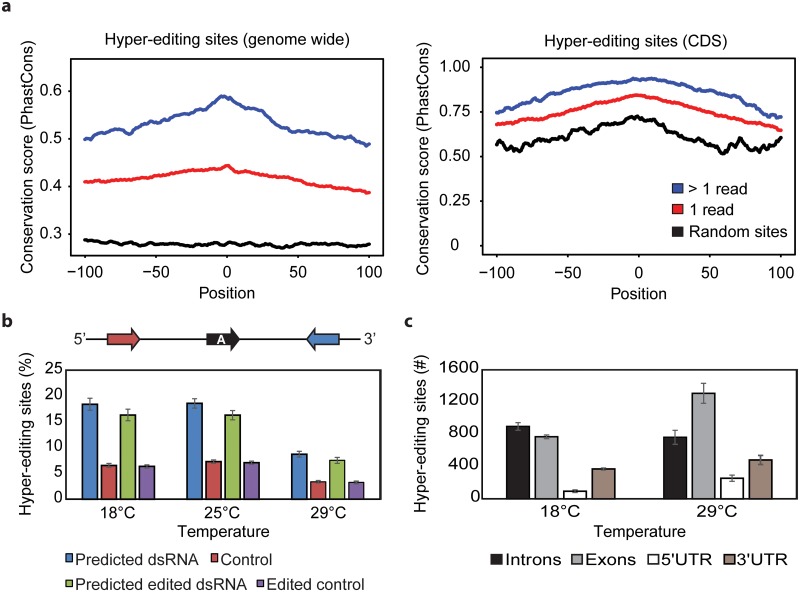
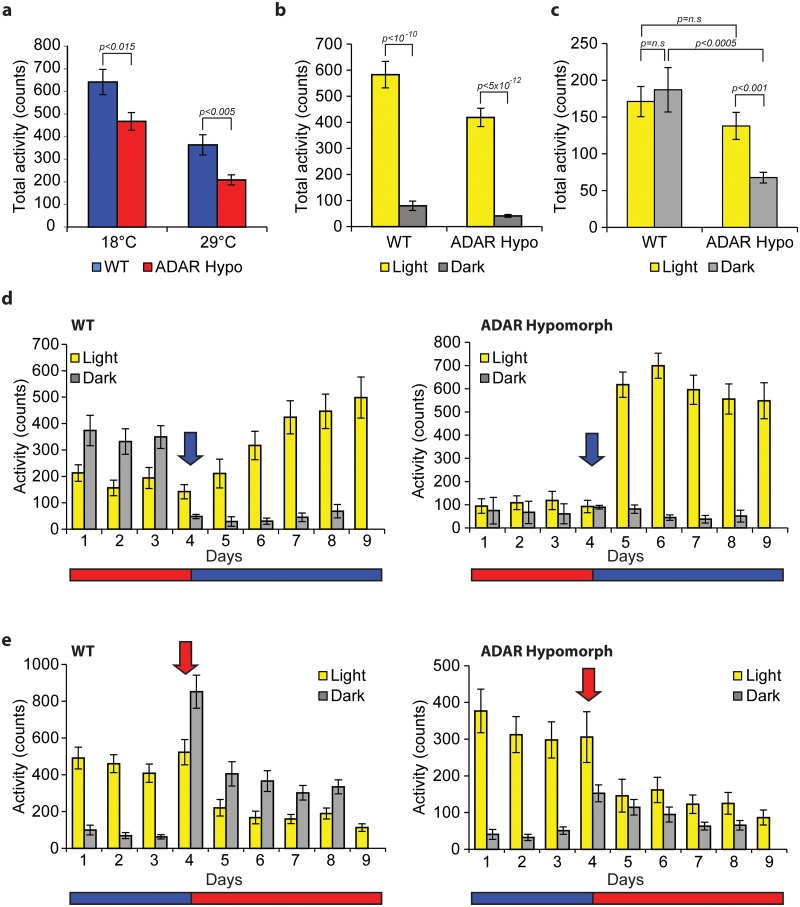
In Drosophila, A-to-I editing is prevalent in the brain, and mutations in the editing enzyme ADAR correlate with specific behavioral defects. Here we demonstrate a role for ADAR in behavioral temperature adaptation in Drosophila. Although there is a higher level of editing at lower temperatures, at 29°C more sites are edited. These sites are less evolutionarily conserved, more disperse, less likely to be involved in secondary structures, and more likely to be located in exons. Interestingly, hypomorph mutants for ADAR display a weaker transcriptional response to temperature changes than wild-type flies and a highly abnormal behavioral response upon temperature increase. In sum, our data shows that ADAR is essential for proper temperature adaptation, a key behavior trait that is essential for survival of flies in the wild. Moreover, our results suggest a more general role of ADAR in regulating RNA secondary structures in vivo.


Conflict of interest statement

The authors have declared that no competing interests exist.

Figures

Fig 1
Fig 1. The degree and prevalence of A-to-I RNA editing are dynamically affected by temperature.
(A) Generation of editing list by combining the RADAR database (2,697 sites), Rennan's and Rosbash's datasets[11,32] (3,580 and 1,341 sites respectively) with novel hyper-editing sites detected by our method (30,190 sites). This resulted in a list of 32,974 unique sites, containing 11,097 editing sites in CDS. (B) Hyper-editing motif. The sequence near the hyper-editing sites is depleted of Gs upstream and enriched with Gs downstream as expected from ADAR targets. (C) Editing index, fraction of inosines among all expressed adenosines of all detected editing sites, show lower editing levels at 29°C. (D) Editing levels of significantly altered 55 editing sites in CDS. Each site is presented by a number which indicates its position in S1 Table. (E) The distribution of hyper-editing detected sites, shows higher number of sites found at elevated temperature. (F) Average hyper-editing events per detected sites. Statistical significance between 18°C and 29°C was assessed by Student-t test (p<10−4). (G) Editing cluster's difference between temperatures. Left panel presents the average cluster length for each temperature. Right panel presents the average unique number of detected editing-sites for each temperature.
Fig 2
Fig 2. Editing sites at lower temperatures are edited more frequently and are more commonly flanked by complementary sequences.
(A) Mean conservation (PhastCons) score of hyper-edited sites. Position 0 indicates the position of editing site. Blue line denotes conservation mean for editing sites supported by more than one event, red line denoted conservation mean for editing sites supported by only one event, and black line represents background conservation of chosen randomly adenosines. Left figure represents all genome wide hyper-editing sites, while the right figure represents hyper-editing sites in coding regions (CDS). The information from the non-hyper-edited reads was included. (B) RNA secondary structure prediction using BLAST[50] tool (see Methods). Blue bars donate for predicted dsRNA structure involving the hyper-editing site, as we succeeded to match the editing regions with their anti-sense sequence. Red bars denote for matches found in the sense sequence, representing the control. Green bars denote for predicted dsRNA structure involving the hyper-editing site after converting the adenosine (A) to its edited form, guanosine (G). Violet bars represents the control for the converted adenosines. (C) Genomic locations of detected hyper-editing sites show increase in the number of exonic sites at 29°C.
Fig 3
Fig 3. ADAR hypomorphs display weaker adaptation of their transcriptome to temperature shifts.
(A) 'Volcano plot' showing gene expression differences in 29°C vs. 18°C in WT and ADAR hypomorph flies. Colored dots indicate genes significantly changing between the temperatures (p < 0.05, log2 (fold change) > 1). (B) Fold change levels of differentially expressed genes in 29°C vs. 18°C (selected as described in A) are plotted in a log scale WT against ADAR hypomorph. Orange dots indicate genes in which the fold change ratio between WT and ADAR hypomorph is > 2 or < 0.5 (C) Editing index, fraction of inosines among all expressed adenosines of all detected editing sites, for differentially expressed genes between control and ADAR hypomorph flies (light bars). Brown bars donate for editing index in all expressed genes. Black bars donates for editing index in control set of 60% most expressed genes. The p.values were calculated using bootstrapping exam with 10,000 random sampling from the control set. The editing levels were calculated on wild type CantonS strain. (D) Cumulative distribution plot for all genes differentially expressed between 29°C and 18°C. Kolmogorov-Smirnov test was used to determine the statistical significance of the differences between the curves (p < 0.0001). (E) Fold change levels of differentially expressed genes in 29°C vs. 18°C that are affected by ADAR hypomorph only in 18°C. Plot was generated as described in B. (F) Cumulative distribution plot of genes differentially expressed at 29°C vs. 18°C that are affected by ADAR hypomorph only in 18°C. Kolmogorov-Smirnov test was used to determine the statistical significance of the differences between the curves (p < 0.001).
Fig 4
Fig 4. ADAR hypomorph flies display temperature dependent behavioral abnormalities.
(A) ADAR hypomorph flies (red) are less active than control flies (blue) both at 18°C and 29°C. Total activity per day obtained by adding the average activity during the light and dark periods (8 days). N = 32 and 29 for hypomorph flies at 18°C and 29°C respectively and N = 27 for control flies at both temperatures. Statistical significance was assessed by Student-t test. Error bars represents SEM. (B) Although less active than their controls, at 18°C, the pattern of day-night activity of ADAR hypomorph and control flies is similar, with higher activity during the day. We calculated and ploted the average activity during the light (9 days) or dark periods (8 nights). Statistical significance was assessed by Student-t test. Error bars represents SEM. (C) At 29°C, control flies increase their night activity whereas the ADAR hypomorph flies remaine active mostly during the day. Statistical significance was assessed by Student-t test. Error bars represents SEM. (D) Behavioral activity assay for control (left) and ADAR hypomorph flies (right) that were exposed to 12:12h light:dark (L:D) cycles at 29°C for 4 days and then transferred to 18°C (L:D cycles) for 5 days. N = 29 for control and N = 32 for Adar hypomorph flies. An arrow marks the transition time point. Error bars represent SEM. (E) same as in (D), with the opposite temperature transfer, from 18 to 29°C. N = 30 for control and N = 31 for ADAR hypomorph flies. An arrow marks the transition time point.

References

    1. Frye M, Jaffrey SR, Pan T, Rechavi G, Suzuki T. RNA modifications: what have we learned and where are we headed? Nat Rev Genet. 2016;17: 365–372. doi: 10.1038/nrg.2016.47 - DOI - PubMed
    1. Savva YA, Rieder LE, Reenan RA. The ADAR protein family. Genome Biol. 2012;13: 252 doi: 10.1186/gb-2012-13-12-252 - DOI - PMC - PubMed
    1. Bass BL. RNA Editing by Adenosine Deaminases That Act on RNA. Annual Reviews 4139 El Camino Way, P.O. Box 10139, Palo Alto, CA 94303–0139, USA; 2003; http://www.annualreviews.org/doi/full/10.1146/annurev.biochem.71.110601.... - DOI
    1. Nishikura K. A-to-I editing of coding and non-coding RNAs by ADARs. Nat Rev Mol Cell Biol. 2016;17: 83–96. doi: 10.1038/nrm.2015.4 - DOI - PMC - PubMed
    1. Lengyel P, Speyer JF, Ochoa S. Synthetic Polynucleotides and the Amino Acid Code. Proc Natl Acad Sci U S A. 1961;47: 1936–1942. - PMC - PubMed

MeSH terms