. 2017 Jul 25;20(4):779-784.
doi: 10.1016/j.celrep.2017.07.004.

The Lifespan and Turnover of Microglia in the Human Brain

Affiliations

The Lifespan and Turnover of Microglia in the Human Brain

Pedro Réu et al. Cell Rep. .

Abstract

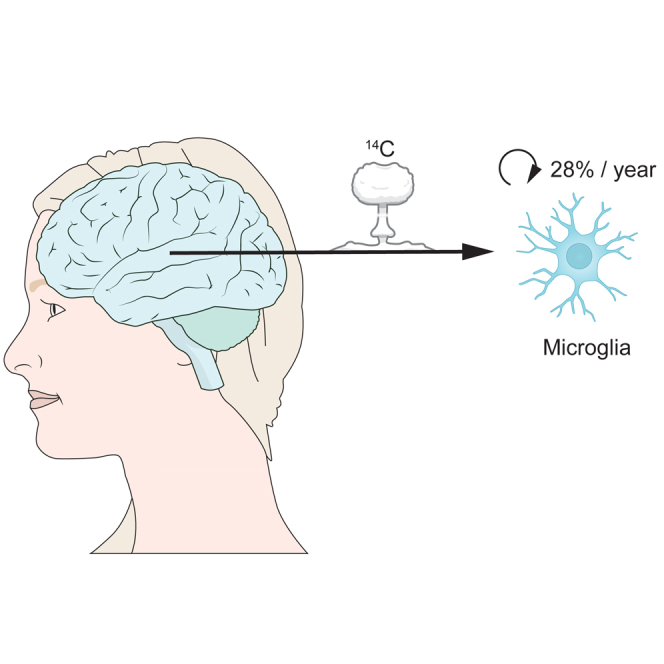
The hematopoietic system seeds the CNS with microglial progenitor cells during the fetal period, but the subsequent cell generation dynamics and maintenance of this population have been poorly understood. We report that microglia, unlike most other hematopoietic lineages, renew slowly at a median rate of 28% per year, and some microglia last for more than two decades. Furthermore, we find no evidence for the existence of a substantial population of quiescent long-lived cells, meaning that the microglia population in the human brain is sustained by continuous slow turnover throughout adult life.

Keywords: human; microglia; proliferation; renewal; turnover.


Figures

None
Graphical abstract
Figure 1
Figure 1
IdU Incorporation (A) Confocal image with orthogonal projections, from human cortex, revealing microglia positive for Iba1. (B) Co-staining of Iba1 and the thymidine analog IdU. (C) Percentage of microglia incorporating IdU per day (mean ± SD). Each data point represents a glass slide. Nuclei are labeled with antibodies to histone H3. Scale bars, 10 μm.
Figure 2
Figure 2
Microglia Isolation (A) Unstained brain single-cell suspension following CD11b isolation with magnetic beads. (B) Sorting gate for FACS sorting of stained microglial cells. (C) Representative post-sort purity of microglia sample. (D) FACS plot representing the percentage of positive cells for the B cell marker CD20 in a brain sample prior to MACS purification. (E) FACS plot representing the percentage of positive cells for CD20 in a sample of peripheral blood. (F) Blood cells were positively selected with CD11b microbeads, labeled with CFSE (red gate), and then spiked into a brain preparation previously selected with CD11b microbeads. (G) Gating strategy for the sorting of microglia (spiked blood cells in red). (H) qRT-PCR reveals that, when compared with the magnetic bead negative fraction, the FACS sorted microglia sample is several hundred-fold enriched for mRNA of the microglia markers Iba1, CD11b, and CD45 and depleted of mRNA for markers of neurons (NeuN), astrocytes (GFAP), and oligodendrocytes (MBP). (I) FACS sorted cells are positive for the microglial marker Iba-1 (A488). Scale bar, 10 μm.
Figure 3
Figure 3
Microglial Population Dynamics (A) Schematic illustration of the 14C atmospheric curve over time (Levin et al., 2010). The concentration of 14C in the genomic DNA of a cell population is dependent on the atmospheric 14C concentration (y axis). Thus, the birth date of the cell population can be read off the x axis. (B) 14C content in the genomic DNA of human cortical microglia from donors born across six decades. Data points plotted along the x axis according to the date of birth of the donors. Close-up view of four nearly overlapping data points (gray square). The error bars represent the 14C concentration measurement error. (C) Representation of the average age of microglia in each individual and linear regression (black line). (D) Different models for distribution of data on the atmospheric 14C curve considering different frequencies of dividing cells. The model that best fits the data are one where most cells (>96%) renew. (E) Considering the turnover rate, the average cell age, and the fact that all microglial cells do not divide simultaneously, we created a stochastic cell age distribution model. Our model shows that within an individual there is a distribution of cells of different ages, with some having recently renewed and others not having divided in more than 20 years (donors with infinite turnover not included). (F) The approximate rate of microglia turnover is 0.08% a day, a low turnover rate in comparison with other immune cells (granulocytes, monocytes, and naive B cells) but a high turnover rate relative to other CNS cells (neurons in the dentate gyrus, oligodendrocytes, and cortical neurons).

References

    1. Ajami B., Bennett J.L., Krieger C., Tetzlaff W., Rossi F.M. Local self-renewal can sustain CNS microglia maintenance and function throughout adult life. Nat. Neurosci. 2007;10:1538–1543. - PubMed
    1. Askew K., Li K., Olmos-Alonso A., Garcia-Moreno F., Liang Y., Richardson P., Tipton T., Chapman M.A., Riecken K., Beccari S. Coupled proliferation and apoptosis maintain the rapid turnover of microglia in the adult brain. Cell Rep. 2017;18:391–405. - PMC - PubMed
    1. Bergmann O., Liebl J., Bernard S., Alkass K., Yeung M.S., Steier P., Kutschera W., Johnson L., Landén M., Druid H. The age of olfactory bulb neurons in humans. Neuron. 2012;74:634–639. - PubMed
    1. Bernard S., Frisén J., Spalding K.L. A mathematical model for the interpretation of nuclear bomb test derived 14C incorporation in biological systems. Nucl. Instrum. Methods Phys. Res. B. 2010;268:1295–1298.
    1. Beura L.K., Hamilton S.E., Bi K., Schenkel J.M., Odumade O.A., Casey K.A., Thompson E.A., Fraser K.A., Rosato P.C., Filali-Mouhim A. Normalizing the environment recapitulates adult human immune traits in laboratory mice. Nature. 2016;532:512–516. - PMC - PubMed

Publication types