. 2017 Jul 25;20(4):999-1015.
doi: 10.1016/j.celrep.2017.07.006.

A Landscape of Therapeutic Cooperativity in KRAS Mutant Cancers Reveals Principles for Controlling Tumor Evolution

Affiliations

A Landscape of Therapeutic Cooperativity in KRAS Mutant Cancers Reveals Principles for Controlling Tumor Evolution

Grace R Anderson et al. Cell Rep. .

Abstract

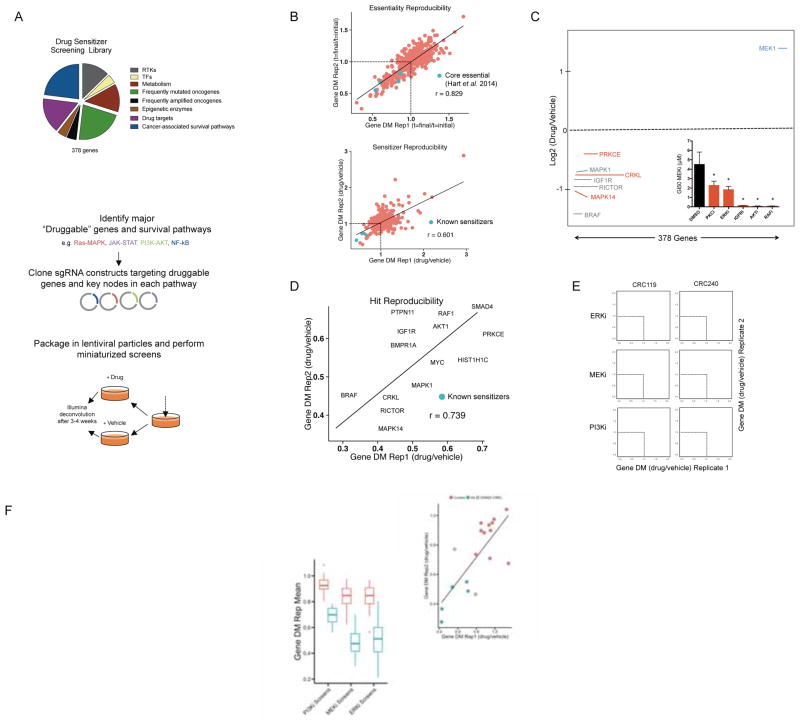
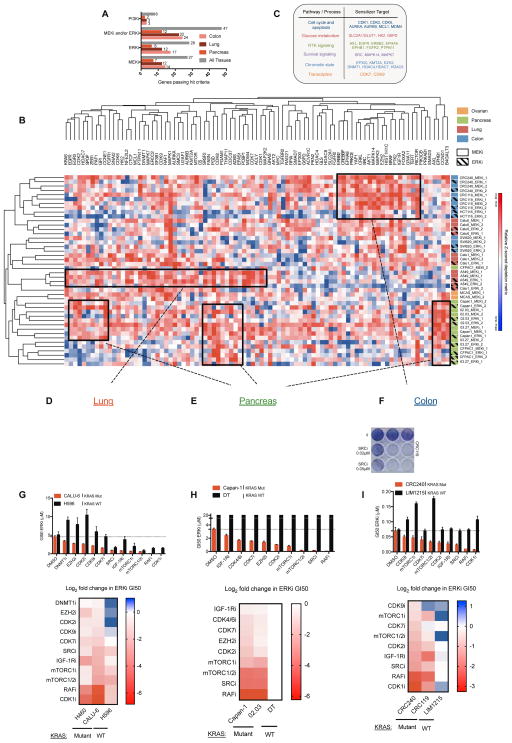
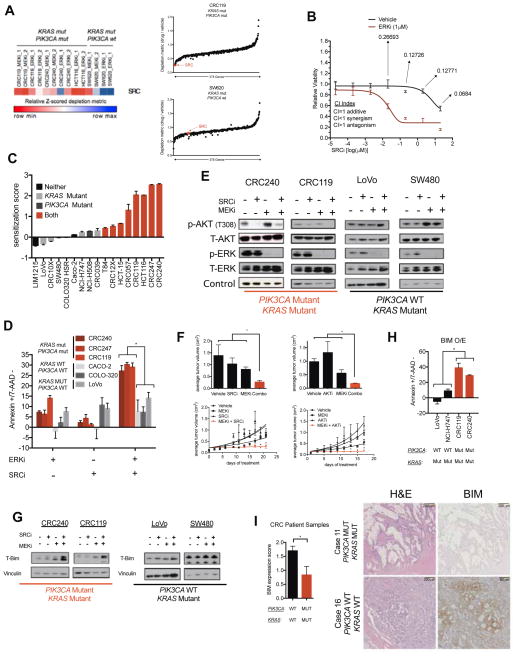
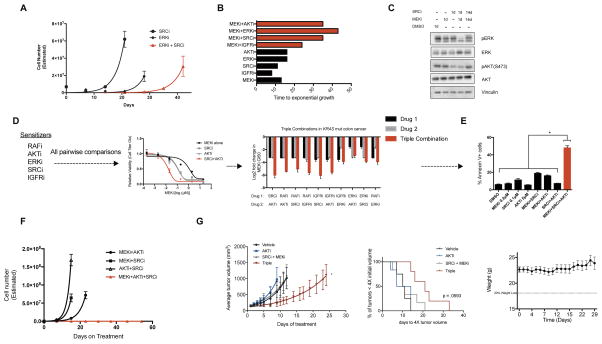
Combinatorial inhibition of effector and feedback pathways is a promising treatment strategy for KRAS mutant cancers. However, the particular pathways that should be targeted to optimize therapeutic responses are unclear. Using CRISPR/Cas9, we systematically mapped the pathways whose inhibition cooperates with drugs targeting the KRAS effectors MEK, ERK, and PI3K. By performing 70 screens in models of KRAS mutant colorectal, lung, ovarian, and pancreas cancers, we uncovered universal and tissue-specific sensitizing combinations involving inhibitors of cell cycle, metabolism, growth signaling, chromatin regulation, and transcription. Furthermore, these screens revealed secondary genetic modifiers of sensitivity, yielding a SRC inhibitor-based combination therapy for KRAS/PIK3CA double-mutant colorectal cancers (CRCs) with clinical potential. Surprisingly, acquired resistance to combinations of growth signaling pathway inhibitors develops rapidly following treatment, but by targeting signaling feedback or apoptotic priming, it is possible to construct three-drug combinations that greatly delay its emergence.

Keywords: BIM; CRISPR/Cas9; KRAS; PIK3CA; SRC; apoptosis; drug resistance; pooled screening; synthetic lethality.


Figures

Figure 1
Figure 1. Construction and validation of miniaturized CRISPR/Cas9 library for drug sensitizer screening
A) Breakdown of the 378 genes included (top) and schematic depicting the construction and implementation of the 1,940 sgRNA library (bottom). B) Replicate comparison of gene-level essentiality phenotypes in the colorectal cancer cell line HCT116 pilot screen. The mean depletion metric (DM; t = 4 weeks/t = initial) for all 5 constructs targeted to each gene in the library is plotted and fit to a linear model. Previously identified “core essential” genes (Hart et al., 2014) RPL5, SF3B1, PPP2R1A, SMC3, and U2AF1 are noted in blue as positive controls (top). Replicate comparison of sensitizer phenotypes from HCT116 pilot screen. Cells were cultured in the presence of 0.1 μM AZD6244 or vehicle for 4 weeks. The mean depletion metric (DM; t = 4 weeks, drug/vehicle) for all 5 constructs targeted to each gene in the library is plotted and fit to a linear model. Select sensitizers identified in previous studies (BRAF, IGF1R, AKT1, and MAPK1) are noted in blue as positive controls. C) Log2(DM) for each gene in a representative HCT116 MEKi sensitizer screen. The 50 control sgRNAs are randomly assigned to 10 control genes and are labeled in yellow. Hits in red are genes that scored reproducibly in the bottom 10% of genes in the library for both replicates (grey text, known sensitizer; red text, previously unknown sensitizer) Inset: Pharmacologic validation of sensitizers to the MEKi AZD6244 in HCT116 cells identified by the pilot screen (ERKi, SCH772984 0.02μM; IGFRi, GSK1838705A 1μM; PKCi LY317615 2μM; AKTi MK2206 10μM; RAFi LY3009120, 0.1μM, right). Data are GI50 values (mean ± SD of three replicates) in the presence of DMSO or the indicated sensitizer drugs. D) Replicate comparison of the DM (most active 3 sgRNAs per gene) for hits in the pilot screen (known sensitizers, blue; previously unknown sensitizers, orange). E) Replicate comparison of screens performed in two primary patient-derived CRC cell lines across the three inhibitors tested (SCH772984, ERKi; GDC-0623, MEKi; BKM-120, PI3Ki). Data are the DM for the 3 most active sgRNAs per gene. F) Relationship of control guides to hits in replicate 1 across all CRC screens (DM is the average of the 3 most active sgRNAs). Boxplots for the mean DM score of each hit and control in every CRC cell line for each drug screen (bottom right). G) Screen results for ControlA1 (orange) and guides targeting CRKL (blue) are plotted and fit to a linear model (adj R2= 0.54; top). Cells expressing sgCRKL constructs were treated with the MEK inhibitor AZD6244 and normalized to cells expressing sgControl constructs. Data are fold change in GI50 values (mean ± SD of three replicates; bottom). *p<0.05 by Student’s t test. See also Figure S1 and Tables S1, S2, and S3.
Figure 2
Figure 2. Landscape view and validation of sensitizers to MEK/ERK inhibitors across KRAS mutant cancers
A) Comparison of hit frequency across tissues and drugs. A gene is considered a hit if it scores reproducibly in two cell lines per tissue. B) Hierarchical clustering of the Z-scored DM for the 3 most active sgRNAs per gene in each replicate for GDC-0623 (MEKi) and SCH772984 (ERKi) screens. For each condition, cells were grown either in vehicle or low doses of the indicated inhibitor (see Supplemental Table 3 for doses) for 3–4 weeks and then results were de-convoluted by deep sequencing (boxes highlight representative areas of heat, indicating groups of possible tissue-specific sensitizers). C) Table with representative processes and corresponding target genes that modulate sensitivity to MEK/ERK inhibition uncovered by the screens. D–F) Crystal violet staining of 7 day colony growth in cell lines treated with the indicated, candidate sensitizers. Cells were treated with the indicated inhibitors in combination with AZD6244 (MEKi) or ERKi (SCH772984) at the listed concentrations (ERK5i, XMD8-92; MDM2/4i, MI-773; EGFRi, Gefitinib; mTORC 1/2, Torin1; SRCi, dasatinib; CDK1i RO-3306). Data are a representative image of each experiment performed in duplicate. (G–I, top) Pharmacologic validation of 12 sensitizers. Mutant and wild type cells were tested in 8-point GI50 assays with either SCH772984 (ERKi) alone or in the presence of a constant background concentration of the indicated drugs. Relative viability was measured at 72 hours post-treatment using Cell Titer Glo. Dotted line indicates ERKi GI50 value for DMSO treated KRAS mutant cells. Data are mean ± SEM of three replicate experiments. (G–I, bottom) Similar to top, log2 transformed GI50 values for two KRAS mutant cell lines and one KRAS WT cell line per tissue. Data are normalized to DMSO treated samples for each cell line. (DNMT1i, Azacitadine 0.5μM; EZH2i UNC1999, 0.5μM; CDK2i Roscovitine, 5μM; CDK9i LDC000067, 2μM; CDK7i BS-181, 2μM; SRCi dasatinib, 0.2μM; IGFRi, GSK1838705A 1μM; mTORC1 Rapamycin, 0.1μM; mTORC 1/2, Torin1, 0.2μM; RAFi LY3009120, 1μM; CDK1i RO-336 5μM; CDK4/6i PD0332991, 2μM). *p<0.05. See also Figure S1, S2 and Tables S3, S4.
Figure 3
Figure 3. Co-inhibition of the MEK/ERK pathway plus SRC induces synergistic apoptosis in KRAS/PIK3CA double mutant colorectal cancers (CRCs) through induction of BIM
A) At right, relative depletion of SRC across CRC screens. At left, rank ordered relative depletion scores (threescore) plotted for all 378 genes in a KRAS/PIK3CA double mutant and a KRAS mutant/PIK3CA wild-type cell line. B) GI50 for a SRC inhibitor (dasatinib) in the presence of either vehicle or a constant background dose of ERK inhibitor (VX-11e) in CRC240 cells. CI values are calculated for each dose on the curve. C) SRC inhibitor (dasatinib) sensitization score across a panel of CRC cell lines with indicated alterations in KRAS and PIK3CA. Sensitization score is calculated as the log10 ratio of the GI50 values for SRCi (dasatinib) relative to the same quantity in the presence of a constant background dose of 1 μM ERKi (VX-11e). Additive effects center at zero, antagonistic effects are negative, and sensitization effects are positive. D) Apoptosis measurements, reported as the percentage of annexin v+/7-AAD- cells in six CRC cell lines representing various mutational backgrounds treated with vehicle, a SRC inhibitor (dasatinib, 200nM), an ERK inhibitor (VX-11e, 1μM), or the combination of both. E) Immunoblots of P-AKT, T-AKT, P-ERK, T-ERK, and a loading control in four CRC cell lines representing different mutational backgrounds treated with vehicle, a SRC inhibitor (dasatinib, 1μM), a MEK inhibitor (AZD6244, 0.5μM), or the combination of both for 6 hrs. Loading control for CRC240 and LoVo is Histone H3 and control for CRC240 and SW480 is vinculin. Blots are cropped for clarity. F) HCT116 xenografts treated with vehicle, SRCi (dasatinib 15 mg/kg, daily) or AKTi (MK2206 60 mg/kg, daily), MEKi (AZD6244 10 mg/kg, twice daily), or the combination of a MEKi with either SRCi or AKTi for 21 days, shown as tumor size at endpoint (top) or growth curve (bottom). G) Immunoblot of T-BIM and vinculin in four CRC cell lines representing different mutational backgrounds treated with vehicle, a SRC inhibitor (dasatinib, 1μM), a MEK inhibitor (AZD6244, 0.5μM), or the combination of both for 6 hrs. Blots are cropped for clarity. H) Apoptosis (annexin V+/7-AAD- percentage) following ectopic overexpression of BIM in the absence of drug in indicated CRC cell lines. I) Quantification by immunohistochemistry (IHC) for T-BIM in CRC patient samples stratified into WT/WT or KRAS/PIK3CA mutant groups. To the right are representative images of each case, also showing H&E staining. Error bars show data ± SEM. *p<0.05. See also Figure S3 and Table S5.
Figure 4
Figure 4. Leveraging the landscape of sensitizers to suppress resistance
A) Time to progression (TTP) assay in CRC240 cells treated with the ERKi (VX-11e, 1μM) + SRCi (dasatinib, 1μM) combination. Data are mean ± SEM of three replicates. B) TTP for several candidate CRC combinations tested in CRC119 cells. MEKi, AZD6244 1μM; IGFRi, GSK1838705A 1μM; SRCi, dasatinib 0.5μM; ERKi, SCH772984 0.1μM; AKTi, MK2206 5μM. C) Immunoblots of indicated targets in CRC119 cells treated with DMSO, MEKi (AZD6244, 1μM), SRCi (dasatinib, 0.5μM), or the combination for 14 days and probed at the indicated times. Blots are cropped for clarity. D) Pairwise combinations of sensitizers in CRC119 cells to identify triple combinations (left). Triple combinations (red) were tested for their ability to shift the GI50 curves to a greater extent than either of the two body combinations (grey; center). Log2 fold shifts from baseline are shown for all combinations tested, where negative values indicate leftward shift of the curve as in the center plot. Data are mean ± SD of three replicate experiments. Drug identities as above except: RAFi, LY3009120 0.05μM; ERKi 0.05μM; SRCi 1μM. E) CRC119 annexin V+ cells after 48 hours of treatment with the indicated combinations (MEKi, SRCi, and AKTi identity same as above). F) TTP assay for a candidate triple combination (MEKi AZD6244, 0.2μM; SRCi dasatinib, 1μM; AKT MK2206, 10μM). G) HCT116 xenograft treated with vehicle, MK-2206 (15 mg/kg, daily), dasatinib (15 mg/kg, daily) and AZD6244 (15 mg/kg, daily), or the triple combination. For average tumor volumes, each arm only plots the data up to the point at which the first mouse in the group reached the humane endpoint. To the right, a survival curve showing percent of mice with tumors less than 4X the starting volume at a given time. To the right of survival curve are the mouse weights for the triple combination group over the course of the study. Data are mean ± SEM. *p>0.05. See also Figure S4.
Figure 5
Figure 5. Leveraging the priming ability of two-body combinations to design triple combination therapies involving cytotoxic chemotherapies
A) BH3 profiling in the KRAS mutant CRC cell line HCT116 treated with the indicated combinations (MEKi AZD6244, 1μM; RAFi LY3009120, 0.5μM; IGFRi GSK1838705A, 3μM; SRCi dasatinib, 0.5μM; ERKi SCH772984, 0.25μM; AKTi MK2206, 5μM). B) Immunoblot of indicated proteins in CRC119 CRC cell line treated with the indicated combinations (Drug identities same as above with following doses: MEKi 1μM; RAFi 0.2μM; IGFRi 1μM; SRCi 0.5μM; ERKi 0.1; AKTi 5μM). Blots are cropped for clarity. C) Log2 transformed GI50 values for three separate cytotoxic chemotherapeutic drugs treated with either vehicle or a constant background dose of an ERKi (VX-11e), a SRCi (dasatinib), or the combination of both. D) Apoptosis measurements reported as percent annexin V+ cells treated with the indicated drugs for 48hrs in CRC240 cells. SRCi (dasatinib 100nM), ERKi (VX-11e 500nM), 5-FU (5μM), irinotecan (5μM), oxaliplatin (5μM). E) TTP in CRC119 cells treated with the indicated drugs. SRCi (dasatinib), MEKi (AZD6244). F) HCT116 xenograft treated with vehicle, Oxaliplatin (7.5 mg/kg once every 4 days), dasatinib (15 mg/kg, daily) and AZD6244 (10 mg/kg, twice daily), or the triple combination. To the right, a survival curve showing percent of mice with tumors less than 4X the starting volume at a given time. To the right of survival curves, mouse weights for the triple combination group over the course of the study. Error bars show data ± SEM. *p<0.05. See also Figure S5.
Figure 6
Figure 6. Targeting the unmasked BCL-XL dependency to design triple combination therapies
A) BH3 profiling in KRAS mutant CRC (HCT116) and lung cancer (Calu6) cell lines treated with indicated combinations (Drug doses and identities are the same as in Figure 5A with the addition of ERK5i XMD8-92, 5μM). B) Log2 transformed GI50 values for MEKi (AZD6244) in the presence of background treatment containing one of the sensitizers indicated (RAFi LY3009120 0.1μM; AKTi MK2206, 5μM; ERKi SCH772984, 0.05μM; SRCi dasatinib, 0.5μM; or IGFRi GSK1838705A, 1μM) and either a BCL-XL inhibitor (WEHI-539, 1μM) or a BCL2 inhibitor (ABT-199, 1μM) in two CRC cell lines. C) Apoptosis measurements reported as percent annexin V+ in CRC119 cells treated with the indicated combinations. Each graph represents a different sensitizer in combination with a BCL-XL inhibitor and a MEK inhibitor (Drug identities same as in B). D) TTP assay in CRC240 cells treated with the indicated combinations (BCL-XLi WEHI-539, 1μM; SRCi dasatinib, 1μM; ERKi VX-11e, 1μM). E) HCT116 xenograft treated with the indicated drugs. ABT-737 (BCL-2/BCL-XLi, 25 mg/kg, daily), Dasatinib (SRCi, 15 mg/kg, daily), AZD6244 (MEKi, 10 mg/kg, twice daily). To the right, a survival curve showing percent of mice with tumors less than 4X the starting volume at a given time. To the right of survival curves, mouse weights for the triple combination group over the course of the study. F) Immunoblot of total BIM in CRC240 cells treated with an ERKi (VX-11e, 1μM) and a SRCi (dasatinib, 1μM) for 24hrs. Drugs were removed, then lysates were probed at the indicated time points. Blots are cropped for clarity. G) GI60 value for a BCL-XL inhibitor (WEHI-539) in CRC240 cells. Each of the bars on the graph represents the time at which the BCL-XL inhibitor was added to the cells after background dose of ERKi+SRCi (drug identities as above) was removed. The DMSO bar is the average of the DMSO values for each of the time points (0h, 6h, 12h, 24h, 48h, 72h). H) Apoptosis measurements are reported as percent annexin V+ cells in CRC240 cells treated with each of the indicated drugs for each of the indicated times. BCL-XLi (WEHI-539, 1μM), ERKi (VX-11e, 500nM), SRCi (dasatinib, 100nM). Error bars show data ± SEM. *p<0.05. See also Figure S6.

References

    1. Ahronian LG, Sennott EM, Van Allen EM, Wagle N, Kwak EL, Faris JE, Godfrey JT, Nishimura K, Lynch KD, Mermel CH, et al. Clinical Acquired Resistance to RAF Inhibitor Combinations in BRAF-Mutant Colorectal Cancer through MAPK Pathway Alterations. Cancer Discovery. 2015;5:358–367. - PMC - PubMed
    1. Al-Lazikani B, Banerji U, Workman P. Combinatorial drug therapy for cancer in the post-genomic era. Nat Biotechnol. 2012;30:679–692. - PubMed
    1. Athuluri-Divakar SK, Carpio RVD, Dutta K, Baker SJ, Cosenza SC, Basu I, Gupta YK, Reddy MVR, Ueno L, Hart JR, et al. A Small Molecule RAS-Mimetic Disrupts RAS Association with Effector Proteins to Block Signaling. Cell. 2016;165:643–655. - PMC - PubMed
    1. Barrangou R, Doudna JA. Applications of CRISPR technologies in research and beyond. Nat Biotechnol. 2016:933–941. - PubMed
    1. Berg M, Danielsen SA, Ahlquist T, Merok MA, Ågesen TH, Vatn MH, Mala T, Sjo OH, Bakka A, Moberg I, et al. DNA Sequence Profiles of the Colorectal Cancer Critical Gene Set KRAS-BRAF-PIK3CA-PTEN-TP53 Related to Age at Disease Onset. PLoS ONE. 2010;5:e13978. - PMC - PubMed

Publication types

MeSH terms

Substances