

Obesity in Scotland: a persistent inequality
- PMID: 28747194
- PMCID: PMC5530512
- DOI: 10.1186/s12939-017-0599-6
Obesity in Scotland: a persistent inequality
Abstract
Background: Obesity is a health problem in its own right and a risk factor for other conditions such as cardiovascular disease. The prevalence of overweight and obesity increased in Scotland between 1995 and 2008 with socio-economic inequalities persisting in adults over time and increasing in children. This paper explores changes in the underlying distribution of body mass index (BMI) which is less well understood.
Methods: Using data from the Scottish Health Survey (SHeS) between 1995 and 2014 for adults aged 18-64 years, we calculated population distributions for BMI for the population overall, and for age, sex and deprivation strata. We used SHeS data for children aged 2-15 years between 1998 and 2014, in addition to data from the Child Health Systems Programme (CHSP) collected from primary one (P1) children in participating local authorities, to describe the overall trends and to compare trends in inequalities by deprivation strata.
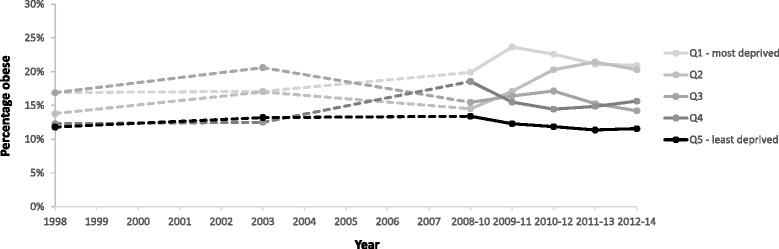
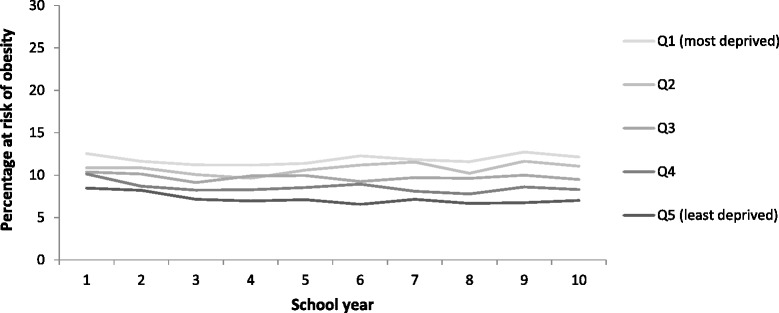
Results: Amongst adults, the BMI distribution shifted upwards, with a large proportion of the population gaining a small amount of weight between 1995 and 2008 before subsequently stabilising across the distribution. In men the prevalence of obesity showed a linear deprivation gradient in 1995 but over time obesity declined in the least deprived quintile while the remaining four quintiles converged (and stabilised). In contrast, a persistent and generally linear gradient is evident among women for most of the 1995-2014 period. For those aged 2-15 years, obesity increased between 1998 and 2014 for the most deprived 40% of children contrasted with stable trends for the least deprived. The surveillance data for P1 children in Scotland showed a persistent inequality between 2005/06 and 2014/15 though it was less clear if this is widening.
Conclusions: The BMI distribution for adults increased between 1995 and 2008 with a large proportion of the population gaining a small amount of weight before stabilising across the distribution. Inequalities in obesity persist for adults (with different underlying patterns evident for men and women), and may be widening for children. Actions to reduce the obesogenic environment, including structural changes not dependent on individual agency, are urgently needed if the long-term health, social and inequality consequences of obesity are to be reduced.
Keywords: Adults; BMI; Children; Inequality; Obesity; Overweight; Scotland; Scottish Health Survey; Trends; Weight.
Figures


References
-
- Butland B, Jebb S, Kopelman P, McPherson K, Thomas S, Mardell J, Parry V. Foresight. Tackling obesities: future choices. project report. London: Government Office for Science; 2007. - PubMed
-
- Finucane M, Stevens G, Cowan M, Danaei G, Lin J, Paciorek C, Singh G, Gutierrez H, Lu Y, Bahalim A, Farzadfar F, Riley L, Ezzati M, Global Burden of Metabolic Risk Factors of Chronic Diseases Collaborating Group (Body Mass Index) National, regional, and global trends in body-mass index since 1980: systematic analysis of health examination surveys and epidemiological studies with 960 country-years and 9 · 1 million participants. Lancet. 2011;377(9765):557–567. doi: 10.1016/S0140-6736(10)62037-5. - DOI - PMC - PubMed
MeSH terms
LinkOut - more resources
Full Text Sources
Other Literature Sources
Medical
