. 2017 Nov:84:75-86.
doi: 10.1016/j.jaut.2017.07.009. Epub 2017 Jul 23.

Cells with Treg-specific FOXP3 demethylation but low CD25 are prevalent in autoimmunity

Affiliations

Cells with Treg-specific FOXP3 demethylation but low CD25 are prevalent in autoimmunity

Ricardo C Ferreira et al. J Autoimmun. 2017 Nov.

Abstract

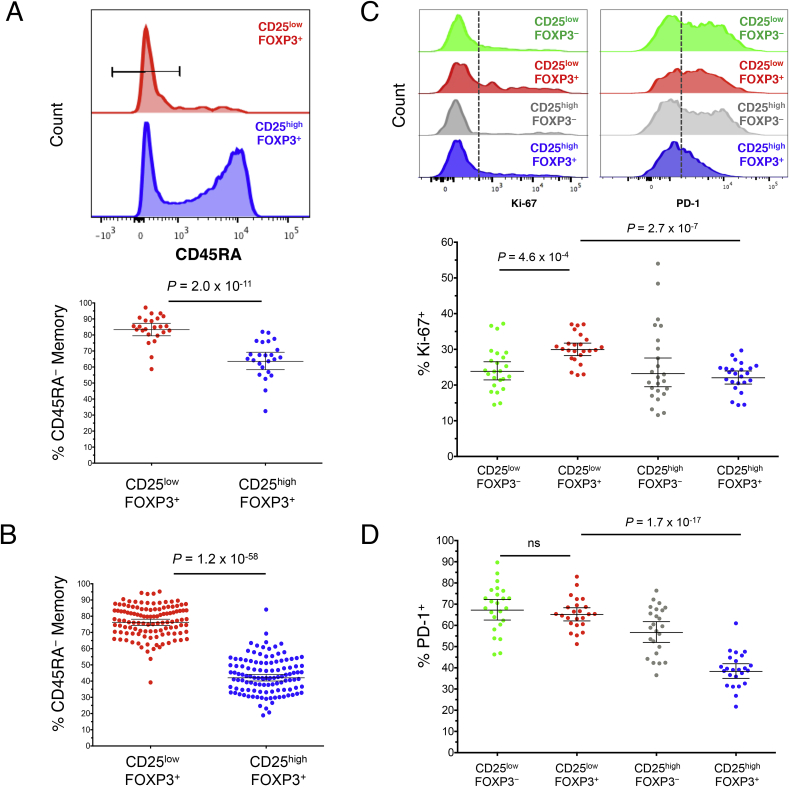
Identification of alterations in the cellular composition of the human immune system is key to understanding the autoimmune process. Recently, a subset of FOXP3+ cells with low CD25 expression was found to be increased in peripheral blood from systemic lupus erythematosus (SLE) patients, although its functional significance remains controversial. Here we find in comparisons with healthy donors that the frequency of FOXP3+ cells within CD127lowCD25low CD4+ T cells (here defined as CD25lowFOXP3+ T cells) is increased in patients affected by autoimmune disease of varying severity, from combined immunodeficiency with active autoimmunity, SLE to type 1 diabetes. We show that CD25lowFOXP3+ T cells share phenotypic features resembling conventional CD127lowCD25highFOXP3+ Tregs, including demethylation of the Treg-specific epigenetic control region in FOXP3, HELIOS expression, and lack of IL-2 production. As compared to conventional Tregs, more CD25lowFOXP3+HELIOS+ T cells are in cell cycle (33.0% vs 20.7% Ki-67+; P = 1.3 × 10⁻⁹) and express the late-stage inhibitory receptor PD-1 (67.2% vs 35.5%; P = 4.0 × 10⁻¹⁸), while having reduced expression of the early-stage inhibitory receptor CTLA-4, as well as other Treg markers, such as FOXP3 and CD15s. The number of CD25lowFOXP3+ T cells is correlated (P = 3.1 × 10⁻⁷) with the proportion of CD25highFOXP3+ T cells in cell cycle (Ki-67+). These findings suggest that CD25lowFOXP3+ T cells represent a subset of Tregs that are derived from CD25highFOXP3+ T cells, and are a peripheral marker of recent Treg expansion in response to an autoimmune reaction in tissues.

Keywords: Autoimmunity; CD25; FOXP3; Regulatory T cells (Tregs); Treg-specific demethylated region (TSDR).


Figures

Fig. 1
Fig. 1
Frequency of CD25lowFOXP3+cells is increased in patients with autoimmune disease. (A) Patterns of CD25 and FOXP3 expression among CD127low CD4+ T cells from healthy donors and patients with autoimmune manifestations. (B) Gating strategy for the delineation of the T-cell subsets characterised in this study. Distribution of FOXP3+ cells among: (i) CD127lowCD25high conventional Tregs (depicted in blue); and (ii) CD127lowCD25low T cells (depicted in red). The vertical dotted line represents the threshold for the gating of FOXP3+ cells (histograms). (C, D) Scatter plots depict the frequency (geometric mean ± 95% CI) of FOXP3+ cells among CD127lowCD25low T cells in SLE patients (N = 34 patients vs 24 healthy donors) and combined immunodeficiency patients with active autoimmunity (N = 7 patients vs 6 healthy donors) (C); or in a cohort of T1D patients (N = 62; depicted by red circles) and healthy donors (N = 54; depicted by black squares) (D). P values were calculated using two-tailed unpaired t-tests. P values < 0.0167 were considered significant (Bonferronni correction for the comparison in three different diseases). The initial CD4+ T cell gate (CD4 versus dead cell exclusion dye) was derived from a lymphocyte gate (defined on forward and side scatter) followed by single-cell discrimination. HC, healthy controls; T1D, type 1 diabetes patients; SLE, systemic lupus erythematosus patients; CID, combined immunodeficiency patients.
Fig. 2
Fig. 2
CD25lowFOXP3+cells are demethylated at the FOXP3 Treg-specific demethylated region (TSDR). (A) Gating strategy for FACS sorting of four CD4+ T-cell subsets: (i) CD127lowCD25lowFOXP3 (depicted in green), (ii) CD127lowCD25lowFOXP3+ (depicted in red), (iii) CD127lowCD25highFOXP3 (depicted in grey), and (iv) CD127lowCD25highFOXP3+ (depicted in blue). (B) Frequency (mean ± SEM) of reads demethylated at eight or nine of the nine interrogated CpG sites in the FOXP3 TSDR. The data were obtained from sorted cells from four independent healthy donors. (C) Graphic depicts the proportion of demethylated reads at the nine interrogated CpG sites from the FOXP3 TSDR in one illustrative donor. Each horizontal line represents one sequencing read, with light green representing a methylated read (C) and dark green representing a demethylated read (T). Note that the plot is representative of a male donor. For female donors, X-chromosome inactivation causes half of the reads to be methylated and a correction factor of two was applied to obtain the frequency of demethylated reads.
Fig. 3
Fig. 3
CD25lowFOXP3+T cells display a memory phenotype. (A, B) Representative histograms and summary scatter plots depict the frequency (geometric mean ± 95% CI) of CD45RA memory T cells amongst the CD25lowFOXP3- and CD25lowFOXP3+ subsets in a population of 24 adult (median age = 42 years) healthy donors (A) or in a population of 116 younger (median age = 14 years) T1D patients (N = 62) and healthy donors (N = 54) (B). (C, D) Representative histograms and the frequency distribution (geometric mean ± 95% CI) of Ki-67+ (C) and PD-1+ (D) cells in the CD45RA compartment of the four assessed immune subsets. P values were calculated using two-tailed paired t-tests comparing the frequency of the assessed immune subsets from the same individual. P values < 0.005 were considered significant (Bonferronni correction for the comparison of ten independent immune markers between CD25lowFOXP3+ and CD25highFOXP3+ T cells). Gating strategy to delineate: (i) CD127lowCD25lowFOXP3 (highlighted in green), (ii) CD127lowCD25lowFOXP3+ (highlighted in red), (iii) CD127lowCD25highFOXP3 (highlighted in grey), and (iv) CD127lowCD25highFOXP3+ (highlighted in blue) CD4+ T cells is depicted in Fig. 2A.
Fig. 4
Fig. 4
CD25lowFOXP3+cells show reduced expression of several conventional Treg markers. (A) Representative histograms depict the distribution of the expression of the conventional Treg markers HELIOS, TIGIT, CD15s and CTLA-4 amongst: (i) CD127lowCD25lowFOXP3 (highlighted in green), (ii) CD127lowCD25lowFOXP3+ (highlighted in red), (iii) CD127lowCD25highFOXP3- (highlighted in grey), and (iv) CD127lowCD25highFOXP3+ (highlighted in blue) memory CD4+ T cells. (B) Scatter plots depict the distribution (geometric mean ± 95% CI) of HELIOS (n = 24), TIGIT (n = 24), CD15s (n = 24) and CTLA-4 (n = 13) in the CD45RA compartment of the four assessed immune subsets. (C) Expression of FOXP3 (geometric mean ± 95% CI) was measured in the CD25lowFOXP3+ (depicted by red squares) and CD25highFOXP3+ (depicted by blue circles) subsets from 24 healthy donors. P values were calculated using two-tailed paired t-tests comparing the assessed immunophenotypes between CD25lowFOXP3+ and the other three delineated subsets from the same individual. P values < 0.005 were considered significant (Bonferronni correction for the comparison of ten independent immune markers between CD25lowFOXP3+ and CD25highFOXP3+ T cells). MFI, mean fluorescence intensity.
Fig. 5
Fig. 5
HELIOS+CD45RACD25lowFOXP3+cells are demethylated at TSDR as much as conventional HELIOS+CD45RACD25highFOXP3+Tregs. Frequency (mean ± SEM) of reads demethylated at eight or nine of the nine interrogated CpG sites in the FOXP3 TSDR in CD45RA CD25lowFOXP3+ cells and CD45RA CD25highFOXP3+ Tregs stratified by the expression of HELIOS. The data were obtained from sorted cells from three independent healthy donors.
Fig. 6
Fig. 6
HELIOS+CD45RACD25lowFOXP3+cells show impaired production of IL-2 and IFN-γ. (A) Gating strategy to delineate the CD45RAHELIOS+ subset of: (i) CD127lowCD25lowFOXP3+ (highlighted in red), (ii) CD127lowCD25highFOXP3+ (highlighted in blue), and (iii) CD127+CD25low/+FOXP3 HELIOS conventional (Conv) effector (highlighted in black) subsets of CD4+ T cells. (B, C) Bar graphs depict the frequency (mean ± 95% CI) of IL-2+ and IFN-γ+ cells in the CD45RAHELIOS+ compartment (or the CD45RAHELIOS compartment in the case of the conventional effector T cells) of the five assessed immune subsets depicted in panel A. Cytokine production was assessed in one single batch of ten donors. P values were calculated using two-tailed paired t-tests. P values < 0.005 were considered significant (Bonferronni correction for the comparison of ten independent immune markers between CD25lowFOXP3+ and CD25highFOXP3+ T cells). FACS gating plots depict data from one illustrative donor. *P < 0.05; **P < 0.01; ***P < 0.001.
Fig. 7
Fig. 7
Proliferating Ki-67+CD25highFOXP3+HELIOS+Tregs correlate with the frequencies of the CD25lowand CD25highCD127lowFOXP3+HELIOS+subsets. (A, B) Data shown depict the correlation between the frequency within CD45RA CD4+ T cells of in-cycle (Ki-67+) CD4+CD45RA CD127lowCD25high Tregs (FOXP3+HELIOS+) and the frequency of either CD25low FOXP3+HELIOS+ T cells (A) or conventional CD25high FOXP3+HELIOS+ Tregs (B). (C) Data shown depict the correlation between the frequencies of circulating CD4+CD45RA CD25low FOXP3+HELIOS+ and CD25high FOXP3+HELIOS+ T cells. Frequencies of the assessed immune subsets were measured in PBMCs from healthy volunteers from two independent cohorts: cohort 1 containing 24 donors (depicted in red) and cohort 2 containing 112 donors (depicted in black). The r2 values represent the coefficient of determination of the linear regression in the combined cohorts, and the P values correspond to the F statistic testing the null hypothesis that the slope of the linear regression analysis is equal to 0.

References

    1. Ohkura N., Hamaguchi M., Morikawa H., Sugimura K., Tanaka A., Ito Y., Osaki M., Tanaka Y., Yamashita R., Nakano N., Huehn J., Fehling H.J., Sparwasser T., Nakai K., Sakaguchi S. T cell receptor stimulation-induced epigenetic changes and Foxp3 expression are independent and complementary events required for Treg cell development. Immunity. 2012;37:785–799. - PubMed
    1. Miyara M., Yoshioka Y., Kitoh A., Shima T., Wing K., Niwa A., Parizot C., Taflin C., Heike T., Valeyre D., Mathian A., Nakahata T., Yamaguchi T., Nomura T., Ono M., Amoura Z., Gorochov G., Sakaguchi S. Functional delineation and differentiation dynamics of human CD4+ T cells expressing the FoxP3 transcription factor. Immunity. 2009;30:899–911. - PubMed
    1. Bin Dhuban K., D'Hennezel E., Nashi E., Bar-Or A., Rieder S., Shevach E.M., Nagata S., Piccirillo C.A. Coexpression of TIGIT and FCRL3 identifies Helios+ human memory regulatory T cells. J. Immunol. 2015;194:3687–3696. - PMC - PubMed
    1. Fuhrman C.A., Yeh W.-I., Seay H.R., Saikumar Lakshmi P., Chopra G., Zhang L., Perry D.J., McClymont S.A., Yadav M., Lopez M.-C., V Baker H., Zhang Y., Li Y., Whitley M., von Schack D., Atkinson M.A., Bluestone J.A., Brusko T.M. Divergent phenotypes of human regulatory T cells expressing the receptors TIGIT and CD226. J. Immunol. 2015;195:145–155. - PMC - PubMed
    1. Zhang B., Zhang X., Tang F.L., Zhu L.P., Liu Y., Lipsky P.E. Clinical significance of increased CD4+CD25−Foxp3+ T cells in patients with new-onset systemic lupus erythematosus. Ann. Rheum. Dis. 2008;67:1037–1040. - PubMed

MeSH terms

Substances