. 2017 Sep 4;214(9):2547-2562.
doi: 10.1084/jem.20161810. Epub 2017 Jul 26.

A biallelic mutation in IL6ST encoding the GP130 co-receptor causes immunodeficiency and craniosynostosis

Affiliations

A biallelic mutation in IL6ST encoding the GP130 co-receptor causes immunodeficiency and craniosynostosis

Tobias Schwerd et al. J Exp Med. .

Abstract

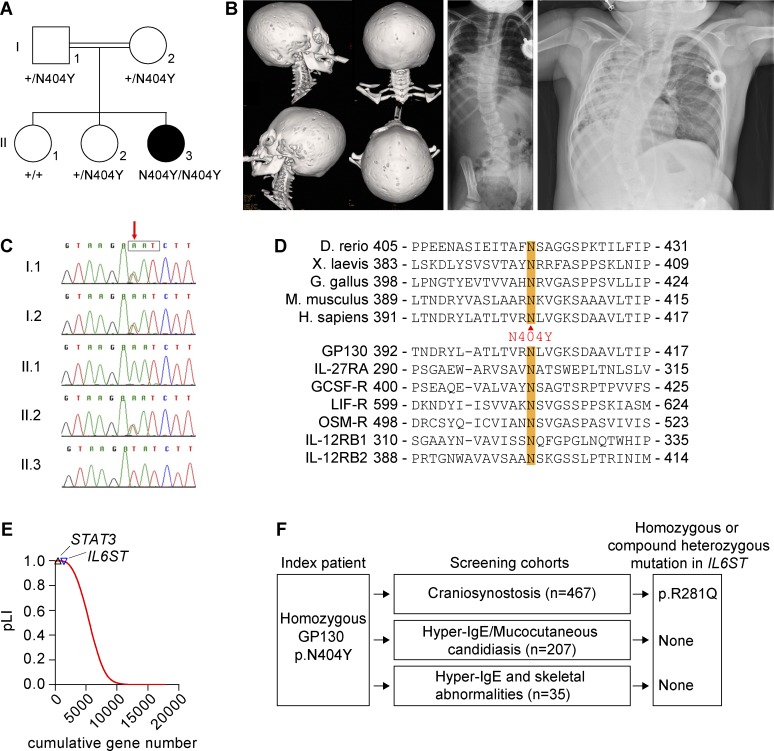
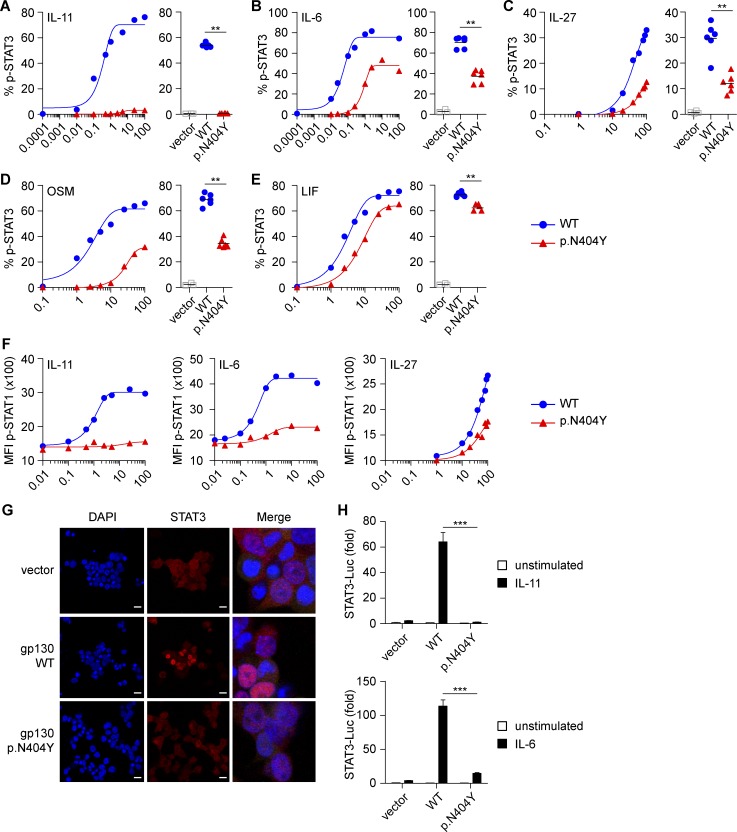
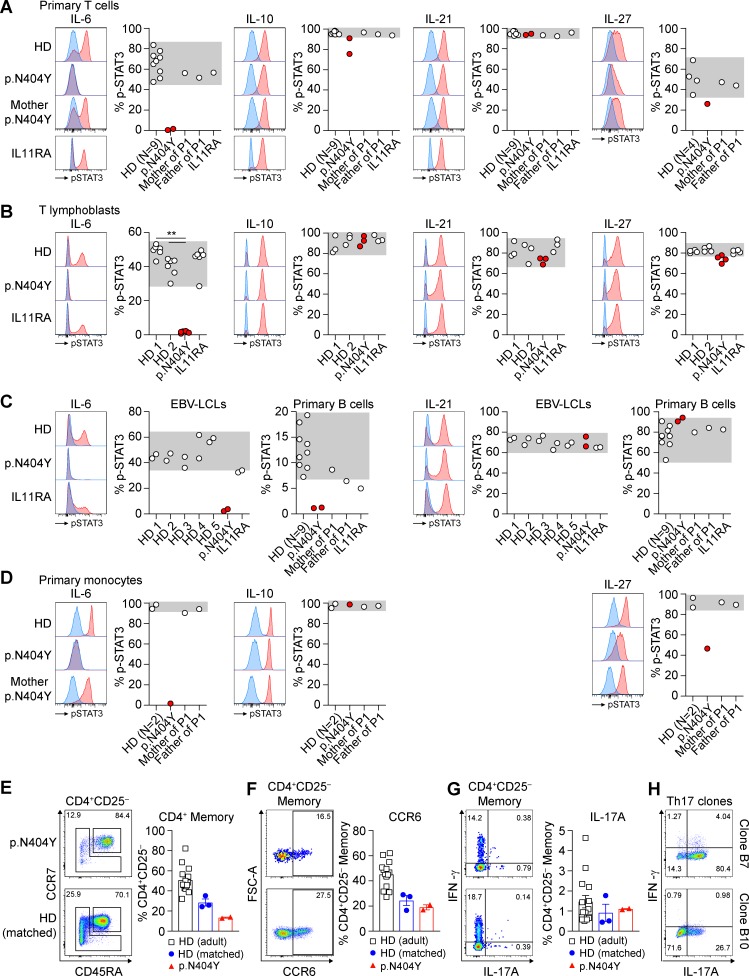
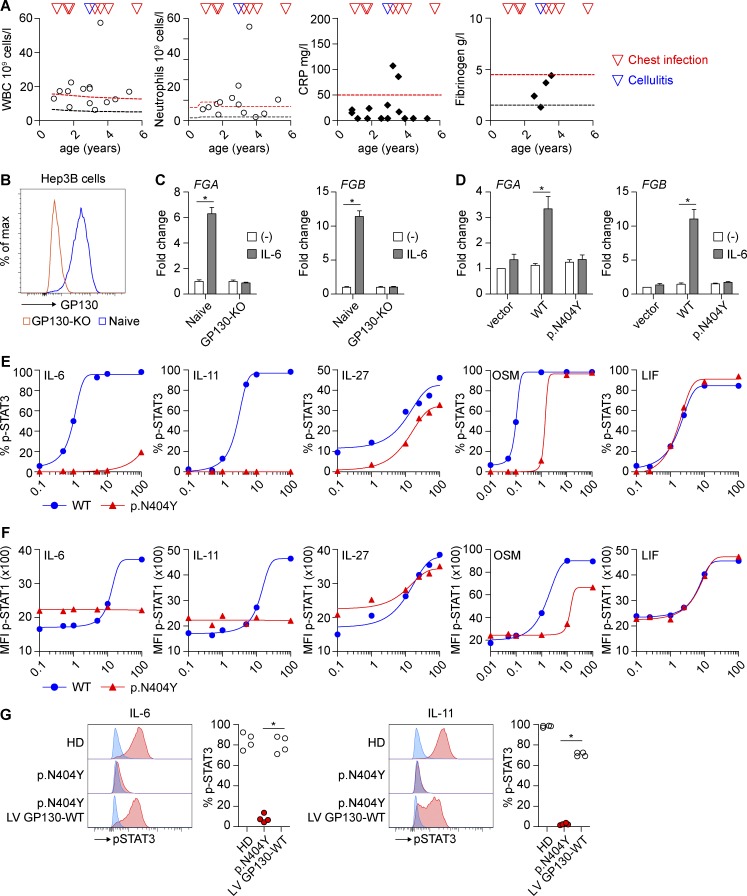
Multiple cytokines, including interleukin 6 (IL-6), IL-11, IL-27, oncostatin M (OSM), and leukemia inhibitory factor (LIF), signal via the common GP130 cytokine receptor subunit. In this study, we describe a patient with a homozygous mutation of IL6ST (encoding GP130 p.N404Y) who presented with recurrent infections, eczema, bronchiectasis, high IgE, eosinophilia, defective B cell memory, and an impaired acute-phase response, as well as skeletal abnormalities including craniosynostosis. The p.N404Y missense substitution is associated with loss of IL-6, IL-11, IL-27, and OSM signaling but a largely intact LIF response. This study identifies a novel immunodeficiency with phenotypic similarities to STAT3 hyper-IgE syndrome caused by loss of function of GP130.


Figures

Figure 1.
Figure 1.
Genetic analysis of IL6ST. (A) P1 showing pedigree and segregation of IL6ST alleles. Roman numerals (I or II) indicate generations, and Arabic numerals designate individuals (1, 2, or 3). Closed symbols identify the affected individual P1. (B, left) 3D computed tomographic reconstruction of skull of P1 showing pansutural synostosis. (Middle) Posteroanterior radiograph at age 2.8 yr demonstrating scoliosis. (Right) Chest radiograph at age 3.9 yr showing pneumonia, bronchiectasis, and scoliosis. (C) Dideoxy sequencing of P1 family, showing segregation of the c.1210A>T variant (red arrow). The box encloses the asparagine codon. (D) Alignment of GP130 protein sequence showing conservation of amino acid p.N404 among species (top) and across the class of tall cytokine receptors (bottom). Substitution to tyrosine (Y) is shown between the panels. (E) pLI of 17,739 human genes based on ExAC data. IL6ST and STAT3 genes are highlighted indicating their strong intolerance to loss-of-function variation. (F) Screening strategy within cohorts of patients with craniosynostosis and/or immunodeficiency (HIES and mucocutaneous candidiasis). A homozygous c.842G>A; p.R281Q substitution identified in the craniosynostosis cohort was classified as a variant of unknown significance and is not further discussed.
Figure 2.
Figure 2.
The GP130 p.N404Y substitution causes defective signaling by IL-11, IL-6, IL-27, OSM, and LIF. (A–E) HEK293 GP130-KO cells were transfected with empty vector control or plasmids encoding GP130 WT or the patient variant p.N404Y. Cells were stimulated with the indicated concentrations (ng/ml) of IL-11 (A), IL-6 (B), IL-27 (C), OSM (D), or LIF (E) for 15 min and analyzed for STAT3 phosphorylation (p-STAT3) by Phosflow. For assessment of IL-11 and IL-6 signaling, cells were cotransfected with plasmids encoding IL-11RA and IL-6RA, respectively. Co-transfection with GFP allowed gating on successfully transfected cells. Representative titration curves (on the left in each panel) are shown for each ligand and are representative of two independent experiments. Curve fitting is by nonlinear regression. Quantification (on the right in each panel) is based on four to six independent experiments per cytokine at one concentration (IL-11, 1 ng/ml; IL-6, IL-27, OSM, and LIF, all 100 ng/ml). (F) Experiments with HEK293 GP130-KO cells performed as in A–C. Cells were assayed for phospho-STAT1 (p-STAT1). Titration curves are representative of two independent experiments. MFI, mean fluorescence intensity. (G) Immunofluorescence staining of HEK293 GP130-KO cells, plated in chamber slides and transfected as in A. Cells were analyzed for STAT3 nuclear translocation using confocal microscopy. Bars, 50 µm. Images on the right are merged and magnified. Images are representative for three independent experiments. (H) HEK293 cells were cotransfected with luciferase (Luc) reporters, GP130 variants, and IL-11RA or IL-6RA expression vectors, respectively. After 24 h, cells were stimulated with 1 ng/ml IL-11 (top) or 0.5 ng/ml IL-6 (bottom) for 6 h, and induction of STAT3 reporter (relative to constitutively expressed Renilla luciferase) was determined. Results are expressed as fold-induction compared with unstimulated vector control and are pooled data from three independent experiments with three to six technical replicates each. Data represent mean with SEM. Differences were investigated by Mann-Whitney U test. **, P < 0.01; ***, P < 0.001.
Figure 3.
Figure 3.
The GP130 p.N404Y substitution abrogates IL-6 signaling in primary T cells, B cells, and monocytes. (A–D) Primary immune cells were stimulated for 15 min with 100 ng/ml IL-6, 50 ng/ml IL-10, 100 ng/ml IL-21, or 100 ng/ml IL-27, and STAT3 phosphorylation (p-STAT3) was analyzed using intracellular staining and flow cytometry. Representative histograms are shown (blue, unstimulated; red, cytokine stimulated). Results show percent phospho-STAT3+ cells based on the unstimulated condition. Gray areas indicate range found in healthy individuals. (A) Levels of STAT3 phosphorylation were assessed in T cells (CD3+/CD19 lymphocyte gate) in a whole-blood assay. Analysis was performed on nine healthy donors (HD), patient P1 (p.N404Y), the parents of P1, and a patient with a homozygous IL-11RA substitution (p.D297Y). Blood samples of P1 were independently analyzed on two occasions, separated by 13 mo. (B) Comparison of phospho-STAT3 levels in T lymphoblasts of two healthy donors (age matched to P1), P1, and the IL-11RA patient, which were generated from frozen PBMCs by PHA/IL-2 expansion. Data are a pooled summary result from three independent experiments with one, two, and four replicates each. Differences were investigated by Mann-Whitney U test. **, P < 0.01. (C) Assessment of LCLs generated from five healthy donors, P1, and the IL-11RA patient. Experiments with LCLs were performed twice, independently. Analysis of primary B cells was performed in the whole-blood assay described in A. (D) STAT3 phosphorylation in primary monocytes based on the whole-blood assay described in A. (E–G) Freshly isolated PBMCs were surface stained using fluorophore-conjugated antibodies and analyzed by flow cytometry. HD (adult), n = 15; HD (age matched), n = 3; P1 (p.N404Y), mean of two technical replicates of two independent measurements. Representative dot blots of P1 (p.N404Y; top) and the age-matched healthy donor (bottom) are shown. Bar graphs summarize measurements from several individuals. (E) CD45RA and CCR7 surface expression in CD3+CD4+CD8CD25 T cells showing the percentage of naive (CD45RA+CCR7+) and memory (CD45RACCR7+/− central memory/effector memory including CD45RA+CCR7 TEMRA) cells. (F) Dot plot presentation and bar graph showing the expression of CCR6 in CD4+CD25 memory T cells as assessed by surface staining. FSC, forward scatter. (G) Intracellular cytokine staining for IFN-γ and IL-17A after PMA/ionomycin stimulation of freshly isolated PBMCs showing frequencies of CD4+CD25 memory T cells. (H) Dot plot presentation showing intracellular IFN-γ and IL-17A after PMA/ionomycin stimulation of two IL-17A–producing single-cell Th cell clones prepared from the Th17 cell–enriched memory compartment, analyzed 28 d after isolation and single-cell cloning. Error bars represent mean ± SEM.
Figure 4.
Figure 4.
The GP130 p.N404Y variant causes a defective acute phase response, and P1 primary fibroblasts can be rescued by lentiviral transduction of WT GP130. (A) Cellular and biochemical response to recurrent chest infections and cellulitis in patient GP130 p.N404Y. White blood cell count (WBC), neutrophils, CRP, and fibrinogen measurements are shown at different time points. Black/red lines indicate 3rd/97th percentile or lower/upper limit of the normal range, respectively. (B) CRISPR/Cas9-mediated KO of GP130 in human hepatoma Hep3B cells results in absent GP130 surface expression. (C) IL-6–mediated production of fibrinogen is GP130 dependent. Hep3B GP130-KO cells were stimulated with IL-6 for 24 h, and expression of the fibrinogen α chain (FGA; left) and fibrinogen β chain (FGB; right) was determined by quantitative PCR. Gene expression was determined relative to the housekeeping gene RPLP0 and expressed as fold-induction compared with unstimulated cells. Data represent summary results from four independent experiments (mean ± SEM). (D) Hep3B GP130-KO cells were transiently transfected with GP130 WT, GP130 p.N404Y-mutant plasmid, and FGA (left) and FGB (right) gene expression was analyzed after 24 h of IL-6 stimulation. Gene expression was determined relative to the housekeeping gene RPLP0 and expressed as fold-induction compared with the unstimulated vector control. Data represent pooled results from four independent experiments (mean ± SEM). (E) Fibroblasts of a healthy donor and P1 were stimulated with the indicated concentrations (ng/ml) of IL-6, IL-11, IL-27, OSM, and LIF. The levels of phospho-STAT3 (p-STAT3) were determined after 15-min stimulation by Phosflow. Titration curves are representative of two independent experiments. Curves are fitted by nonlinear/linear regression analysis. (F) Healthy donor and patient GP130 p.N404Y fibroblasts were treated as in E, and STAT1 phosphorylation (p-STAT1) was analyzed using flow cytometry. Titration curves are representative of two independent experiements. MFI, mean fluorescence intensity. (G) Lentiviral transduction of GP130 WT reconstitutes STAT3 phosphorylation in primary fibroblasts with p.N404Y variant. Fibroblasts were stimulated with 30 ng/ml IL-6 and 50 ng/ml IL-11 for 15 min. Quantification is based on four independent experiments. HD, healthy donor; LV, lentiviral. Differences were determined by Mann-Whitney U test. *, P < 0.05.

References

    1. Aulisa L., Papaleo P., Pola E., Angelini F., Aulisa A.G., Tamburrelli F.C., Pola P., and Logroscino C.A.. 2007. Association between IL-6 and MMP-3 gene polymorphisms and adolescent idiopathic scoliosis: a case-control study. Spine. 32:2700–2702. 10.1097/BRS.0b013e31815a5943 - DOI - PubMed
    1. Betz U.A., Bloch W., van den Broek M., Yoshida K., Taga T., Kishimoto T., Addicks K., Rajewsky K., and Müller W.. 1998. Postnatally induced inactivation of gp130 in mice results in neurological, cardiac, hematopoietic, immunological, hepatic, and pulmonary defects. J. Exp. Med. 188:1955–1965. 10.1084/jem.188.10.1955 - DOI - PMC - PubMed
    1. Boulanger M.J., Chow D.C., Brevnova E.E., and Garcia K.C.. 2003. Hexameric structure and assembly of the interleukin-6/IL-6 α-receptor/gp130 complex. Science. 300:2101–2104. 10.1126/science.1083901 - DOI - PubMed
    1. Dagoneau N., Scheffer D., Huber C., Al-Gazali L.I., Di Rocco M., Godard A., Martinovic J., Raas-Rothschild A., Sigaudy S., Unger S., et al. . 2004. Null leukemia inhibitory factor receptor (LIFR) mutations in Stuve-Wiedemann/Schwartz-Jampel type 2 syndrome. Am. J. Hum. Genet. 74:298–305. 10.1086/381715 - DOI - PMC - PubMed
    1. de Beaucoudrey L., Puel A., Filipe-Santos O., Cobat A., Ghandil P., Chrabieh M., Feinberg J., von Bernuth H., Samarina A., Jannière L., et al. . 2008. Mutations in STAT3 and IL12RB1 impair the development of human IL-17–producing T cells. J. Exp. Med. 205:1543–1550. 10.1084/jem.20080321 - DOI - PMC - PubMed

Associated data

LinkOut - more resources