. 2017 Sep 22;292(38):15717-15730.
doi: 10.1074/jbc.M117.792705. Epub 2017 Jul 26.

Crystal structure of the human Polϵ B-subunit in complex with the C-terminal domain of the catalytic subunit

Affiliations

Crystal structure of the human Polϵ B-subunit in complex with the C-terminal domain of the catalytic subunit

Andrey G Baranovskiy et al. J Biol Chem. .

Abstract

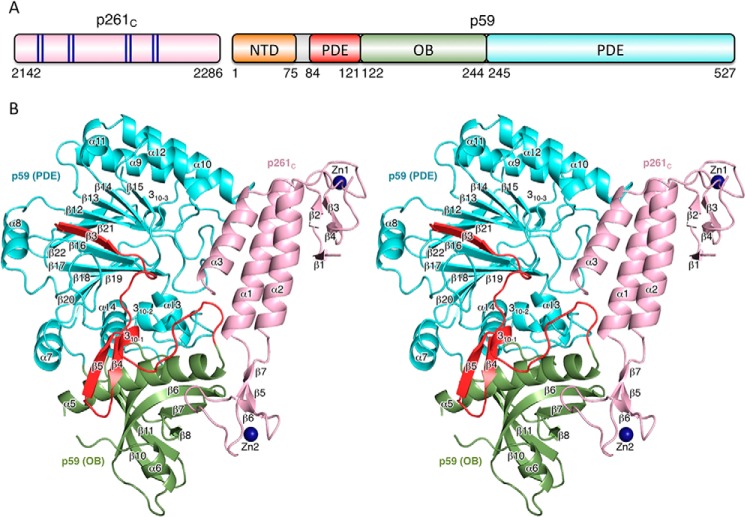
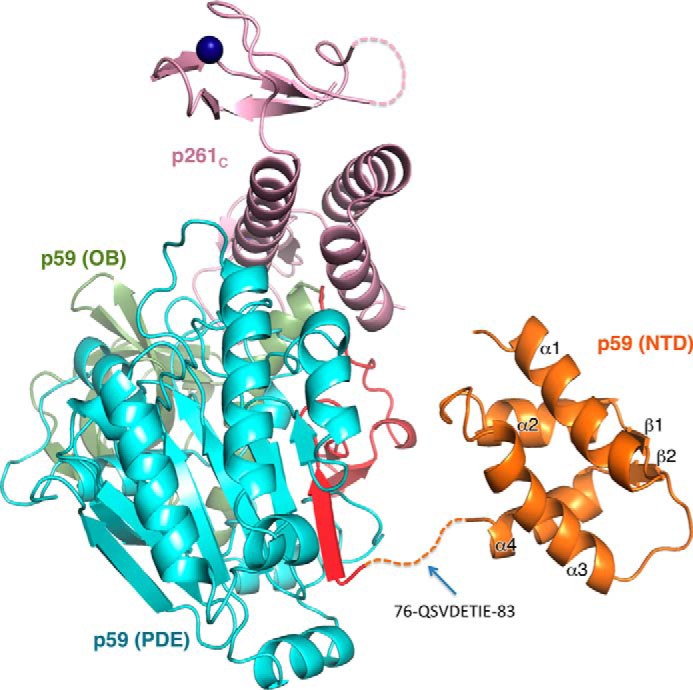
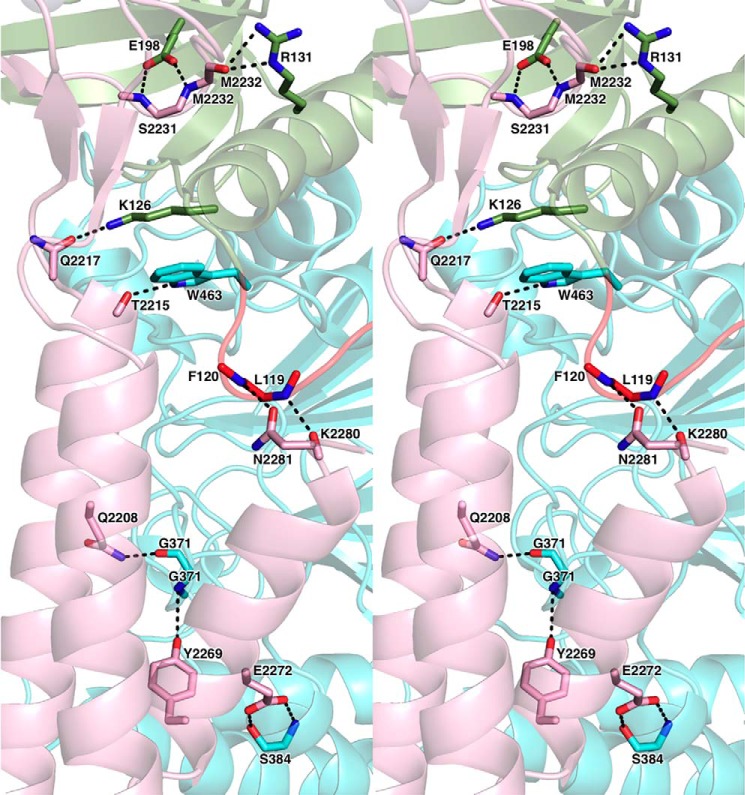
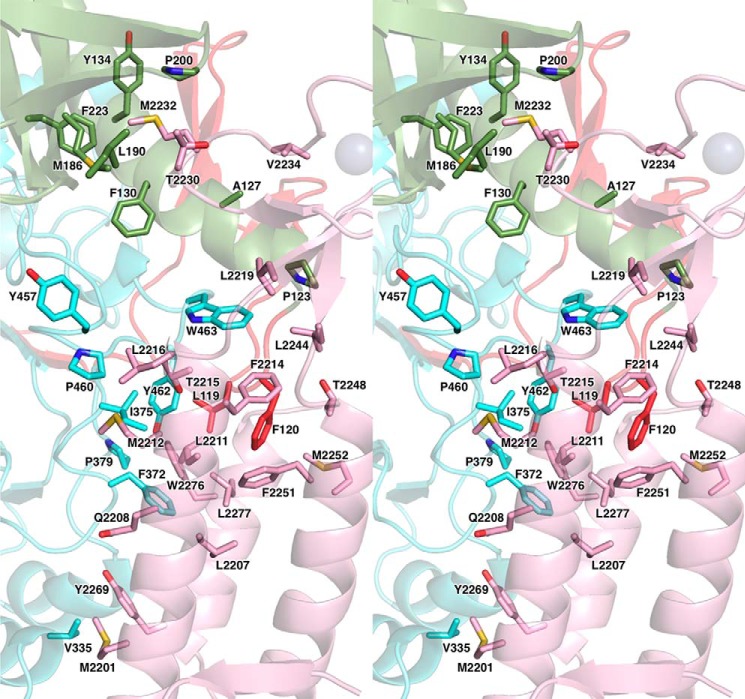
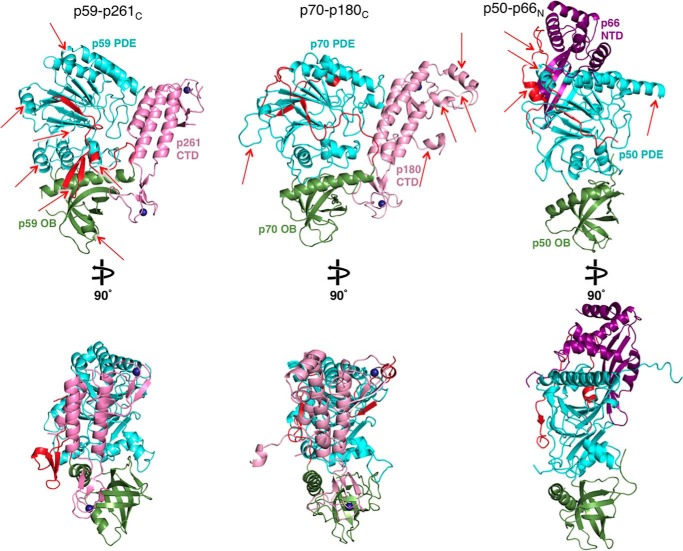
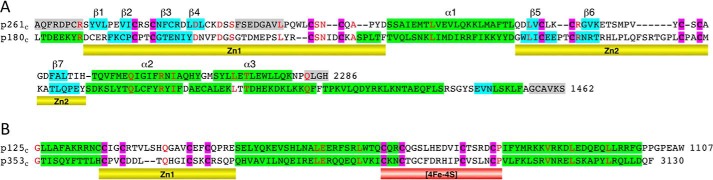
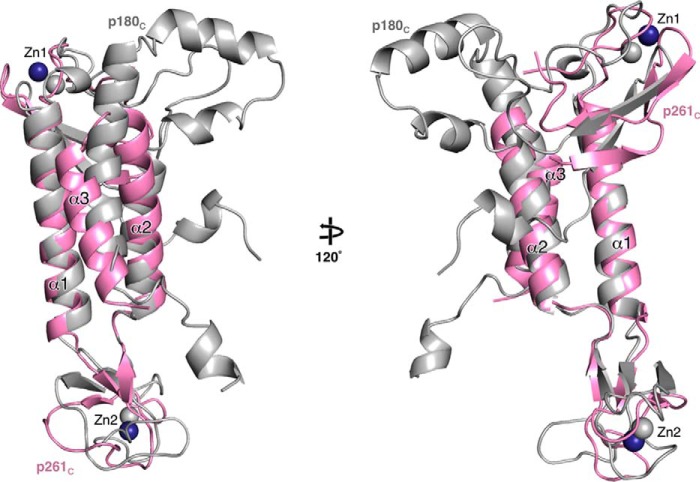
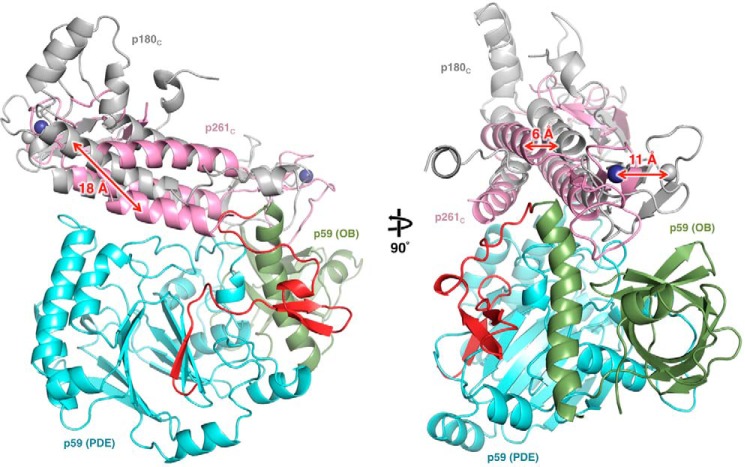
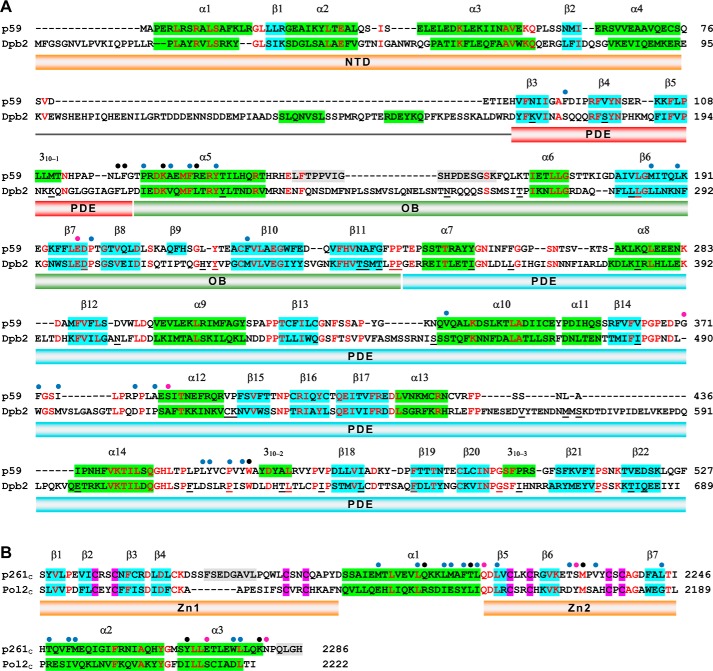
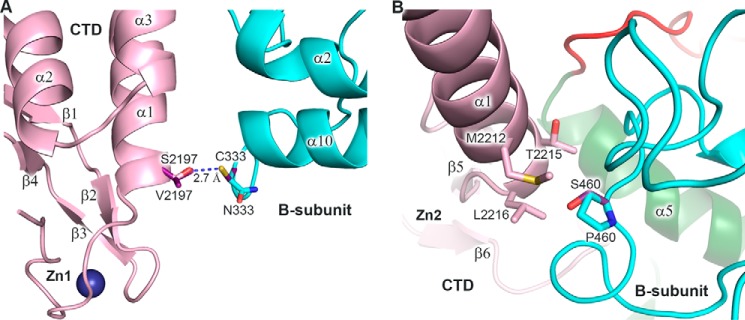
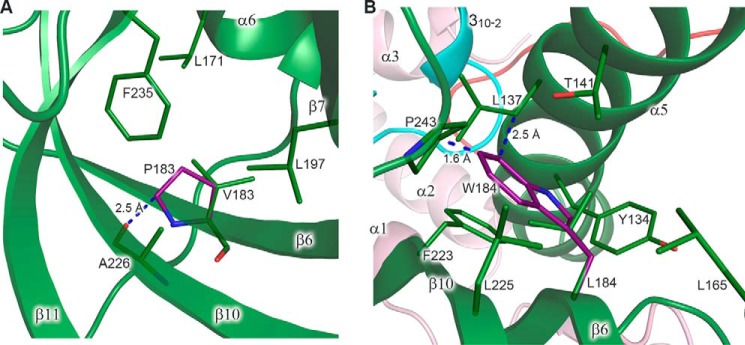
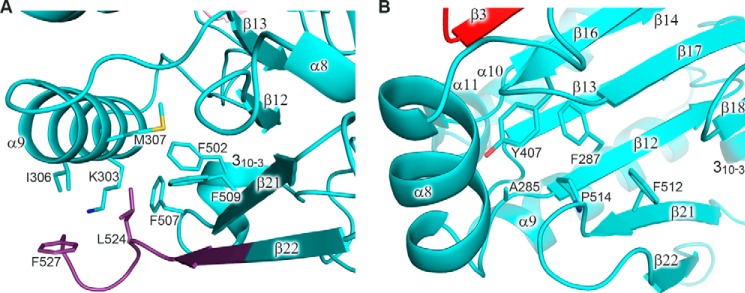
The eukaryotic B-family DNA polymerases include four members: Polα, Polδ, Polϵ, and Polζ, which share common architectural features, such as the exonuclease/polymerase and C-terminal domains (CTDs) of catalytic subunits bound to indispensable B-subunits, which serve as scaffolds that mediate interactions with other components of the replication machinery. Crystal structures for the B-subunits of Polα and Polδ/Polζ have been reported: the former within the primosome and separately with CTD and the latter with the N-terminal domain of the C-subunit. Here we present the crystal structure of the human Polϵ B-subunit (p59) in complex with CTD of the catalytic subunit (p261C). The structure revealed a well defined electron density for p261C and the phosphodiesterase and oligonucleotide/oligosaccharide-binding domains of p59. However, electron density was missing for the p59 N-terminal domain and for the linker connecting it to the phosphodiesterase domain. Similar to Polα, p261C of Polϵ contains a three-helix bundle in the middle and zinc-binding modules on each side. Intersubunit interactions involving 11 hydrogen bonds and numerous hydrophobic contacts account for stable complex formation with a buried surface area of 3094 Å2 Comparative structural analysis of p59-p261C with the corresponding Polα complex revealed significant differences between the B-subunits and CTDs, as well as their interaction interfaces. The B-subunit of Polδ/Polζ also substantially differs from B-subunits of either Polα or Polϵ. This work provides a structural basis to explain biochemical and genetic data on the importance of B-subunit integrity in replisome function in vivo.

Keywords: B-subunit; DNA polymerase epsilon; DNA replication; Dpb2; crystal structure; human; protein complex; zinc; zinc-binding module.


Conflict of interest statement

The authors declare that they have no conflicts of interest with the contents of this article

Figures

Figure 1.
Figure 1.
Overall structure of Polϵ p59–p261C. A, schematic representation of the domain organization. The dark blue lines in the schematics of p261C present the relative positions of the zinc-coordinating residues in two zinc-binding modules: Zn1 (Cys2158, Cys2161, Cys2187, and Cys2190) and Zn2 (Cys2221, Cys2224, Cys2236, and Cys2238). B, stereo view of p59–p261C. p261C is colored light pink; the PDE domain (excluding region 84–121) and OB domain are colored cyan and green, respectively. The N-terminal portion of the PDE domain (residues 84–121) is colored red. Zinc atoms are depicted as dark blue spheres.
Figure 2.
Figure 2.
Model of the p59–p261C structure. The model comprised of the crystal structure of p59–p261C and the NMR structure of NTD (Protein Data Bank code 2v6z) (39). The dashed line indicates the linker between NTD and PDE. The domains are colored as in Fig. 1.
Figure 3.
Figure 3.
Close-up stereo view of the hydrophilic contacts between p261C and p59. The secondary structure elements are shown with 60% transparency. The domains and carbons are colored according to Fig. 1. The side chains or main chains of the residues involved in intersubunit interactions are shown as sticks. The nitrogens, oxygens, and sulfurs are colored blue, red, and yellow, respectively.
Figure 4.
Figure 4.
Close-up stereo view of the hydrophobic contacts between p261C and p59. The presentation details are described in the Fig. 3 legend.
Figure 5.
Figure 5.
Side-by-side comparison of the Polϵ p59–p261C, Polα p70–p180C, and Polδ/Polζ p50–p66N crystal structures. Red arrows indicate the structural elements contributing to significant differences between the three structures. The coloring of molecules is similar to Fig. 1, except the p66N domain of Polδ/Polζ C-subunit is colored purple. Two different orientations are shown for each molecule. The molecules are displayed using Protein Data Bank entries 5vbn, 5exr, and 3e0j.
Figure 6.
Figure 6.
Structure-based sequence alignments of p261C with p180C (A) and p125C with p353C (B). Blue- and green-shaded boxes depict the α-helices and β-strands, respectively. The gray-shaded boxes indicate the residues that are disordered in the crystal structures of p261C and p180C. The secondary structure elements are from the crystal structures of p261C and p180C (A) and from Phyre (57) predictions for p125C and p353C (B). The conserved residues are highlighted in red. Magenta-shaded boxes depict the zinc-coordinating cysteines. Yellow bars indicate the sequences comprising the zinc-binding modules Zn1 and Zn2. The red bar indicates the sequences implicated in iron–sulfur cluster binding.
Figure 7.
Figure 7.
Differences between the Polϵ p261C and Polα p180C structures. The molecules were aligned by superposition of the conservative helices α1 and α2. p261C and p180C are colored light pink and gray, respectively.
Figure 8.
Figure 8.
Comparison of CTD docking on the B-subunit between p59–p261C and p70–p180C. Both CTD–B-subunit complexes were aligned by superposition of the B-subunits; p70 is omitted for clarity. The p59–p261C domains are colored according to Fig. 1, and p180C is colored gray.
Figure 9.
Figure 9.
Structure-based sequence alignments of the B-subunits (A) and CTDs (B) of human and yeast Polϵ. The α-helices and β-strands are depicted by green- and blue-shaded boxes, respectively. The gray-shaded boxes indicate the residues that are disordered in the crystal structure of p59–p261C. The conserved residues are shown in red. The blue, pink, and black circles indicate amino acids involved in intersubunit hydrophobic, hydrophilic, and both types of interactions, respectively. The Dpb2 residues listed in Table 2 are underlined. The fold prediction for the yeast Polϵ subunits was performed using Phyre (57).
Figure 10.
Figure 10.
Modeling of the amino acid changes mapped to the intersubunit interface. A, modeling of p59 Cys333 and p261C Val2197 in place of asparagine and serine, respectively. Only one conformation of Cys333 is allowed to avoid steric hindrance with main-chain atoms. In both allowed conformations of Val2197 (only one is shown for clarity), there is a clash with Cys333. B, modeling of p59 Ser460 in place of proline. The p59–p261C domains are colored according to Fig. 1. Carbons of the modeled residues are colored purple. A blue dashed line depicts the distance between atoms. Zn1 and Zn2 labels show the position of corresponding zinc-binding modules.
Figure 11.
Figure 11.
Modeling of the amino acid changes inducing steric hindrance. A, close-up view of a hydrophobic pocket with modeled proline in place of Val183. Val183 makes two main-chain–to–main-chain hydrogen bonds with Ala226 (not shown). Leu171, Val183, Leu197, Ala226, and Phe235 of p59 correspond to Leu274, Leu284, Leu298, Val328, and Phe339 of Dpb2, respectively. B, close-up view of a hydrophobic pocket with modeled tryptophan in place of Leu184. In the shown conformation, tryptophan clashes with the side chains of Pro243 and Leu137. Tyr134, Leu137, Thr141, Leu165, Leu184, Phe223, Leu225, and Pro243 of p59 correspond to Tyr222, Thr225, Val229, Ile268, Leu285, Met325, Leu327, and Pro347 of Dpb2, respectively. p59 and p261C are colored according to Fig. 1. Carbons of the modeled residues are colored purple. The residues are shown as sticks. The secondary structure elements are shown with 20% transparency. Blue dashed lines depict the closest distance between the residues. Proline and tryptophan rotamers, shown in A and B, respectively, correspond to minimal steric hindrance.
Figure 12.
Figure 12.
Analysis of the role of Pro514 and the extreme C-terminal region on p59 folding. A, close-up view of a hydrophobic pocket containing Leu524 and Phe527. The carbons of p59 residues corresponding to the deleted region in the Dpb2-200 mutant are colored purple. Lys303, Ile306, Met307, Phe502, Phe507, and Phe509 of p59 correspond to Ala416, Lys419, Ile420, Phe664, Ala670, and Tyr672 of Dpb2, respectively. B, close-up view of a hydrophobic pocket containing Pro514. Ala285, Phe287, Tyr407, and Phe512 of p59 correspond to His397, Phe399, Tyr534, and Tyr675 of Dpb2, respectively. The p59 domains are colored according to Fig. 1. Side chains of the residues are shown as sticks.
Figure 13.
Figure 13.
Photomicrograph of the p59–p261C crystal.

References

    1. Nick McElhinny S. A., Gordenin D. A., Stith C. M., Burgers P. M., and Kunkel T. A. (2008) Division of labor at the eukaryotic replication fork. Mol. Cell 30, 137–144 - PMC - PubMed
    1. Pavlov Y. I., and Shcherbakova P. V. (2010) DNA polymerases at the eukaryotic fork-20 years later. Mutat. Res. 685, 45–53 - PMC - PubMed
    1. Burgers P. M., and Kunkel T. A. (2017) Eukaryotic DNA replication fork. Annu. Rev. Biochem. 86, 417–438 - PMC - PubMed
    1. Pellegrini L. (2012) The Pol alpha-primase complex. Subcell. Biochem. 62, 157–169 - PubMed
    1. Baranovskiy A. G., and Tahirov T. H. (2017) Elaborated action of the human primosome. Genes (Basel) 8, 62 - PMC - PubMed

Publication types

Substances

LinkOut - more resources