. 2017 Jul 26;9(400):eaal1645.
doi: 10.1126/scitranslmed.aal1645.

Repression of BET activity sensitizes homologous recombination-proficient cancers to PARP inhibition

Affiliations

Repression of BET activity sensitizes homologous recombination-proficient cancers to PARP inhibition

Lu Yang et al. Sci Transl Med. .

Abstract

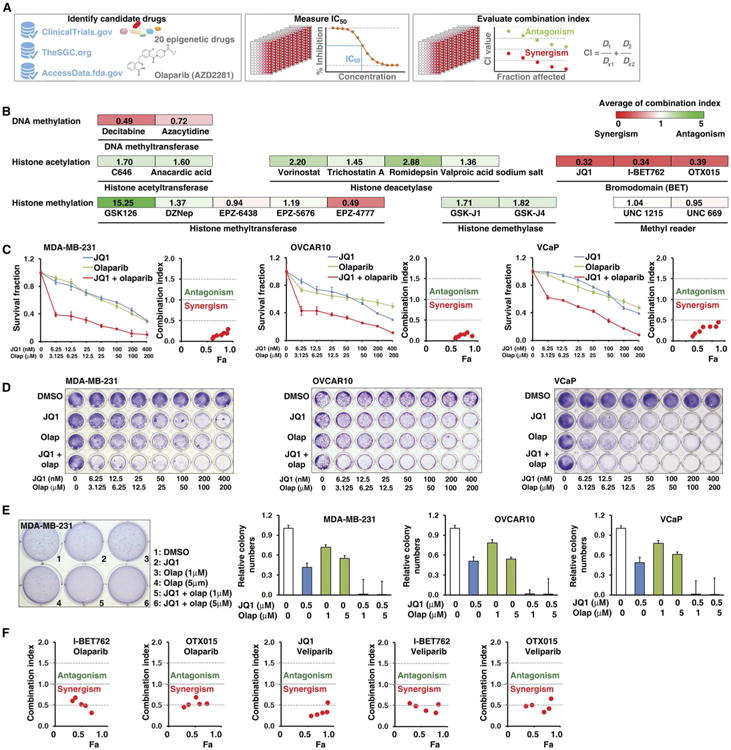
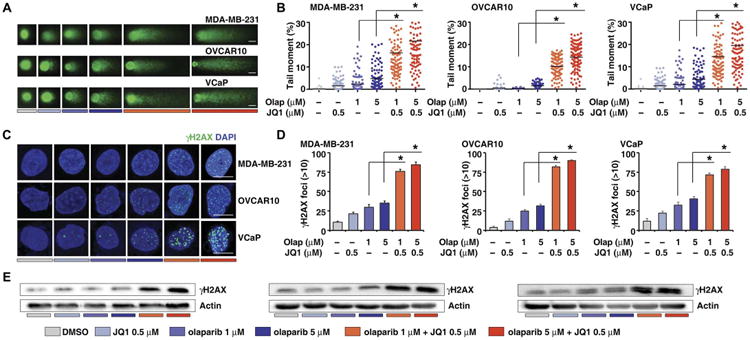
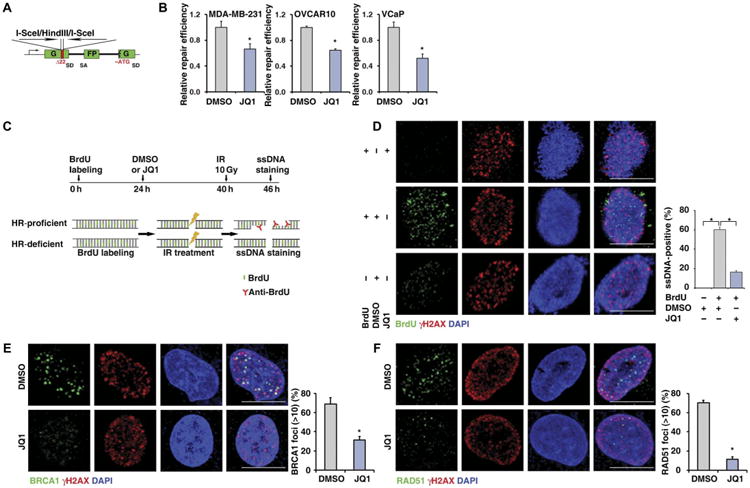
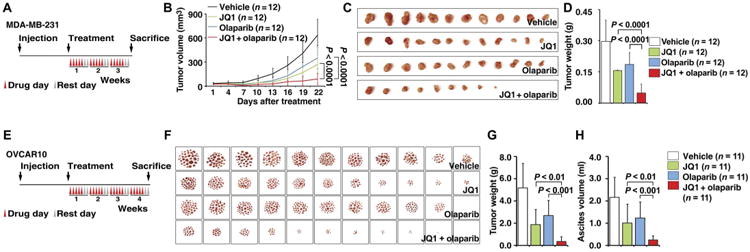
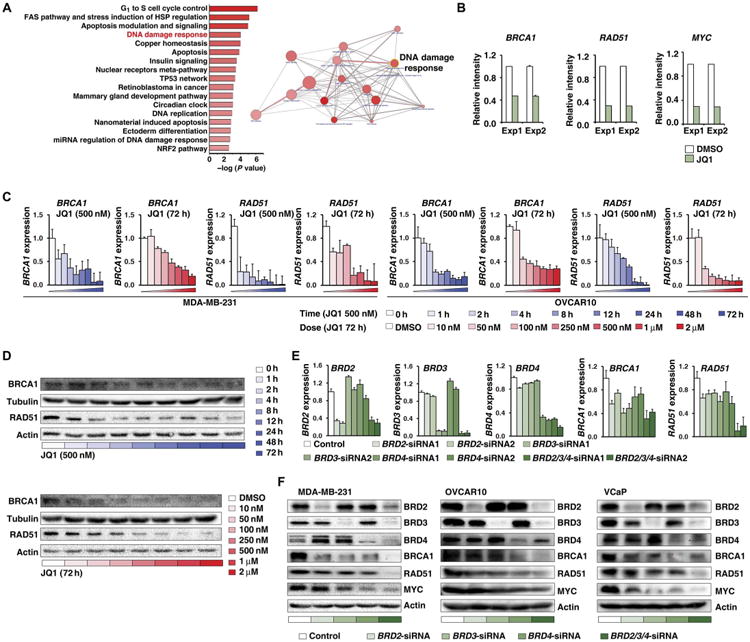
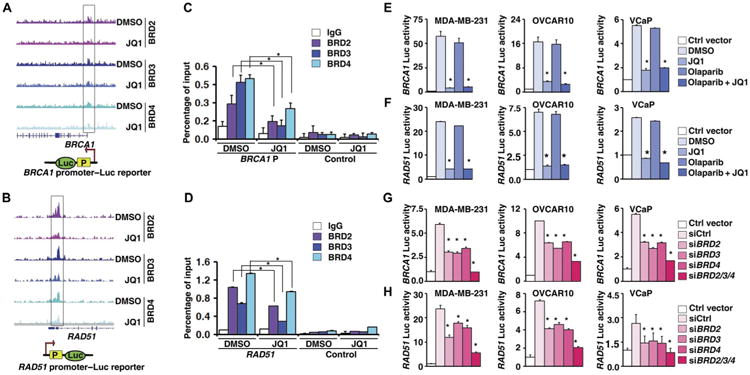
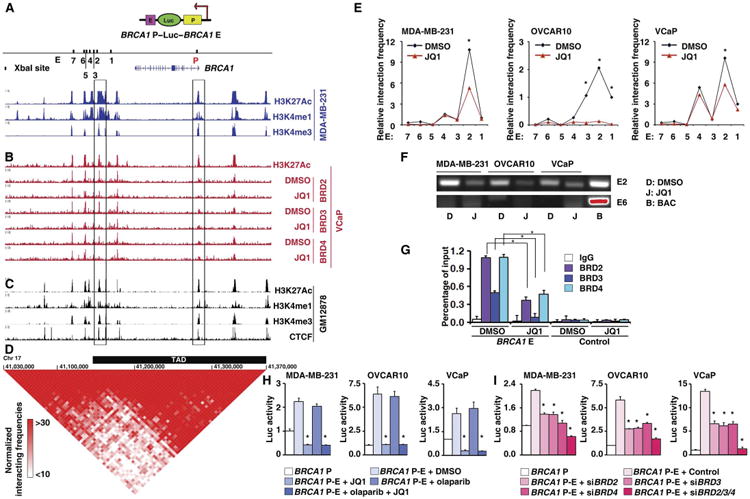
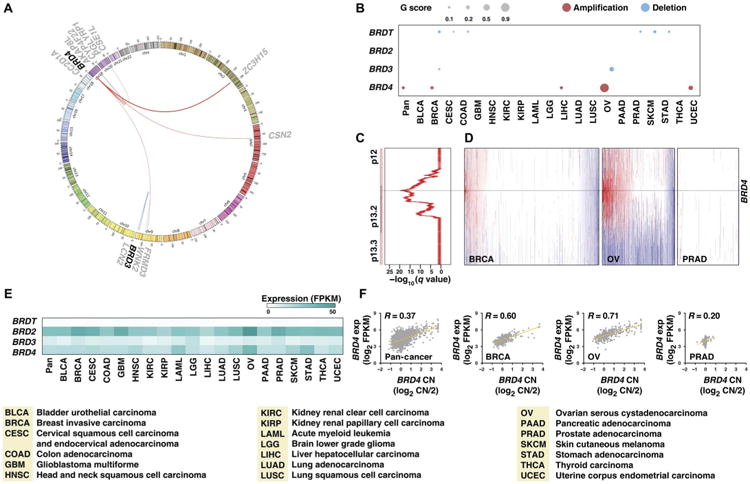
Strategies to enhance response to poly(adenosine diphosphate-ribose) polymerase inhibitor (PARPi) in primary and acquired homologous recombination (HR)-proficient tumors would be a major advance in cancer care. We used a drug synergy screen that combined a PARPi, olaparib, with 20 well-characterized epigenetic drugs and identified bromodomain and extraterminal domain inhibitors (BETis; JQ1, I-BET762, and OTX015) as drugs that acted synergistically with olaparib in HR-proficient cancer cells. Functional assays demonstrated that repressed BET activity reduces HR and thus enhances PARPi-induced DNA damage in cancer cells. We also found that inhibition or depletion of BET proteins impairs transcription of BRCA1 and RAD51, two genes essential for HR. Moreover, BETi treatment sensitized tumors to PARP inhibition in preclinical animal models of HR-proficient breast and ovarian cancers. Finally, we showed that the BRD4 gene was focally amplified across 20 types of common cancers. Combination with BETi could greatly expand the utility of PARP inhibition to patients with HR-proficient cancer.


Figures

Fig. 1
Fig. 1. Drug combination screen identifies BETi as acting synergistically with PARPi
(A) The workflow of drug combination screen. IC50, median inhibitory concentration. (B) Twenty compounds targeting seven classes of epigenetic modulators were examined in a combination screen with the PARPi, olaparib, in MDA-MB-231 cells. The CI quantitatively depicts synergism (CI < 1), additive effect (CI = 1), and antagonism (CI > 1). The color intensity shows the average of CI (red, synergism; green, antagonism). DZNep, 3-deazaneplanocin A. (C) Sensitivity of MDA-MB-231, OVCAR10, and VCaP to olaparib (Olap) alone, JQ1 alone, or olaparib combined with JQ1. Survival fraction (left) and the CI (right) are shown for each of these three cell lines. Fa, fraction affected. Error bars represent means ± SD. (D) Crystal violet staining of anchorage-dependent colony formation assay indicates the sensitivity of cells to dimethyl sulfoxide (DMSO), JQ1, olaparib, or olaparib combined with JQ1. Effect of treatments is shown for MDA-MB-231, OVCAR10, and VCaP cells. (E) Anchorage-independent soft agar assay results for MDA-MB-231, OVCAR10, and VCaP cells treated with DMSO, JQ1, olaparib, or olaparib combined with JQ1. Crystal violet staining of MDA-MB-231 and colony quantification results of all three cell lines are shown. Error bars represent means ± SD. (F) Drug combination results (CI) for two PARPis (olaparib and veliparib) and three BETis (I-BET762, OTX015, and JQ1) examined in MDA-MB-231.
Fig. 2
Fig. 2. BET inhibition enhances PARPi-induced DNA damage
(A) DNA damage in MDA-MB-231, OVCAR10, and VCaP cells treated with DMSO, JQ1, olaparib, or JQ1 combined with olaparib, measured by the comet assay. Scale bars, 10 μm. (B) Extent of DNA damage, quantified by the tail moment in the comet assay. Statistical analysis by Student's t test, *P < 0.05; n = 3. Bars represent mean values of tail moment. (C) Representative images of γH2AX foci in MDA-MB-231, OVCAR10, and VCaP cells treated with DMSO, JQ1, olaparib, or JQ1 combined with olaparib. Scale bars, 10μm. DAPI, 4′,6-diamidino-2-phenylindole. (D) Quantification of the number of γH2AX-positive foci in MDA-MB-231, OVCAR10, and VCaP cells treated with DMSO, JQ1, olaparib, or JQ1 combined with olaparib. Statistical analysisbyStudent's t test, *P < 0.05;n = 3. Error bars represent means ± SD. (E) Western blot analysis of gH2AX in MDA-MB-231, OVCAR10, and VCaP cells treated with DMSO, JQ1, olaparib, or JQ1 combined with olaparib.
Fig. 3
Fig. 3. BET inhibition reduces homologous recombination
(A) Schematic illustration of HR reporter assay. SD, splice donor; SA, splice acceptor; G, green; FP, fluorescent protein; ATG, the triplet code for the amino acid methionine. (B) HR-mediated DNA repair activity, measured by HR reporter assay, in MDA-MB-231 (left), OVCAR10 (middle), and VCaP (right). Statistical analysis by Student's t test, *P < 0.05; n = 3. Error bars represent means ± SD. (C) Schematic illustration of ssDNA staining assay. BrdU, 5-bromo-2′-deoxyuridine. (D) Representative images (left) and quantitative results (right) of IR-induced ssDNA foci formation in DMSO- or JQ1-treated MDA-MB-231 cells. Cells without BrdU incorporation were used as negative control. Scale bars, 10 μm. (E and F) Representative images (left) and quantitative results (right) of IR-induced BRCA1 (E) and RAD51 (F) foci formation in DMSO- or JQ1-treated MDA-MB-231 cells. Scale bars, 10 μm. Ten gray (Gy) of IR was used for all three cell lines. Statistical analysis by Student's t test, *P < 0.05; n = 3 (D to F). Error bars represent means ± SD.
Fig. 4
Fig. 4. BET inhibition sensitizes HR-proficient tumors to PARPi treatment in vivo
(A) Schematic illustrating the MDA-MB-231 mouse xenograft experimental design. MDA-MB-231 cells were implanted in the mammary fat pad and grown until tumors reached a size of about 30 mm3. Xenografted mice were randomized and then received vehicle, JQ1 (50 mg/kg), olaparib (50 mg/kg), or the combination of both agents as indicated (5 days a week for 3 weeks). Caliper measurements were taken every 3 days after the initiation of drug treatment. (B) Mean tumor volume is shown. Statistical analysis by Student's t test. Error bars represent means ± SD. (C) Images of tumors collected from animals receiving vehicle, JQ1, olaparib, or the combination of both agents. (D) Individual tumor weights from different treatment groups are shown. Statistical analysis by Student's t test. Error bars represent means ± SD. (E) Schematic illustrating the OVCAR10 mouse xenograft experimental design. OVCAR10 cells were implanted intraperitoneally in mice and grown for 2 weeks. Xenografted mice were randomized and then received vehicle, JQ1 (50 mg/kg), olaparib (50 mg/kg), or the combination of both agents as indicated (5 days a week for 4 weeks). (F) Images of the tumor nodes (diameter, >0.5 mm) collected from mice receiving different treatments. (G and H) Quantification of the weight of tumor nodules (G) and the volume of ascites (H) in mice receiving different treatments. Statistical analysis by Student's t test. Error bars represent means ± SD.
Fig. 5
Fig. 5. BET inhibition and depletion repress the expression of BRCA1 and RAD51
(A) Pathways overrepresented by JQ1 response genes (fold change, >2) in VCaP cells according to ConsensusPathDB analysis on the basis of gene ontology terms (left). Diagram depicts pathway interactions, grouped by pathways (right). Line thickness corresponds to the number of shared proteins between two pathways. Circle size corresponds to the number of JQ1 response genes in each pathway. The color intensity of circle indicates the P value for each pathway. miRNA, microRNA. (B) RNA expression of BRCA1, RAD51, and MYC in two independent microarray experiments in VCaP cells treated with DMSO or JQ1 (500 nM for 24 hours). (C) BRCA1 and RAD51 mRNA expression measured by real-time RT-PCR in MDA-MB-231 cells (left) and OVCAR10 cells (right) treated with 500 nM JQ1 for different time periods or with different concentrations of JQ1 for 72 hours. Error bars represent means ± SD. (D) BRCA1 and RAD51 expression assessed by Western blot in MDA-MB-231 cells treated with 500 nM JQ1 for different time periods (top) or with different concentrations of JQ1 for 72 hours (bottom). Tubulin and actin served as loading controls. (E) BRD2/3/4, BRCA1, and RAD51 mRNA expression in MDA-MB-231 cells treated with individual BRD2/3/4 siRNAs or with BRD2/3/4 siRNA pools. Error bars represent means ± SD. (F) BRD2/3/4, BRCA1, RAD51, and MYC expression measured by Western blot in cells treated with individual BRD2/3/4 siRNAs or with a BRD2/3/4 siRNA pool. Left: MDA-MB-231. Middle: OVCAR10. Right: VCaP. Actin served as a loading control.
Fig. 6
Fig. 6. JQ1 directly represses the promoter activities of BRCA1 and RAD51
(A and B) BRD2/3/4 binding pattern in the BRCA1 (A) or RAD51 (B) promoter regions in VCaP cells treated with DMSO or JQ1. Bottom: Illustrations of BRCA1 promoter–luciferase (Luc) (A) and RAD51 promoter–Luc (B) reporters, in which BRCA1 or RAD51 promoter containing the BRD2/3/4 binding region was cloned into pGL3. (C and D) Quantification of the amount of BRCA1 (C) or RAD51 (D) promoter bound to BRD2/3/4 in MDA-MB-231 cells treated with DMSO or JQ1. Statistical analysis by Student's t test, *P < 0.05; n = 3. Error bars represent means ± SD. IgG, immunoglobulin G. (E and F) Luciferase reporter assay of the activities of the BRCA1 (E) and RAD51 (F) core promoter reporters in MDA-MB-231, OVCAR10, and VCaP cells treated with DMSO, JQ1, olaparib, or JQ1 combined with olaparib. Statistical analysis by Student's t test, *P < 0.05; n = 3. Error bars represent means ± SD. (G and H) Luciferase reporter assay of the activities of the BRCA1 (G) and RAD51 (H) core promoter reporters in MDA-MB-231, OVCAR10, and VCaP cells treated with individual siRNAs targeting BRD2/3/4 or pooled siRNAs. Statistical analysis by Student's t test, *P < 0.05; n = 3. Error bars represent means ± SD.
Fig. 7
Fig. 7. JQ1 represses the enhancer-promoter interaction of BRCA1
(A) H3K27Ac, H3K4me1, H3K4me3 profiles in MDA-MB-231. Right and left rectangle frame areas indicate the BRCA1 promoter and enhancer locus 2, respectively, which were used for the BRCA1 promoter-enhancer reporter construct. Upper schematic illustration indicates the construction of the BRCA1 promoter-enhancer reporter. Lower schematic illustrates the Xba I restriction sites in BRCA1 promoter and enhancer loci. P in red indicates promoter, and E in black indicates enhancer. Numbers 1 to 7 indicate seven Xba I restriction sites in the enhancer locus. The position of the BRCA1 gene is indicated below. (B) H3K27Ac in VCaP cells (top) and BRD2/3/4 profiles in VCaP treated with DMSO or JQ1 (bottom). (C) H3K27Ac, H3K4me1, H3K4me3, and CCCTC-binding factor (CTCF) profiles in GM12878. (D) A BRCA1 topologically associated domain (TAD) region (indicated by a thick black bar) was predicted on the basis of the Hi-C data. Normalized Hi-C interacting frequencies were shown as a triangle-like two-dimensional heat map, which was overlaid on ChIP-seq data (C) in GM12878 cells. Red indicates the intensity of the interacting frequencies of the Hi-C data. Chr 17, chromosome 17. (E) 3C-qPCR analysis of long-distance interactions between the BRCA1 promoter and seven enhancer loci [locus 1 to 7 indicated in (A)]. The relative amount of ligation product between the BRCA1 promoter and each of the seven different enhancer loci was plotted. Results from MDA-MB-231, OVCAR10, and VCaP cells treated with DMSO or JQ1 are shown. The data were normalized to a GAPDH loading control. (F) PCR products from the BRCA1 promoter and enhancer locus 2 (E2, top) and from the BRCA1 promoter and enhancer locus 6 (E6, bottom). Ligation sample from bacterial artificial chromosome (BAC) was used as a positive control. No specific PCR product was found in the ligation sample from the BRCA1 promoter and enhancer locus 6, even when the BAC control band was overexposed (shown in red). (G) Quantification of the amount of BRCA1 enhancer locus 2 bound to BRD2/3/4 in MDA-MB-231 cells treated with DMSO or JQ1. (H) Luciferase reporter assay of BRCA1 enhancer activity in MDA-MB-231, OVCAR10, and VCaP cells treated with DMSO, JQ1, olaparib, or JQ1 combined with olaparib. (I) Luciferase reporter assay of BRCA1 enhancer activity in MDA-MB-231, OVCAR10, and VCaP cells treated with BRD2/3/4 siRNA.
Fig. 8
Fig. 8. Recurrent copy number amplification of BRD4 gene was observed across common cancers
(A) Fusions of BET genes in TCGA samples are shown by a Circos plot. The fused genes are illustrated as a line that connects two parental genes. Line thickness corresponds to FFPM (fusion fragments per million total RNA-seq reads) value. (B) Plot of the recurrent copy number alterations in BET genes across 20 cancer types. Red and blue indicate amplification and deletion, respectively. Dot size indicates the G score, which represents frequency and amplitude of copy number alteration. (C) Significance of recurrent BRD4 amplification across 20 types of cancers. GISTIC q values (x axis) for amplifications are plotted across the genomic locus harboring the BRD4 gene (y axis). (D) Copy number profiles of the BRD4 locus from breast, ovarian, and prostate tumor specimens. Each sample is represented with a vertical line, and the positions of BRD4 are noted with black horizontal lines. Red, gain; blue, loss. (E) Heat map of the 50th percentile of BET gene mRNA expression across cancers. Each cancer type is represented by a column, and each BET gene is represented by a row. The intensity of blue indicates mRNA expression. FPKM, fragments per kilobase of exon per million. (F) A positive correlation between BRD4 gene copy number (CN) and RNA expression was observed in cancer specimens.

References

    1. Lord CJ, Tutt ANJ, Ashworth A. Synthetic lethality and cancer therapy: Lessons learned from the development of PARP inhibitors. Annu Rev Med. 2015;66:455–470. - PubMed
    1. Scott CL, Swisher EM, Kaufmann SH. Poly (ADP-ribose) polymerase inhibitors: Recent advances and future development. J Clin Oncol. 2015;33:1397–1406. - PMC - PubMed
    1. Konstantinopoulos PA, Ceccaldi R, Shapiro GI, D'Andrea AD. Homologous recombination deficiency: Exploiting the fundamental vulnerability of ovarian cancer. Cancer Discov. 2015;5:1137–1154. - PMC - PubMed
    1. Feng FY, de Bono JS, Rubin MA, Knudsen KE. Chromatin to clinic: The molecular rationale for PARP1 inhibitor function. Mol Cell. 2015;58:925–934. - PMC - PubMed
    1. Pommier Y, O'Connor MJ, de Bono J. Laying a trap to kill cancer cells: PARP inhibitors and their mechanisms of action. Sci Transl Med. 2016;8:362ps17. - PubMed

MeSH terms