. 2017 Jul 26;7(1):6542.
doi: 10.1038/s41598-017-06970-x.

Generation of ribosome imprinted polymers for sensitive detection of translational responses

Affiliations

Generation of ribosome imprinted polymers for sensitive detection of translational responses

Helen A King et al. Sci Rep. .

Abstract

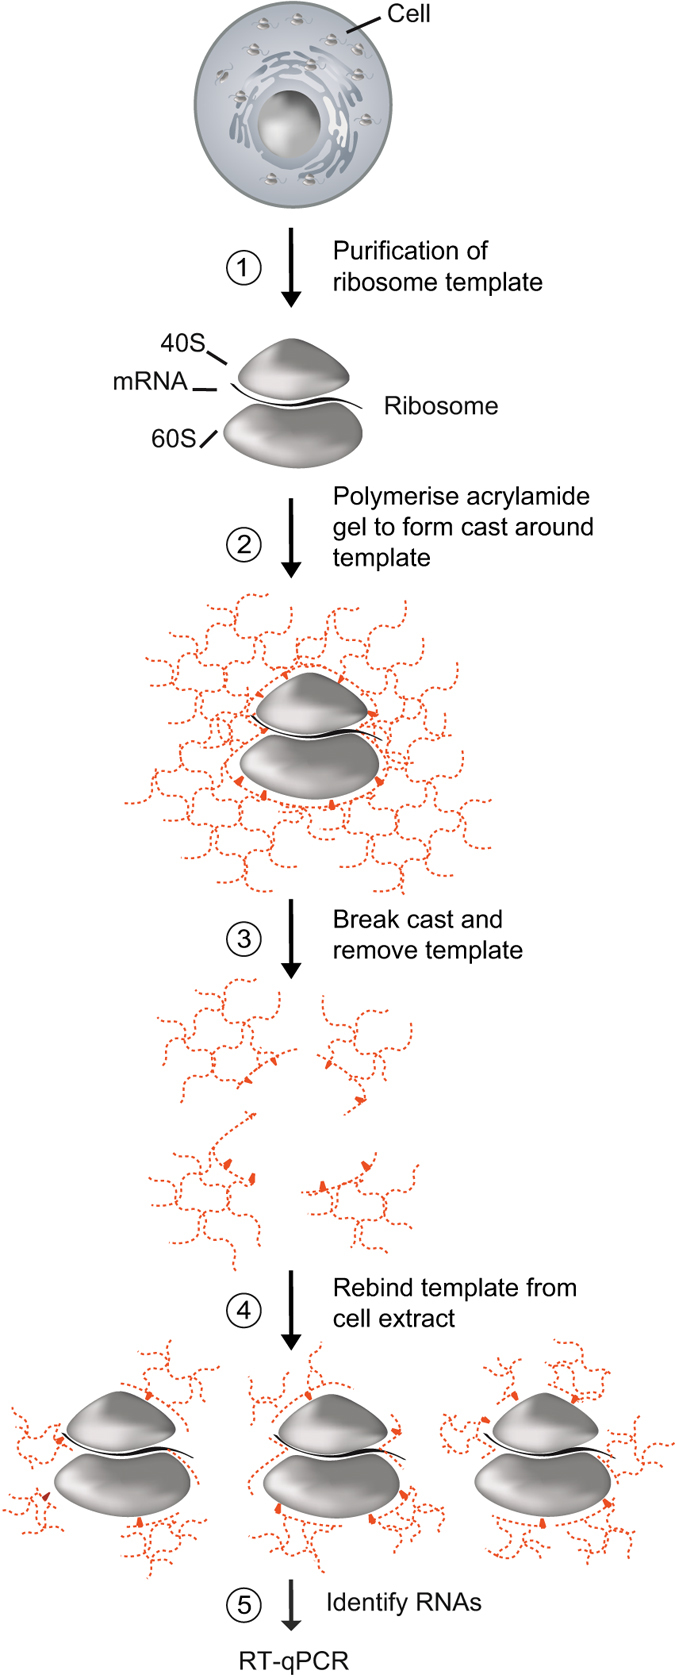
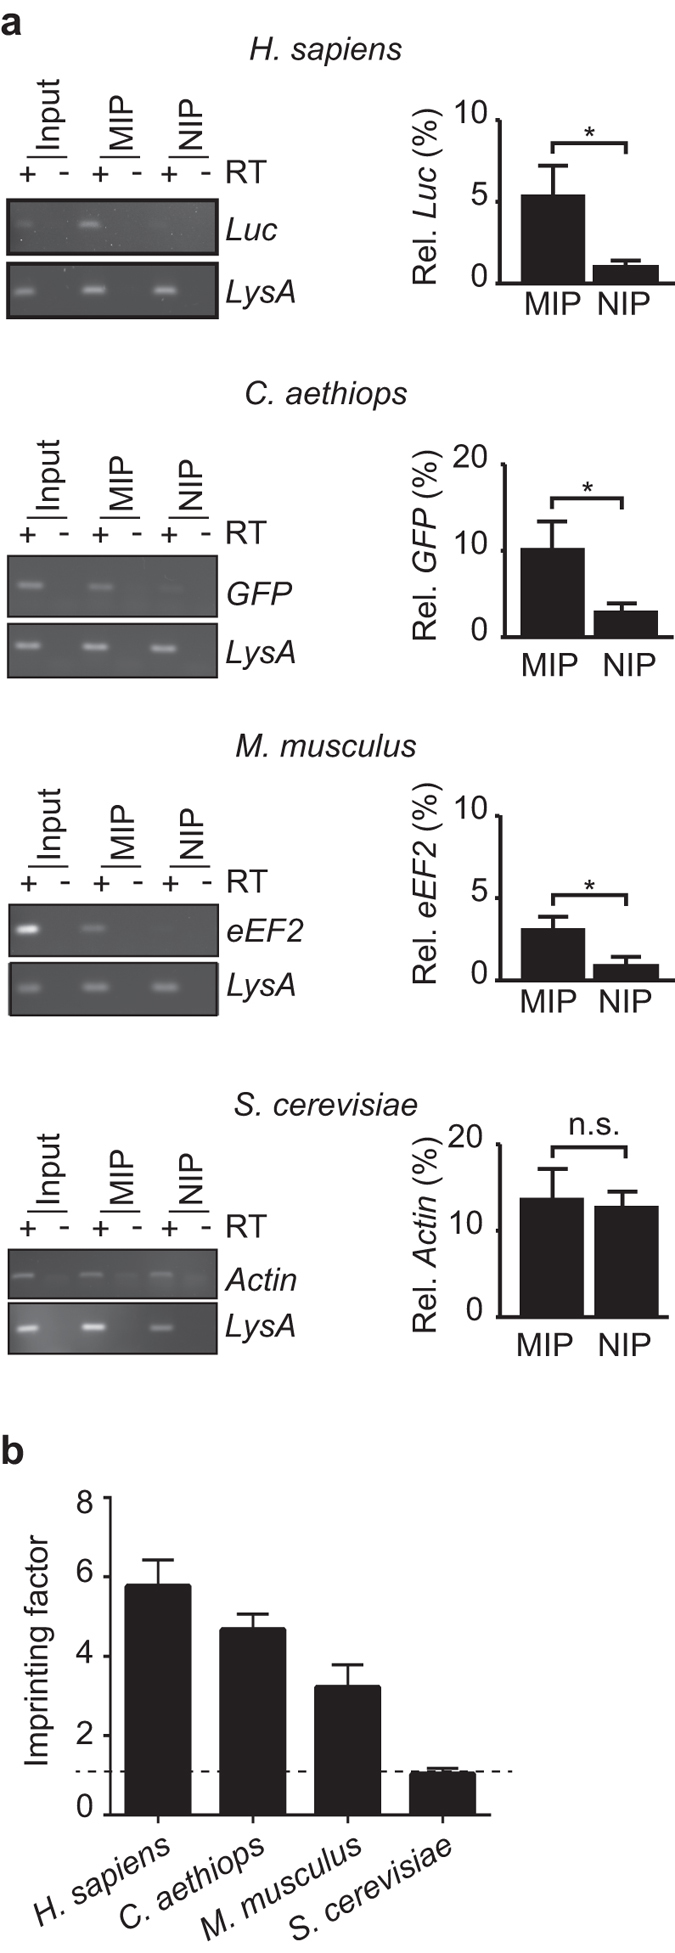
Whilst the profiling of the transcriptome and proteome even of single-cells becomes feasible, the analysis of the translatome, which refers to all messenger RNAs (mRNAs) engaged with ribosomes for protein synthesis, is still an elaborate procedure requiring millions of cells. Herein, we report the generation and use of "smart materials", namely molecularly imprinted polymers (MIPs) to facilitate the isolation of ribosomes and translated mRNAs from merely 1,000 cells. In particular, we show that a hydrogel-based ribosome imprinted polymer could recover ribosomes and associated mRNAs from human, simian and mice cellular extracts, but did not selectively enrich yeast ribosomes, thereby demonstrating selectivity. Furthermore, ribosome imprinted polymers enabled the sensitive measurement of an mRNA translational regulatory event, requiring 1,000-fold less cells than current methodologies. These results provide first evidence for the suitability of MIPs to selectively recover ribonucleoprotein complexes such as ribosomes, founding a novel means for sensitive detection of gene regulation.


Conflict of interest statement

The authors declare that they have no competing interests.

Figures

Figure 1
Figure 1
Schematic overview of R-MIP preparation. First, ribosomes are isolated from HeLa cell cytoplasmic extract using a sucrose cushion. Second, the ribosome template is combined with a mixture of acrylamide (AA) and N,N′-methylenebisacrylamide (MBAm) monomers, and polymerisation is induced under gaseous nitrogen upon addition of the initiator ammonium persulfate (APS) and the catalyst N,N,N′,N′-tetramethylethylenediamine (TEMED). Third, the hydrogel is granulated by passing through a sieve mesh, and the ribosome template is removed from the MIP. This results in a slurry of heterogeneous PAA fragments, with cavities possessing the potential to recognise more template, based both upon three dimensional structure and direct interactions between the template and chemical groups on the surfaces of the cavities. Fourth, MIPs are combined with cellular extracts to capture ribosomes and associated mRNAs. Fifth, ribosome-associated mRNAs are isolated from the MIP for further analysis, such as reverse transcription (RT)-quantitative PCR (qPCR).
Figure 2
Figure 2
Preparation of translationally active ribosomal template. (a) RNA extracted from the purified 40S and 60S subunits and whole ribosome pellet were separated on an agarose gel; the position of 28S and 18S rRNA are indicated. (b) Colloidal coomassie stained 15% PAA gel for visualisation of proteins contained in the ribosome pellet and purified 40S and 60S ribosomal subunits. A marker (M) with molecular weights in kilodaltons (kDa) is shown to the left. (c) Immunoblot analysis with specific antibodies detecting RPS12, RPL13 (RPs as positive control), GAPDH and β-actin (non-RPs as negative control). Lanes refer to the following: Extract, total cytoplasmic extract; Pellet, ribosome pellet; Sup, supernatant of the ribosome pellet. Images of uncropped gels and blots are shown in the Supplementary Fig. S1. (d) In vitro translation assays in rabbit reticulocyte lysate. CHX was added to lysates to inhibit translational activity, followed by supplementation of the lysate with increasing amounts of purified human ribosomes (2 μg, 4 μg, and 8 μg). Height of the bars indicates relative bioluminescence of translated firefly Luc protein (Fluc) compared to untreated lysates (100%). A sample without RNA (No RNA) was added as a control to measure background bioluminescence of untreated lysates. Error bars represent standard deviation (SD), n = 3. ***P < 0.005, two-tailed student’s t-test with equal variance.
Figure 3
Figure 3
Imprinting and removal of template ribosomes from MIPs. (a) Coomassie stained PAA gel showing a titration of the purified ribosomes used for imprinting (R-input), and the content of sieved and granulated MIPs before (Rt-MIPs) and after (R-MIP) elution of the ribosome template. An immunoblot for detection of RPS6 (protein of the 40S subunit), and RPL26 (protein of the 60S subunit) is shown at the bottom. A quantification depicting the fraction of RPs compared to R-input (100%) is indicated at the bottom of each lane; no signal was detected for R-MIPs (n.d.). A molecular weight marker (M) is indicated to the left. (b) Agarose gels showing the same set of samples as in (a) to visualize 18S and 28S rRNAs as indicated. Bands corresponding to 18S and 28S rRNAs were quantified with ImageJ, and the averaged recovery (%) is indicated below the panel. No signal could be detected for R-MIPs (n.d.). Images of uncropped gels and blots are shown in the Supplementary Fig. S1. (c) RT-PCR for detection of indicated rRNA species. Control reactions without RT (−) are shown next to samples performed with RT (+).
Figure 4
Figure 4
Human R-MIPs can be used to recover ribosome-associated mRNAs from cellular extracts of closely related eukaryotic species. (a) Detection of the indicated mRNAs from the specified species in extracts, MIPs and NIPs. RT-PCR products were visualised on agarose gels shown to the left. LysA is a spiked-in control used for normalisation. Images of uncropped gels and blots are shown in the Supplementary Fig. S1. The chart to the right shows relative recovery of indicated mRNAs with MIPs or NIPs as compared to the input extract (100%). RNA was quantified by RT-qPCR with the ΔΔCt method and normalised to LysA (see Methods). Standard error of means (SEM) are shown as bars; H. sapiens, n = 5, Luc reporter (pGL3) in HeLa cells; C. aethiops, n = 6, GFP reporter in VK219 cells; M. musculus, n = 5, endogenous eEF2 mRNA in C8-D1A cells; S. cerevisiae, n = 3, actin mRNA in yeast. *P < 0.05, two-tailed homoscedastic student’s t-test. (b) Imprinting factor (mean  ± SEM) related to specified species ordered according to the evolutionary distance from human. The dotted line marks an IF of 1, indicating no preferential binding to MIP compared to NIP.
Figure 5
Figure 5
Detection of the translational response of an exogenous reporter mRNA in 1,000 human cells with R-MIPs. (a) The absorbance profile at 254 nm across a sucrose gradient is shown at the top, and the positions of the 40S and 60S ribosomal subunits, 80S monosomes, and polysomes are indicated. The black line represents a profile of co-transfected HeLa cells grown in serum-starved conditions (starved); the red line upon stimulation of the cells with serum (refed). The bar chart depicts the distribution of RPS6-GFP (left) and Luc control (right) mRNAs in subpolysomes (fractions 1–4) and polysomes (fractions 5–12) of starved and refed cells. RT-PCR data was normalised to a spiked-control RNA (LysA) added to each fraction prior to RNA isolation to adjust for technical variation during RNA isolation. (b) Bar chart depicting the changes of RPS6-GFP relative to Luc mRNA in refed (R) vs. starved (S) conditions in MIP/NIP eluates and in polysomes. RT-qPCR data was normalised to the respective mRNA levels in cell extracts (input) to adjust for variation in the transcriptome upon treatment of cells (see Methods). The change in polysomes was analysed upon pooling fractions 5–12 from the sucrose gradient shown in a. Error bars represent SEM, n = 3. **P < 0.01, two-tailed homoscedastic student’s t-test.

References

    1. Piccirillo CA, Bjur E, Topisirovic I, Sonenberg N, Larsson O. Translational control of immune responses: from transcripts to translatomes. Nature immunology. 2014;15:503–511. doi: 10.1038/ni.2891. - DOI - PubMed
    1. Truitt ML, Ruggero D. New frontiers in translational control of the cancer genome. Nat Rev Cancer. 2016;16:288–304. doi: 10.1038/nrc.2016.27. - DOI - PMC - PubMed
    1. Klinge S, Voigts-Hoffmann F, Leibundgut M, Ban N. Atomic structures of the eukaryotic ribosome. Trends Biochem Sci. 2012;37:189–198. doi: 10.1016/j.tibs.2012.02.007. - DOI - PubMed
    1. Anger AM, et al. Structures of the human and Drosophila 80S ribosome. Nature. 2013;497:80–85. doi: 10.1038/nature12104. - DOI - PubMed
    1. Petrov AS, et al. Evolution of the ribosome at atomic resolution. Proceedings of the National Academy of Sciences of the United States of America. 2014;111:10251–10256. doi: 10.1073/pnas.1407205111. - DOI - PMC - PubMed

Publication types

LinkOut - more resources