. 2017 Jul 26;7(1):6581.
doi: 10.1038/s41598-017-06646-6.

4-dimensional functional profiling in the convulsant-treated larval zebrafish brain

Affiliations

4-dimensional functional profiling in the convulsant-treated larval zebrafish brain

Matthew J Winter et al. Sci Rep. .

Erratum in

Abstract

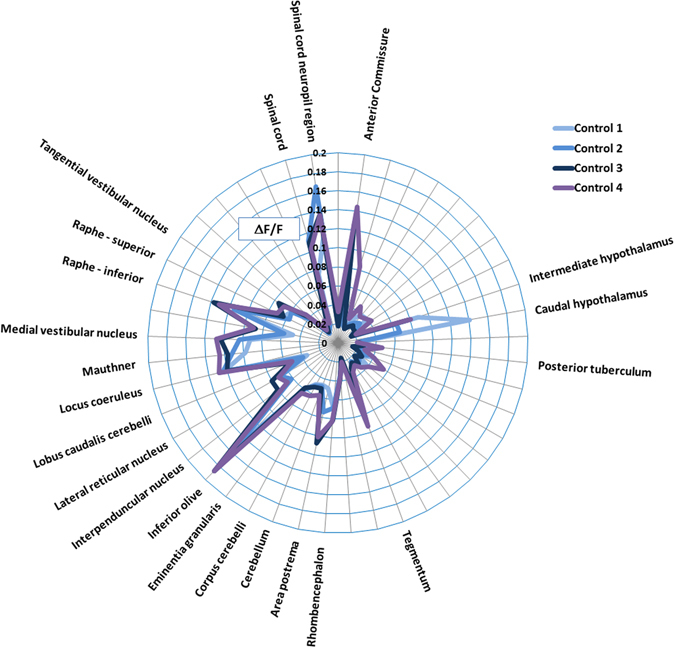
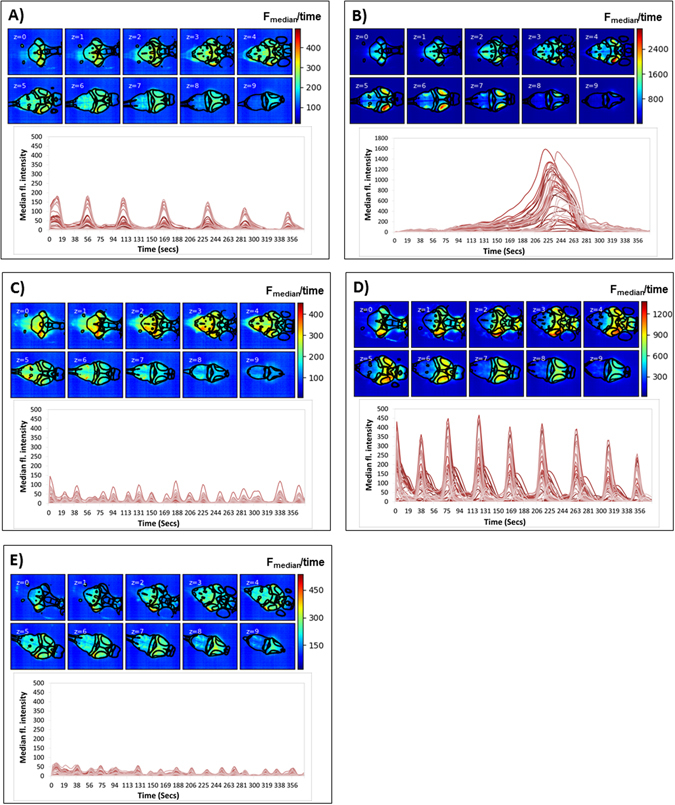
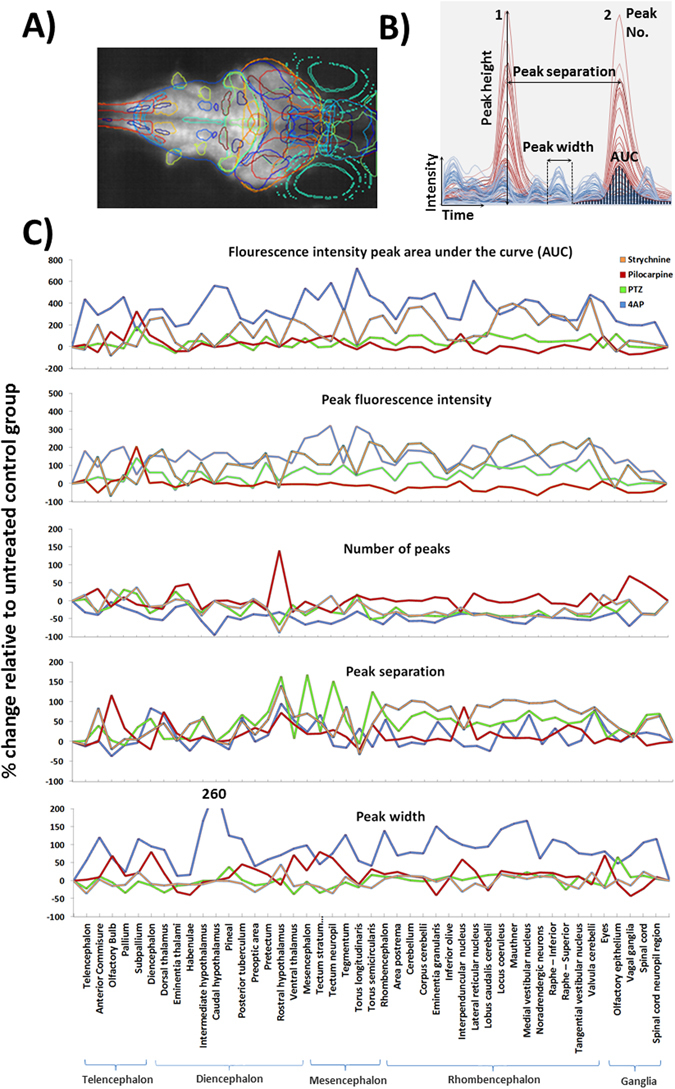
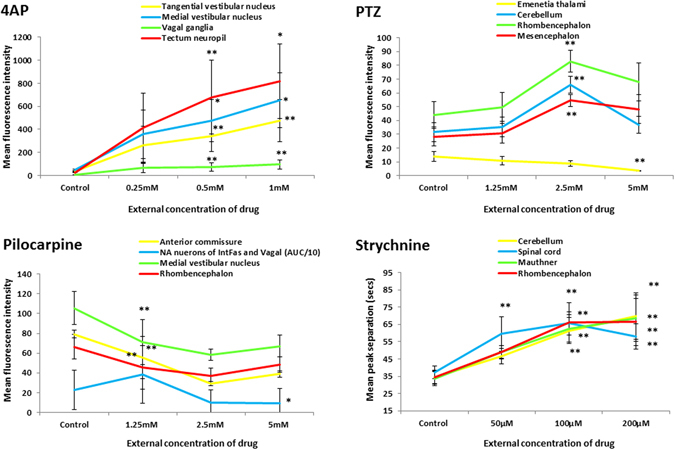
Functional neuroimaging, using genetically-encoded Ca2+ sensors in larval zebrafish, offers a powerful combination of high spatiotemporal resolution and higher vertebrate relevance for quantitative neuropharmacological profiling. Here we use zebrafish larvae with pan-neuronal expression of GCaMP6s, combined with light sheet microscopy and a novel image processing pipeline, for the 4D profiling of chemoconvulsant action in multiple brain regions. In untreated larvae, regions associated with autonomic functionality, sensory processing and stress-responsiveness, consistently exhibited elevated spontaneous activity. The application of drugs targeting different convulsant mechanisms (4-Aminopyridine, Pentylenetetrazole, Pilocarpine and Strychnine) resulted in distinct spatiotemporal patterns of activity. These activity patterns showed some interesting parallels with what is known of the distribution of their respective molecular targets, but crucially also revealed system-wide neural circuit responses to stimulation or suppression. Drug concentration-response curves of neural activity were identified in a number of anatomically-defined zebrafish brain regions, and in vivo larval electrophysiology, also conducted in 4dpf larvae, provided additional measures of neural activity. Our quantification of network-wide chemoconvulsant drug activity in the whole zebrafish brain illustrates the power of this approach for neuropharmacological profiling in applications ranging from accelerating studies of drug safety and efficacy, to identifying pharmacologically-altered networks in zebrafish models of human neurological disorders.


Conflict of interest statement

S.F.O and W.S.R. are employees of AstraZeneca P.L.C. and W.S.R. and M.J.H. are shareholders of AstraZeneca P.L.C. The authors declare no other competing interests.

Figures

Figure 1
Figure 1
Schematic of the basic experimental process used to obtain 4D whole brain neural activity data from drug treated larval elavl3:GCaMP6s zebrafish (A) Larvae are cultured to 4 days post fertilisation (dpf), exposed to each drug, and neuromuscular blocker and embedded in agarose in a capillary tube; (B) larvae are then imaged on the LSM to capture the whole brain volume; (C) Resultant images are processed using a custom Python script in which 3D anatomical registration against a standard brain allows identification of regions of interest (ROIs); (D) fluorescence intensity data are summarised for ROI and automated peak analysis performed on the resultant temporal profiles (example plots that are automatically output are shown for illustrative purposes).
Figure 2
Figure 2
Summary of the control fish data across 4 experiments. Data are shown as the average of ΔF/F ( = (F1 − F0)/F0*100, where F1 = peak fluorescence intensity, and F0 = baseline fluorescence intensity) of the fish within each control group. Only those regions showing activity greater than the median of all areas (>0.0386) are labelled. Note the consistency in brain regions showing measurable baseline activity. In particular, activity was most pronounced in the anterior commissure, hypothalamus, tegmentum, rhombencephalon, inferior olive, locus coeruleus, mauthner cells, medial vestibular nucleus, superior and inferior raphe and spinal cord neuropil region.
Figure 3
Figure 3
Example larvae exposed to each of the 4 neuroactive drugs plus an untreated control. Images are median intensity projections across time, for each z-plane (0–9 ventral to dorsal surface) and the corresponding temporal profile with each line representing the median intensity of the voxels within each of the 45 3D-registered anatomical regions. Each panel represents an example larva treated with: (A) PTZ, (B) 4-AP, (C) Pilocarpine (D) Strychnine and (E) untreated control. Superimposed on each image are outlines of the regions registered within that z-plane. From each montage, one can clearly see differences in the GCaMP fluorescence intensity within specific brain regions, and the different characteristics of the temporal profiles generated within these regions of interest. Accompanying colour scales show the fluorescence intensity range for each montage as the median fluorescence intensity value averaged over the experimental duration.
Figure 4
Figure 4
Summary of the voxel GCaMP6s fluorescence intensity obtained per anatomical region for each of the model chemoconvulsant compounds applied. Data are expressed as the time-averaged median fluorescence intensity values, averaged across all fish in that treatment group, expressed the % change versus the corresponding control fish group (second left column presented for brevity as the mean across the 4 control groups): ΔF/F = (F1 − F0)/F0*100 (where F1 = treated group fluorescence intensity, F0 = control group fluorescence intensity). Colour coding represents the degree of activation (shades of red), or suppression (shades of blue) versus that region in the control larvae, relative to other brain regions within that treatment group. The treatment group shown is that at which the highest activity was observed, which was the top concentration for 4AP, pilocarpine and strychnine, but 2.5 mM (the second highest) for PTZ due to a slight dip in neural activity at the highest treatment level. Colour coding in the left most column represents anatomical categorisation as subdivisions of the telencephalon, diencephalon, mesencephalon and rhombencephalon, along with ganglia (green) respectively from top to bottom. n/a – values not obtained due to a failure in registration probably due to the high z-depth of this region. N = 8 larvae were imaged per group. For corresponding SEM values, see Supplementary Table 3.
Figure 5
Figure 5
Results of the profile peak analysis. (A) Maximum intensity projection through a larva with overlays showing the positions of the 45 registered anatomical regions. (B) The various peak analysis parameters automatically quantified for each registered anatomical region, within each fish, are defined in panel B. For illustrative purposes only partial example profiles for a PTZ-exposed (red) and control fish (blue) are shown and the various parameters highlighted on these traces. (C) Peak profile analysis data for each region across treatments. The treatment group shown is that at which the highest activity was observed (Top concentrations for 4AP, pilocarpine and strychnine, and 2.5 mM for PTZ due to a slight dip in neural activity at the highest treatment level) Each data point is the mean across all fish/treatment group expressed as the % change versus the mean of the corresponding control group (F1 − F0)/F0*100, where F1 = treated group value, and F0 = control group value. Note that for the AUC and the peak height profiles, 4AP data were divided by 10 to allow plotting on the same axis. Data also summarised in Supplementary Figure 5.
Figure 6
Figure 6
Example concentration response curves generated for selected brain regions of interest in fish exposed to each of the 4 drugs. To provide representative curves, all data shown are those derived from measurements of mean peak fluorescence intensity across all larvae within that treatment group, except pilocarpine noradrendergic (NA) neurons of the interfascicular and vagal areas for which the AUC is presented (divided by 10 to allow plotting on the same axis) and all of the strychnine data (peak separation data shown). Data are shown as the average of the median fluorescence intensity measures obtained for each fish in that treatment group, ±SEM (n = 7–8). All statistical analyses were undertaken using a Kruskal Wallis analysis across treatment groups, followed by a Dunn’s post-hoc test in which each drug-treated group was compared with the corresponding control group. *Denotes significance at the p < 0.05, and ** at the P < 0.01 level in order of lines on graph. Strychnine significance levels are shown below each point in order of the legend. For full concentration-response datasets please see Supplementary Table 5.
Figure 7
Figure 7
Summary of the electrophysiology data obtained after exposure to the 4 drugs. Panel (A) Experimental trace and supporting spectrogram of basal waveform activity recorded from the optic tectum of untreated control zebrafish larvae. (B) The baseline normalised frequency and power of neuronal network events in untreated control larvae does not change over the time course of the experiment (n = 6 zebrafish). (C) Representative traces obtained from larvae exposed to the 4 exemplar neuroactive drugs and below each trace, graphs showing control versus treated fish neural event frequency and power. In each case, data are shown as the Mean ± SEM (n = 3 larvae, except pilocarpine = 2). Baseline and post-treatment traces were compared using paired Student’s t-test from which * denotes a significant difference at the P < 0.05 level.

References

    1. Chen TW, et al. Ultrasensitive fluorescent proteins for imaging neuronal activity. Nature. 2013;499:295–300. doi: 10.1038/nature12354. - DOI - PMC - PubMed
    1. Akerboom J, et al. Optimization of a GCaMP calcium indicator for neural activity imaging. J. Neurosci. 2012;32:13819–13840. doi: 10.1523/JNEUROSCI.2601-12.2012. - DOI - PMC - PubMed
    1. Grienberger C, Konnerth A. Imaging calcium in neurons. Neuron. 2012;73:862–885. doi: 10.1016/j.neuron.2012.02.011. - DOI - PubMed
    1. Arrenberg AB, Driever W. Integrating anatomy and function for zebrafish circuit analysis. Front. Neural Circuits. 2013;7:74. doi: 10.3389/fncir.2013.00074. - DOI - PMC - PubMed
    1. Muto A, et al. Genetic visualization with an improved GCaMP calcium indicator reveals spatiotemporal activation of the spinal motor neurons in zebrafish. Proc. Natl. Acad. Sci. USA. 2011;108:5425–5430. doi: 10.1073/pnas.1000887108. - DOI - PMC - PubMed

Publication types

LinkOut - more resources