. 2017 Jul 12:5:64.
doi: 10.3389/fcell.2017.00064. eCollection 2017.

Mycobacteria Modify Their Cell Size Control under Sub-Optimal Carbon Sources

Affiliations

Mycobacteria Modify Their Cell Size Control under Sub-Optimal Carbon Sources

Miles Priestman et al. Front Cell Dev Biol. .

Abstract

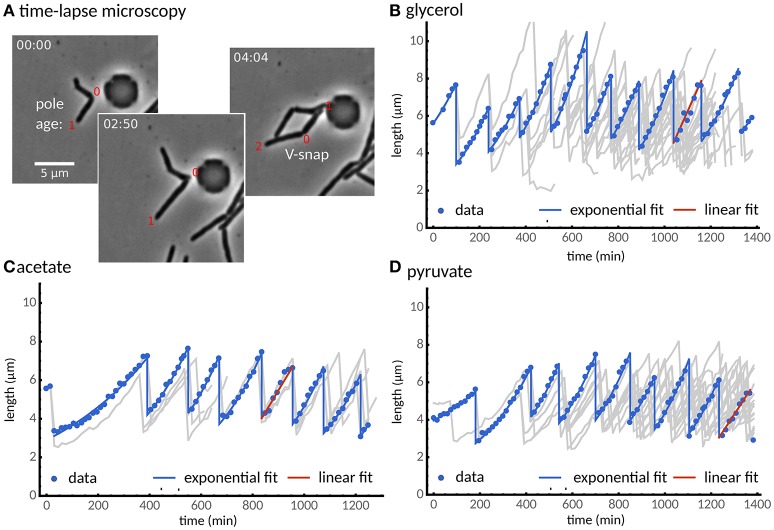
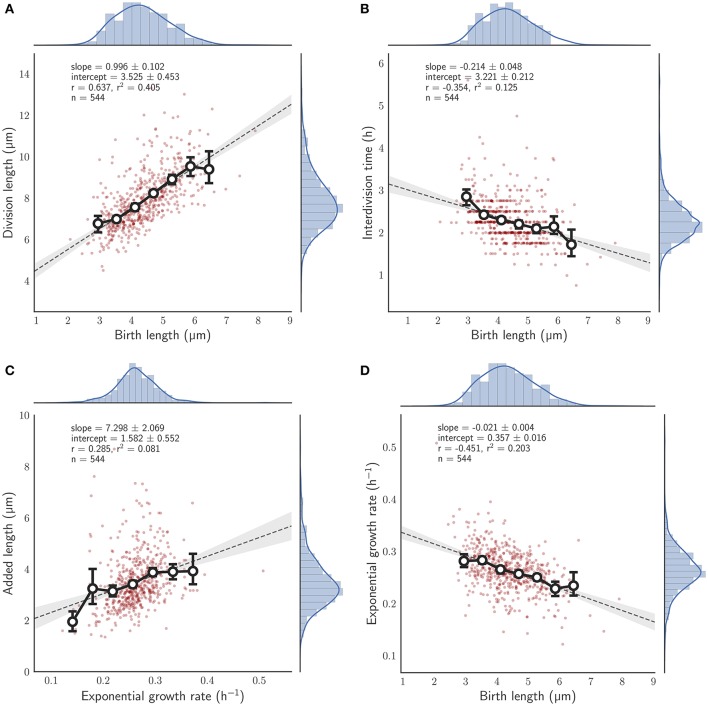
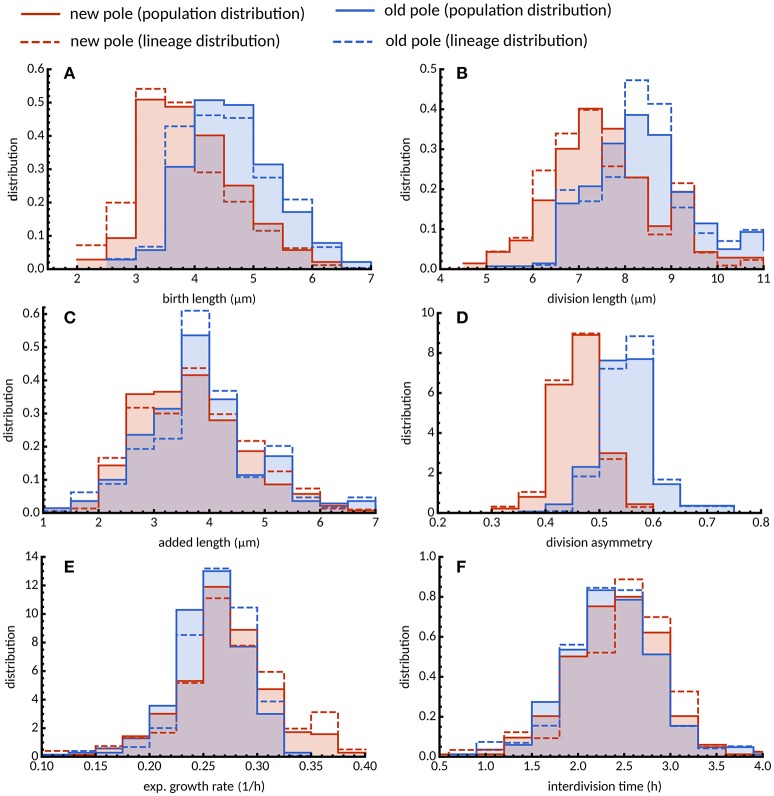
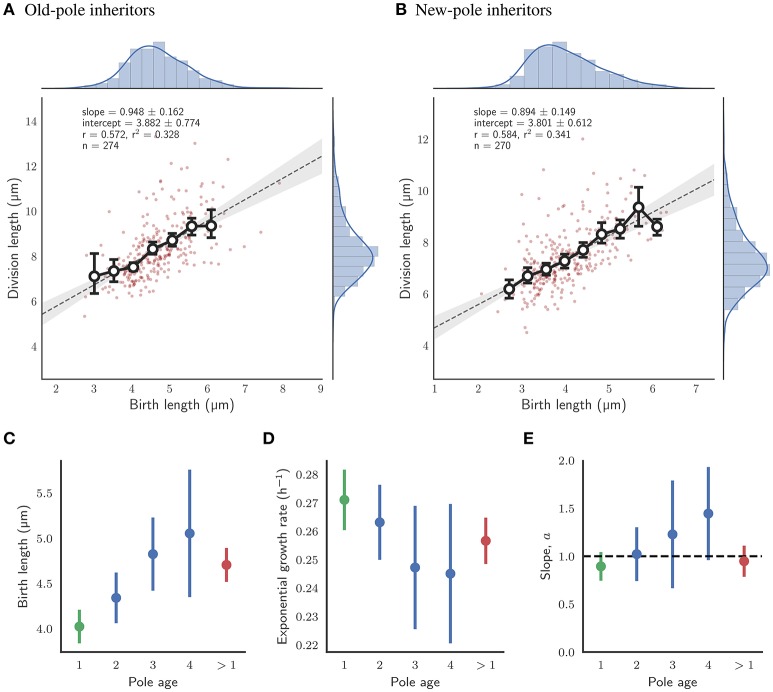
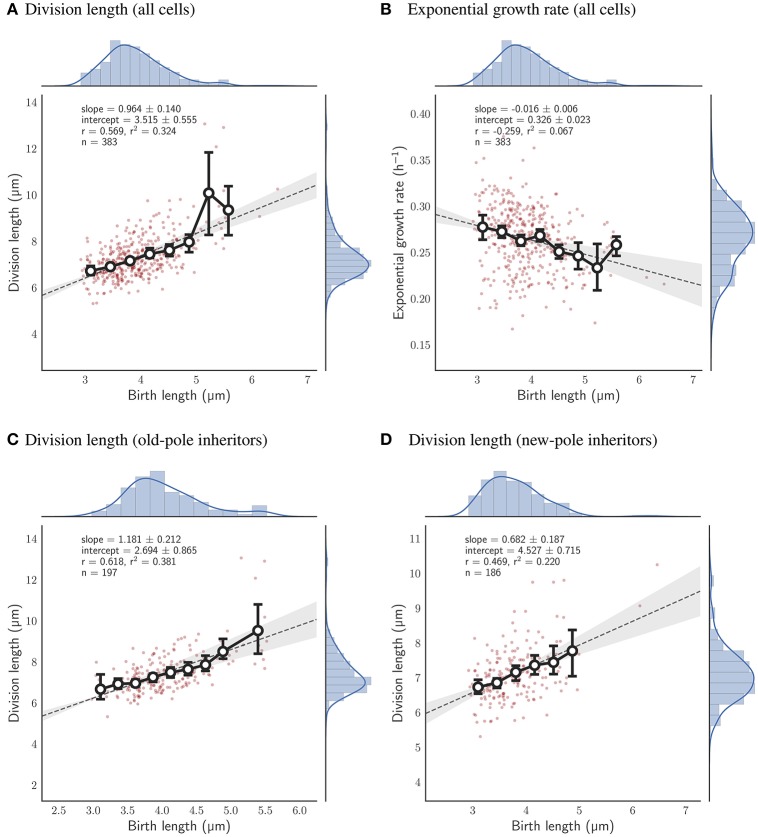
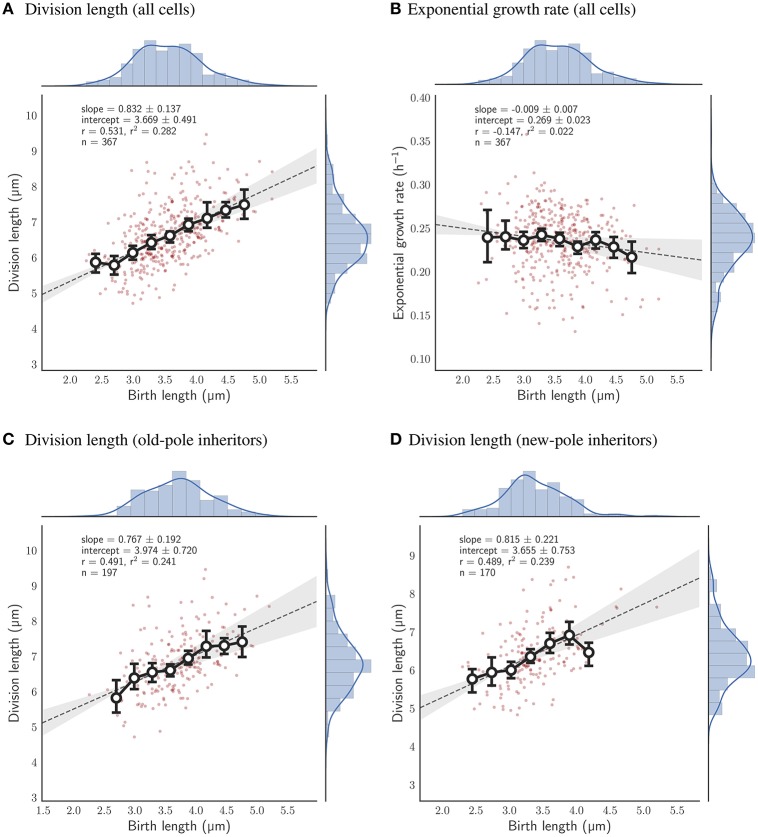
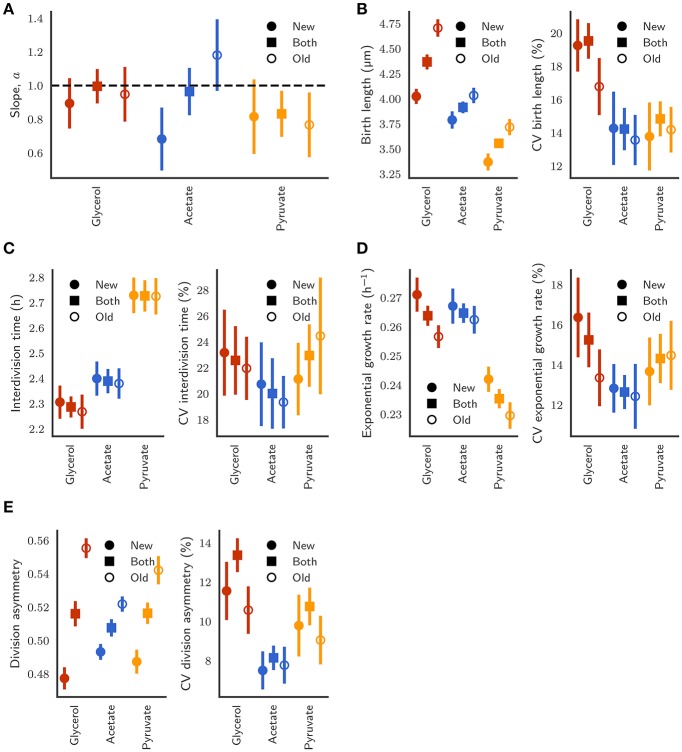
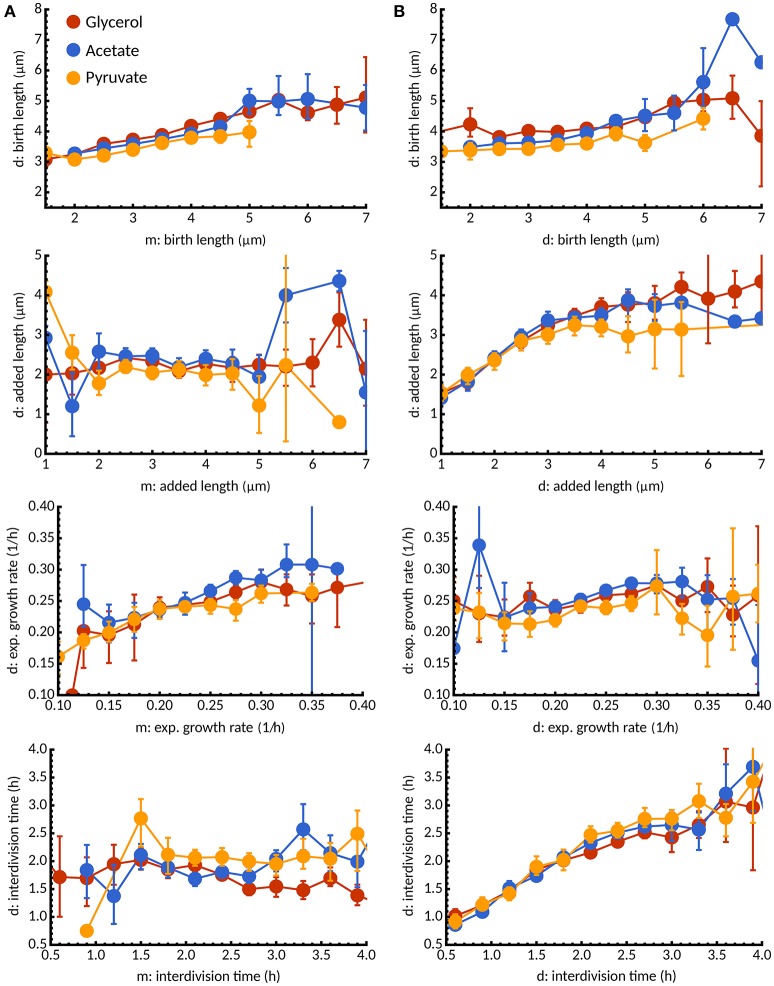
The decision to divide is the most important one that any cell must make. Recent single cell studies suggest that most bacteria follow an "adder" model of cell size control, incorporating a fixed amount of cell wall material before dividing. Mycobacteria, including the causative agent of tuberculosis Mycobacterium tuberculosis, are known to divide asymmetrically resulting in heterogeneity in growth rate, doubling time, and other growth characteristics in daughter cells. The interplay between asymmetric cell division and adder size control has not been extensively investigated. Moreover, the impact of changes in the environment on growth rate and cell size control have not been addressed for mycobacteria. Here, we utilize time-lapse microscopy coupled with microfluidics to track live Mycobacterium smegmatis cells as they grow and divide over multiple generations, under a variety of growth conditions. We demonstrate that, under optimal conditions, M. smegmatis cells robustly follow the adder principle, with constant added length per generation independent of birth size, growth rate, and inherited pole age. However, the nature of the carbon source induces deviations from the adder model in a manner that is dependent on pole age. Understanding how mycobacteria maintain cell size homoeostasis may provide crucial targets for the development of drugs for the treatment of tuberculosis, which remains a leading cause of global mortality.

Keywords: adder; asymmetric cell division; cell size control; mycobacteria; sizer.


Figures

Figure 1
Figure 1
Single cells grow exponentially under different carbon sources. (A) Time-lapse microscopy shows single cells grown with a glycerol carbon source observed from cell birth to division determined by the V-snap (from left to right). (B) Cell length vs. time for one of the longest lineage of the experiments (points). The lineage tree arising from all recorded cell divisions is shown in gray. (C,D) Two alternative carbon sources, (C) acetate and (D) pyruvate, are considered. Under all three carbon sources, most cells (about 90%) grow exponentially (blue lines), while some cells were better described by a linear growth model (red line). We observed that cells adapted to the experimental conditions after about two divisions.
Figure 2
Figure 2
Relationship between birth length and other single cell measures for single M. smegmatis cells grown with glycerol as a sole carbon source. Red circles, single cell measurements; histograms, distribution of individual cells, with kernel density estimates depicted as a blue line; solid line with white filled circles, mean of birth length bins with error bars denoting the 95% confidence interval of the estimate determined by bootstrapping; gray dotted line, the least squares linear regression fit of unbinned data; Key, slope—the slope of the regression line (± the 95% confidence interval), intercept—the y-intercept, r—the Pearson correlation coefficient, n—the total number of cells measured, (A) Division length is plotted against birth length. (B) Interdivision time against birth length. (C) Added length against exponential growth rate. (D) Exponential growth rate against birth length.
Figure 3
Figure 3
Distribution of growth parameters for new- and old-pole cells grown in glycerol. Histograms of (A) birth length, (B) division length, (C) added length, (D) division asymmetry, (E) exponential growth rate, and (F) interdivision time are shown for new (red) and old pole cells (blue). Population average distributions taken over every single cell in the experiment (solid lines) are qualitatively similar compared to lineage-weighted distributions (dashed lines).
Figure 4
Figure 4
Impact of pole age on the growth of single cells with glycerol as a sole carbon source. (A) Fit of division length against birth length for daughter cells which inherit the old-pole from their mother cell. Colors and legends as for Figure 2. (B) Fit of division length against birth length for daughter cells which inherit the new-pole from their mother cell. Colors and legends as for Figure 2. (C) Mean birth length for cells by age of the inherited pole in number of generations. (D) Mean exponential growth rate by age of the inherited pole. (E) Slope of the linear fit of birth length against division length for cells by age of the inherited pole. The black dashed line represents the case where cells act as perfect adders (a = 1). (C–E) The error bars depict the 95% confidence intervals of each estimate. n-values were 99, 39, and 21 in order of generation number for old-pole cells with known age (shown in blue). Data for all new-pole inheritors (with an age of 1 generation; n = 270), and for all old-pole inheritors (with an age of more than 1 generation, including those without a precise age; n = 272) are shown in green and red respectively.
Figure 5
Figure 5
Relationship between birth length and division length or exponential growth rate for cells grown with acetate as a sole carbon source. Colors and legends as for Figure 2. (A) Relationship between birth length and division length for all cell divisions. (B) Relationship between birth length and exponential growth rate for all cell divisions. (C) Relationship between birth length and division length for cells which inherit the old-pole from their mother cell. (D) Relationship between birth length and division length for cells which inherit the new-pole from their mother cell.
Figure 6
Figure 6
Relationship between birth length and division length or exponential growth rate for cells grown with pyruvate as a sole carbon source. Colors and legends as for Figure 2. (A) Relationship between birth length and division length for all cell divisions. (B) Relationship between birth length and exponential growth rate for all cell divisions. (C) Relationship between birth length and division length for cells which inherit the old-pole from their mother cell. (D) Relationship between birth length and division length for cells which inherit the new-pole from their mother cell.
Figure 7
Figure 7
(A) Comparison of the slope of the linear relationship between initial length and final length between new-pole (closed circles), old-pole (open circles), and both pole (closed squares) daughter cells. Error bars depict bootstrapped 95% confidence intervals. (B) Birth length and coefficient of variation (CV) of the distributions. (C) Interdivision time and CV. (D) Exponential growth rate and CV. (E) Division asymmetry and CV, where asymmetry is defined as the ratio of birth length to the sum of birth lengths of both siblings.
Figure 8
Figure 8
Inheritance of growth parameters under different carbon sources. (A) Conditional expectation of birth length, added length, exponential growth rate, and interdivision time for daughter cells (d) as a function of the corresponding growth parameter in the mother cell (m). Colors indicate different carbon sources: glycerol (red), acetate (blue), pyruvate (yellow). For all media, we observe a statistical dependence between birth lengths in mother and daughter cells consistent with the adder principle but no inheritance between added lengths. Interestingly, growth rate is inherited but not interdivision time. (B) In contrast, between sister cells added length and interdivision times are statistically dependent but not growth rate and interdivision times.

References

    1. Aldridge B. B., Fernandez-Suarez M., Heller D., Ambravaneswaran V., Irimia D., Toner M., et al. (2012). Asymmetry and aging of mycobacterial cells lead to variable growth and antibiotic susceptibility. Science 335, 100–104. 10.1126/science.1216166 - DOI - PMC - PubMed
    1. Amir A. (2014). Cell size regulation in bacteria. Phys. Rev. Lett. 112:208102 10.1103/physrevlett.112.208102 - DOI
    1. Bertaux F., Von Kügelgen J., Marguerat S., Shahrezaei V. (2016). A unified coarse-grained theory of bacterial physiology explains the relationship between cell size, growth rate and proteome composition under various growth limitations. bioRxiv 078998. 10.1101/078998 - DOI
    1. Campos M., Surovtsev I. V., Kato S., Paintdakhi A., Beltran B., Ebmeier S. E., et al. (2014). A constant size extension drives bacterial cell size homeostasis. Cell 159, 1433–1446. 10.1016/j.cell.2014.11.022 - DOI - PMC - PubMed
    1. Chien A.-C., Hill N. S., Levin P. A. (2012). Cell size control in bacteria. Curr. Biol. 22, R340–R349. 10.1016/j.cub.2012.02.032 - DOI - PMC - PubMed