

Genome-wide Association Study of Susceptibility to Particulate Matter-Associated QT Prolongation
- PMID: 28749367
- PMCID: PMC5714283
- DOI: 10.1289/EHP347
Genome-wide Association Study of Susceptibility to Particulate Matter-Associated QT Prolongation
Erratum in
-
Erratum: "Genome-wide Association Study of Susceptibility to Particulate Matter-Associated QT Prolongation".Environ Health Perspect. 2017 Aug 24;125(8):089001. doi: 10.1289/EHP2393. Environ Health Perspect. 2017. PMID: 28858825 Free PMC article.
Abstract
Background: Ambient particulate matter (PM) air pollution exposure has been associated with increases in QT interval duration (QT). However, innate susceptibility to PM-associated QT prolongation has not been characterized.
Objective: To characterize genetic susceptibility to PM-associated QT prolongation in a multi-racial/ethnic, genome-wide association study (GWAS).
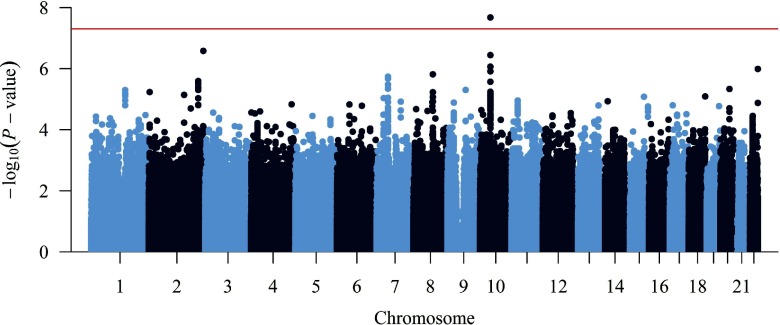
Methods: Using repeated electrocardiograms (1986–2004), longitudinal data on PM<10 μm in diameter (PM10), and generalized estimating equations methods adapted for low-prevalence exposure, we estimated approximately 2.5×10⁶ SNP×PM10 interactions among nine Women’s Health Initiative clinical trials and Atherosclerosis Risk in Communities Study subpopulations (n=22,158), then combined subpopulation-specific results in a fixed-effects, inverse variance-weighted meta-analysis.
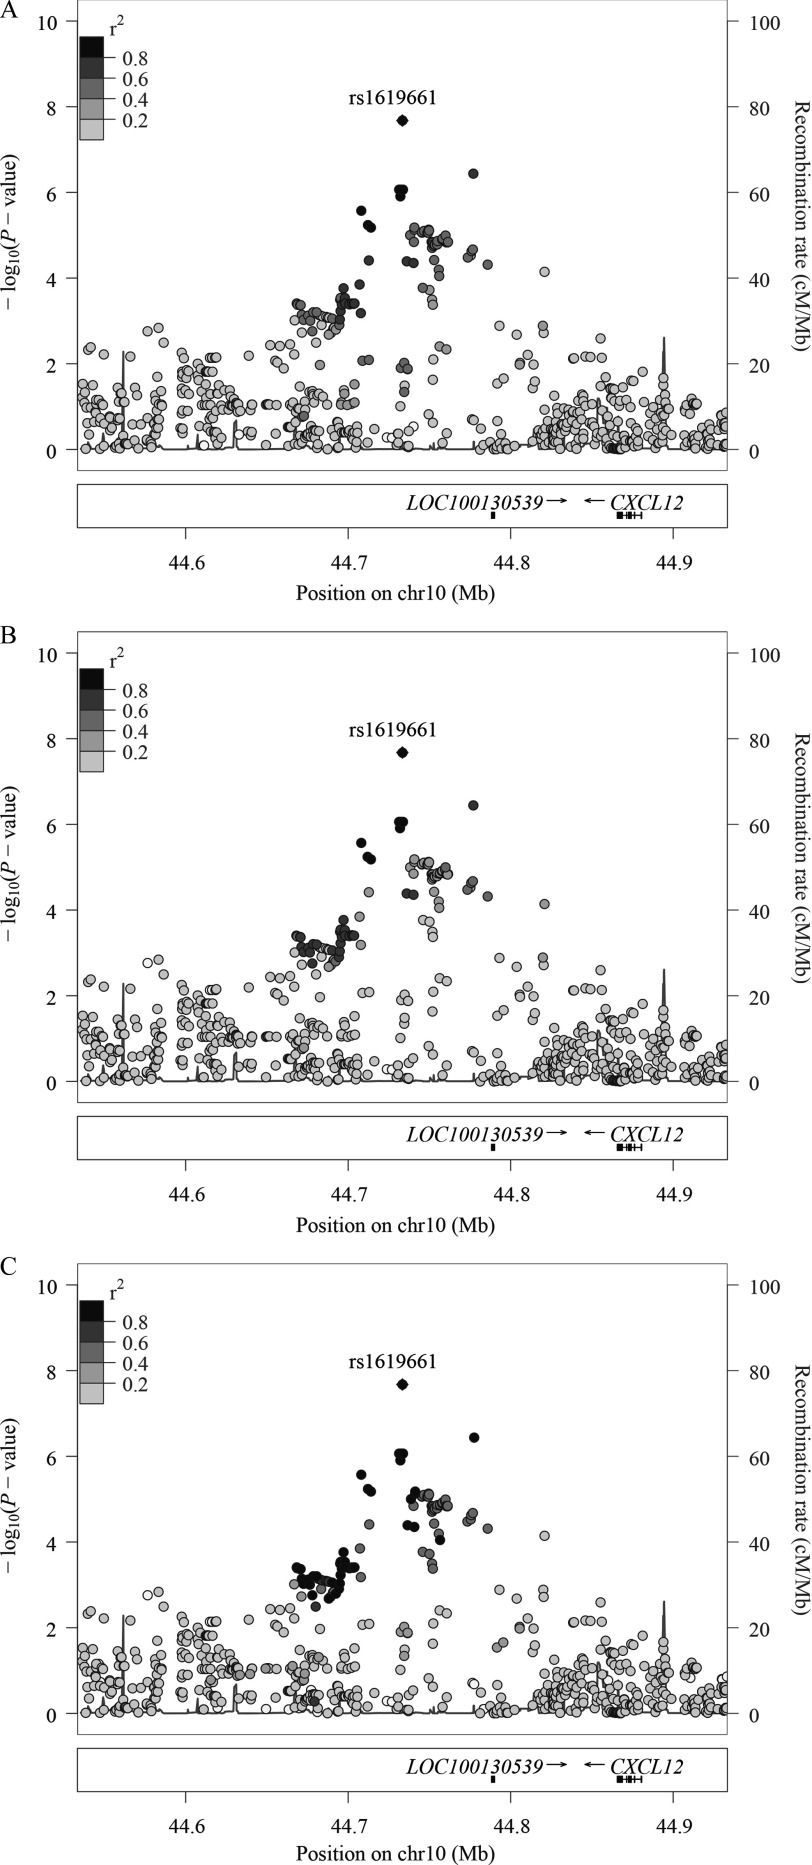
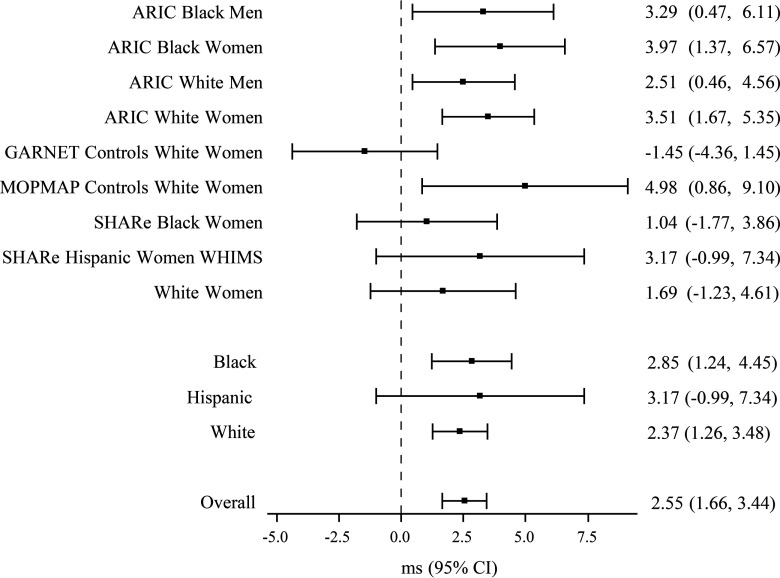
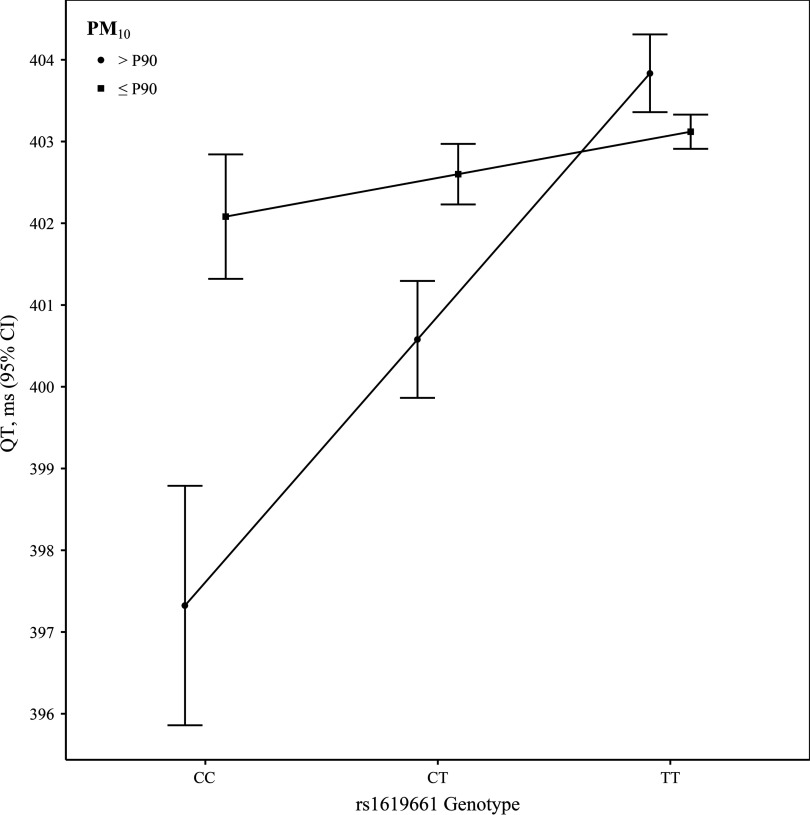
Results: A common variant (rs1619661; coded allele: T) significantly modified the QT-PM10 association (p=2.11×10⁻⁸). At PM10 concentrations >90th percentile, QT increased 7 ms across the CC and TT genotypes: 397 (95% confidence interval: 396, 399) to 404 (403, 404) ms. However, QT changed minimally across rs1619661 genotypes at lower PM10 concentrations. The rs1619661 variant is on chromosome 10, 132 kilobase (kb) downstream from <em>CXCL12</em>, which encodes a chemokine, stromal cell-derived factor 1, that is expressed in cardiomyocytes and decreases calcium influx across the L-type Ca2+ channel.
Conclusions: The findings suggest that biologically plausible genetic factors may alter susceptibility to PM10-associated QT prolongation in populations protected by the U.S. Environmental Protection Agency’s National Ambient Air Quality Standards. Independent replication and functional characterization are necessary to validate our findings. https://doi.org/10.1289/EHP347
Figures
References
-
- ARIC Investigators. 1987. Atherosclerosis Risk in Communities (ARIC) Operations Manual 5. Electrocardiography. Version 1.0. Chapel Hill, NC: ARIC Coordinating Center, School of Public Health, University of North Carolina.
Publication types
MeSH terms
Substances
Grants and funding
- HHSN268201100012C/HL/NHLBI NIH HHS/United States
- P30 ES010126/ES/NIEHS NIH HHS/United States
- HHSN268201100010C/HL/NHLBI NIH HHS/United States
- HHSN268201100007C/HL/NHLBI NIH HHS/United States
- HHSN268201100003C/WH/WHI NIH HHS/United States
- HHSN268201100006C/HL/NHLBI NIH HHS/United States
- HHSN268201100002C/WH/WHI NIH HHS/United States
- U01 HG005157/HG/NHGRI NIH HHS/United States
- HHSN268201100002I/HL/NHLBI NIH HHS/United States
- R01 HL087641/HL/NHLBI NIH HHS/United States
- HHSN268201100001C/WH/WHI NIH HHS/United States
- HHSN268201100004C/WH/WHI NIH HHS/United States
- HHSN268201100001I/HL/NHLBI NIH HHS/United States
- HHSN268201100009I/HL/NHLBI NIH HHS/United States
- UL1 RR025005/RR/NCRR NIH HHS/United States
- HHSN268201100008C/HL/NHLBI NIH HHS/United States
- N02 HL064278/HL/NHLBI NIH HHS/United States
- HHSN268201100005G/HL/NHLBI NIH HHS/United States
- HHSN268201100004I/HL/NHLBI NIH HHS/United States
- HHSN268201100008I/HL/NHLBI NIH HHS/United States
- R01 HL059367/HL/NHLBI NIH HHS/United States
- R01 ES017794/ES/NIEHS NIH HHS/United States
- HHSN268201100046C/HL/NHLBI NIH HHS/United States
- HHSN268201100011I/HL/NHLBI NIH HHS/United States
- HHSN268201100011C/HL/NHLBI NIH HHS/United States
- R01 HL086694/HL/NHLBI NIH HHS/United States
- U01 HG004402/HG/NHGRI NIH HHS/United States
- U01 HG004424/HG/NHGRI NIH HHS/United States
- HHSN268201100005I/HL/NHLBI NIH HHS/United States
- HHSN271201100004C/AG/NIA NIH HHS/United States
- HHSN268201100009C/HL/NHLBI NIH HHS/United States
- HHSN268201100005C/HL/NHLBI NIH HHS/United States
- HHSN268201100007I/HL/NHLBI NIH HHS/United States
- HHSN268201100003I/HL/NHLBI NIH HHS/United States
- U01 HG005152/HG/NHGRI NIH HHS/United States
- T32 HL007055/HL/NHLBI NIH HHS/United States
LinkOut - more resources
Full Text Sources
Other Literature Sources
Medical
Miscellaneous