Comparative Study
. 2017 Jul 27;15(7):e2001867.
doi: 10.1371/journal.pbio.2001867. eCollection 2017 Jul.

Integrated time-lapse and single-cell transcription studies highlight the variable and dynamic nature of human hematopoietic cell fate commitment

Affiliations
Comparative Study

Integrated time-lapse and single-cell transcription studies highlight the variable and dynamic nature of human hematopoietic cell fate commitment

Alice Moussy et al. PLoS Biol. .

Abstract

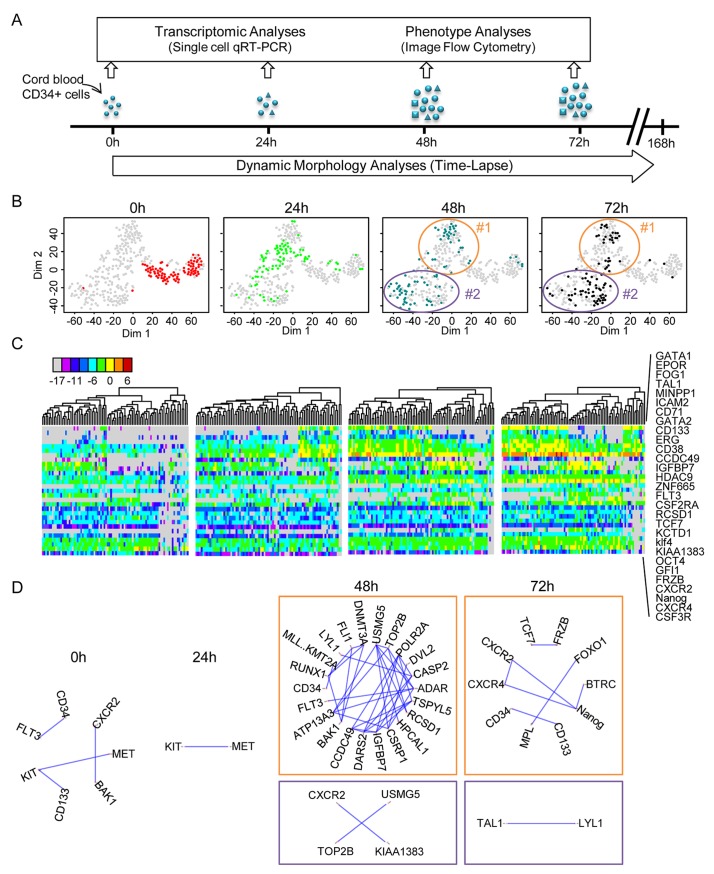
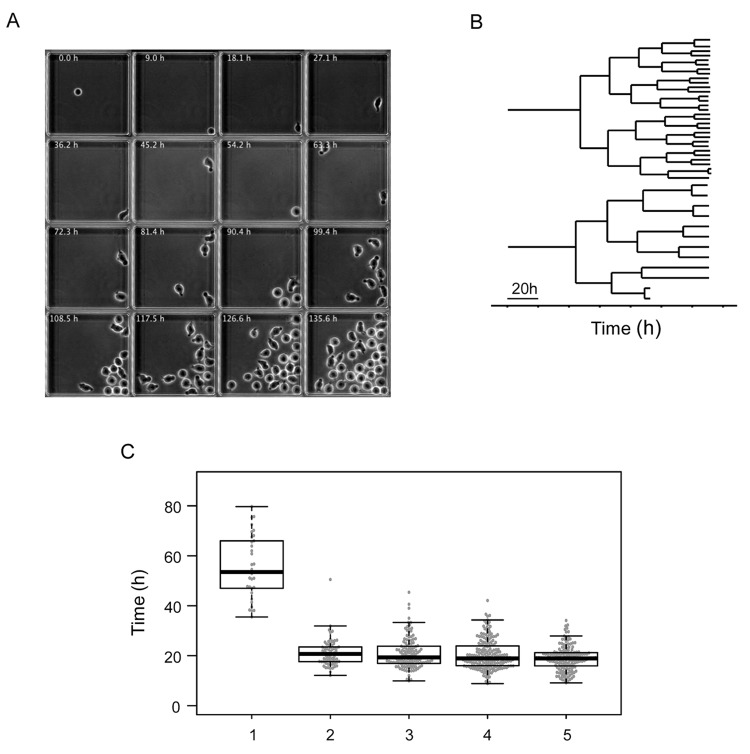
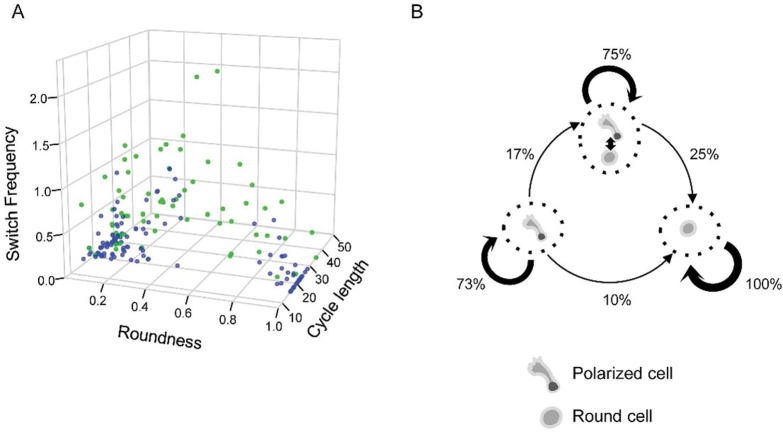
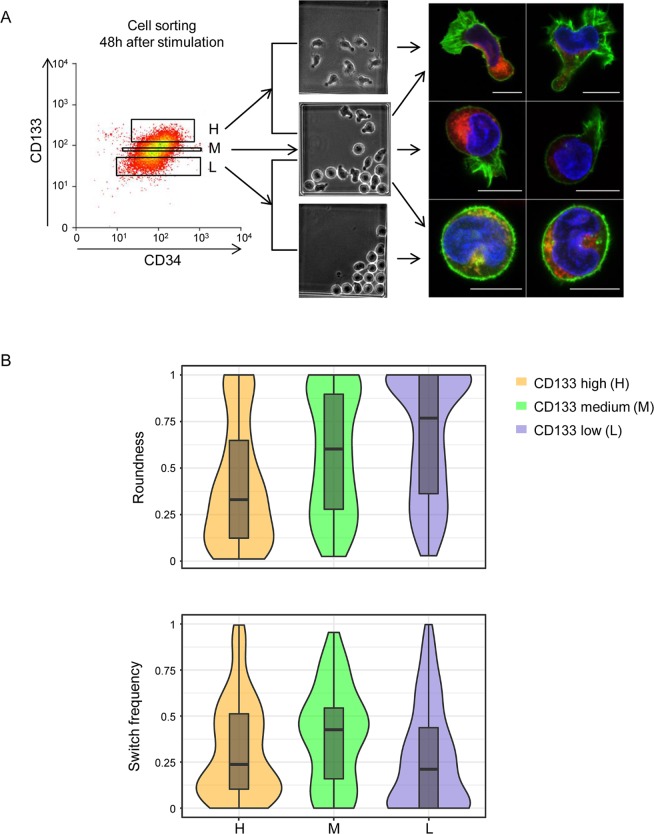
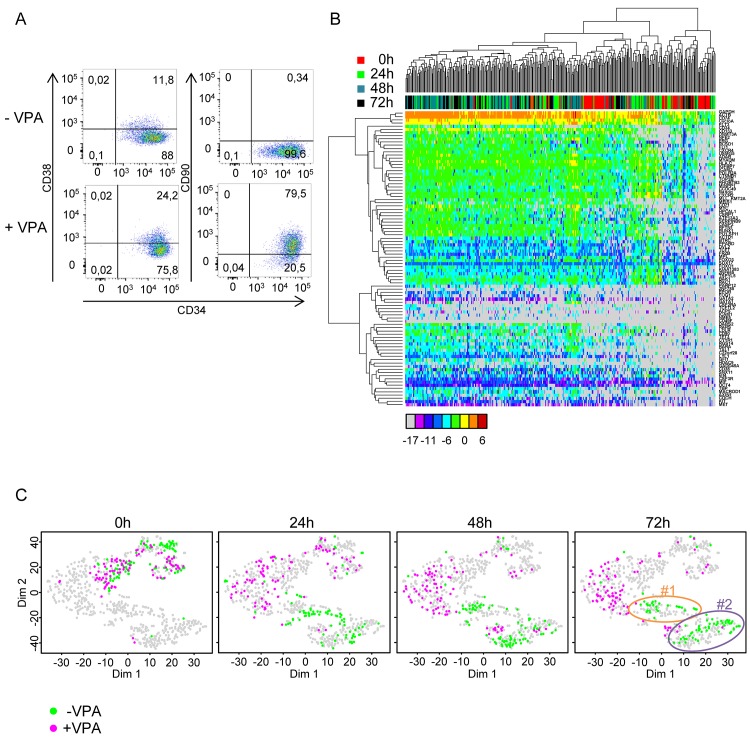
Individual cells take lineage commitment decisions in a way that is not necessarily uniform. We address this issue by characterising transcriptional changes in cord blood-derived CD34+ cells at the single-cell level and integrating data with cell division history and morphological changes determined by time-lapse microscopy. We show that major transcriptional changes leading to a multilineage-primed gene expression state occur very rapidly during the first cell cycle. One of the 2 stable lineage-primed patterns emerges gradually in each cell with variable timing. Some cells reach a stable morphology and molecular phenotype by the end of the first cell cycle and transmit it clonally. Others fluctuate between the 2 phenotypes over several cell cycles. Our analysis highlights the dynamic nature and variable timing of cell fate commitment in hematopoietic cells, links the gene expression pattern to cell morphology, and identifies a new category of cells with fluctuating phenotypic characteristics, demonstrating the complexity of the fate decision process (which is different from a simple binary switch between 2 options, as it is usually envisioned).


Conflict of interest statement

The authors have declared that no competing interests exist.

Figures

Fig 1
Fig 1. Transcriptional profile of cord blood-derived CD34+ cells at t = 0 h, t = 24 h, t = 48 h, and t = 72 h after the beginning of the experiment.
(A) CD34+ cells were isolated from human cord blood and cultured in serum-free medium with early acting cytokines. Single-cell quantitative reverse transcription polymerase chain reaction (qRT-PCR) was used to analyse single-cell transcription at 0 h, 24 h, 48 h and 72 h. At the same time, individual clones were continuously monitored using time-lapse microscopy. (B) t-distributed stochastic neighbour embedding (t-SNE) map of single-cell transcription data. The 4 panels show analysis of the same data set, with each point representing a single cell highlighted in different colours depending on the given time point. The 2 clusters identified by gap statistics at t = 48 h and t = 72 h are surrounded by an ellipse and numbered #1 and #2 for multipotent and common myeloid progenitor (CMP)-like cells. Note the rapid evolution of the expression profiles. (Underlying data can be found in S1 Data.) (C) A heat map representation of the expression levels of a subset of genes that strongly contributed to the differentiation of the different groups (as detected by principal component analysis [PCA]; see S2 Fig) and cluster analysis of expression profiles at the different time points show the rapid evolution of gene expression. The list of the genes used (shown on the right) includes well-known genes acting during hematopoietic differentiation but also many randomly selected genes. The colour code for expression levels is indicated below. (Underlying data can be found in S1 Data.) (D) Pairwise correlations between the genes analysed using single-cell quantitative reverse transcription polymerase chain reaction (qRT-PCR). Only the gene pairs with a Pearson correlation coefficient higher than 0.8 are indicated for each time point. The 2 clusters identified at t = 48 h and t = 72 h are represented separately. Note the transient increase of the average correlation in cluster #2 at t = 48 h, indicating a state transition. (Underlying data can be found in S1 Data.)
Fig 2
Fig 2. Time-lapse tracking of individual clones.
(A) These frames, extracted from a representative time-lapse record, show a microwell containing a single founder cell, which divides to produce a clone. Each individual cell was tracked, and their morphological characteristics were recorded. (B) Two representative lineage pedigrees obtained from the time-lapse record. The strong difference in clone size observed at the end of the record is established gradually after the third cell division. (C) Box plot representation of cell cycle lengths obtained from the time-lapse records of every clone. Note the long first cell cycle. Subsequent cell cycles have comparable lengths, with a slight tendency to become shorter. (Underlying data can be found in S2 Data.)
Fig 3
Fig 3. Quantitative analysis of dynamic phenotypes as determined by time-lapse data.
(A) Association between the morphology, switch frequency, cell cycle length, and the type of cell divisions of second- and third-generation cells. Each point represents a single cell. Siblings with different dynamic behaviour and morphology (in green) are usually characterised by high switch frequencies. Siblings with similar dynamic behaviour and morphologies are shown in blue. The morphology is given as a ratio of time spent in round/polarised shape by a cell during the cell cycle. Switch frequency is given in number of morphological transformations per hour. Cell cycle length is in hours. (B) Dynamic phenotype change during the first 2 cell divisions as determined on the basis of time-lapse records. Three different dynamic phenotypes were identified: stable polarised, frequent switchers, and stable round. Cells tended to transmit dynamic phenotypes to daughter cells during cell division. Polarised and frequent switchers produced round cells, and frequent switchers were always produced by polarised mothers. Phenotypic change is not associated with asymmetric division; it can occur at any time in the cell cycle. Since round cells always produce round daughters, the whole process is biased and the proportion of this phenotype increases. (Underlying data can be found in S2 Data.)
Fig 4
Fig 4. Isolation and time-lapse analysis of ‘high’, ‘medium’, and ‘low’ CD133-expressing expressing cells.
(A) Cell-sorting strategy to isolate cells on the basis of the CD133 surface protein level. The sorted cells were cultured individually and tracked by time-lapse microscopy. They produced cells with a polarised, round, or fluctuating dynamic phenotype (illustrated by the middle panel). Examples of cells with different morphologies are shown on the right, as detected by confocal microscopy. Red: CD133 protein. Green: actin filaments detected by phalloidine. Blue: DNA. Note the preferential localisation of the CD133 protein in the uropods of polarised cells. Actin is concentrated in lammelipodia or evenly distributed in the periphery of round cells. (B) Quantitative evaluation of cell morphology and switch frequency. Distribution of the ‘roundness’ parameter (upper panel) indicates a gradual increase of the proportion of round cells between the ‘high’ and ‘low’ fraction. Distribution of the switch frequency as switch/h of sorted ‘high’, ‘medium’, and ‘low’ CD133 cells is shown in the lower panel. Note that the switch frequency is the highest in ‘medium’ CD133 cells. (Underlying data can be found in S2 Data.)
Fig 5
Fig 5. Single-cell gene expression in ‘high’, ‘medium’, and ‘low’ CD133 cells.
(A) t-stochastic neighbour embedding (t-SNE) map of single-cell transcriptional data. Each point represents a single cell highlighted in a different colour for ‘high’, ‘medium’, and ‘low’ CD133 cells. ‘High’ and ‘low’ cells are in separated clusters corresponding to cluster #1 and #2 in Fig 1B. ‘Medium’ CD133 cells are distributed in and between these 2 clusters, indicating their intermediate character. (B) Scatter plot representation of PU1 and GATA1 expression in individual cells of the ‘high’, ‘medium’, and ‘low’ CD133 fraction. Note that GATA1 is not expressed in ‘high’ cells. Coexpression of the 2 genes is observed only in some ‘medium’ and ‘low’ cells. (Underlying data can be found in S1 Data.)
Fig 6
Fig 6. Transcriptional profile of cord blood-derived CD34+ cells treated with valproic acid (VPA) at t = 0 h, t = 24 h, t = 48 h, and t = 72 h after the beginning of the experiment as compared to untreated, normal control cells.
(A) A cytometric analysis of the effect of VPA on cord blood CD34+ cells shows an increase in the CD90 protein in most cells, while the CD34 and CD38 markers remain essentially unchanged. (B) Heat map representation of the expression levels of 90 genes as determined by single-cell quantitative reverse transcription polymerase chain reaction (qRT-PCR) in VPA-treated cells at t = 0 h, t = 24 h, t = 48 h, and t = 72 h. The colour codes for the time points of cells are indicated on the right; the colour codes for expression levels are indicated below the heat map. Note the high heterogeneity and lack of clear clustering of the expression patterns. (C) t-distributed stochastic neighbour embedding (t-SNE) plot representation of transcription data obtained for VPA-treated cells compared to untreated normal cells (data for these cells are the same as in Fig 1). The gene expression data obtained in the 2 experiments were mapped together. Each point represents a single cell, and the cells at t = 0 h, t = 24 h, t = 48 h, and t = 72 h are highlighted separately in the 4 panels. The colour codes for VPA-treated (+VPA) and VPA-untreated (−VPA) are indicated below the panels. Clusters #1 and #2, identified at t = 48 h and t = 72 h in −VPA cells (see Fig 1), are indicated on the t = 72 h panel. Note the clear separation of the +VPA and −VPA cells at every time point except t = 24 h. Note also that +VPA cells do not contribute to clusters #1 and #2, indicating that they do not acquire expression profiles typical of these cells. (Underlying data can be found in S1 Data.)

References

    1. Kawamoto H, Katsura Y. A new paradigm for hematopoietic cell lineages: revision of the classical concept of the myeloid-lymphoid dichotomy. Trends in immunology. 2009;30(5):193–200. doi: 10.1016/j.it.2009.03.001 . - DOI - PubMed
    1. Akashi K, Traver D, Miyamoto T, Weissman IL. A clonogenic common myeloid progenitor that gives rise to all myeloid lineages. Nature. 2000;404(6774):193–7. doi: 10.1038/35004599 . - DOI - PubMed
    1. Iwasaki H, Somoza C, Shigematsu H, Duprez EA, Iwasaki-Arai J, Mizuno S, et al. Distinctive and indispensable roles of PU.1 in maintenance of hematopoietic stem cells and their differentiation. Blood. 2005;106(5):1590–600. doi: 10.1182/blood-2005-03-0860 ; PubMed Central PMCID: PMC1895212. - DOI - PMC - PubMed
    1. Kondo M, Weissman IL, Akashi K. Identification of clonogenic common lymphoid progenitors in mouse bone marrow. Cell. 1997;91(5):661–72. . - PubMed
    1. Nutt SL, Metcalf D, D'Amico A, Polli M, Wu L. Dynamic regulation of PU.1 expression in multipotent hematopoietic progenitors. The Journal of experimental medicine. 2005;201(2):221–31. doi: 10.1084/jem.20041535 ; PubMed Central PMCID: PMC2212785. - DOI - PMC - PubMed

Publication types

MeSH terms