. 2017 Jul 27;12(7):e0179726.
doi: 10.1371/journal.pone.0179726. eCollection 2017.

Genome-wide association analysis identifies genetic correlates of immune infiltrates in solid tumors

Affiliations

Genome-wide association analysis identifies genetic correlates of immune infiltrates in solid tumors

Nathan O Siemers et al. PLoS One. .

Abstract

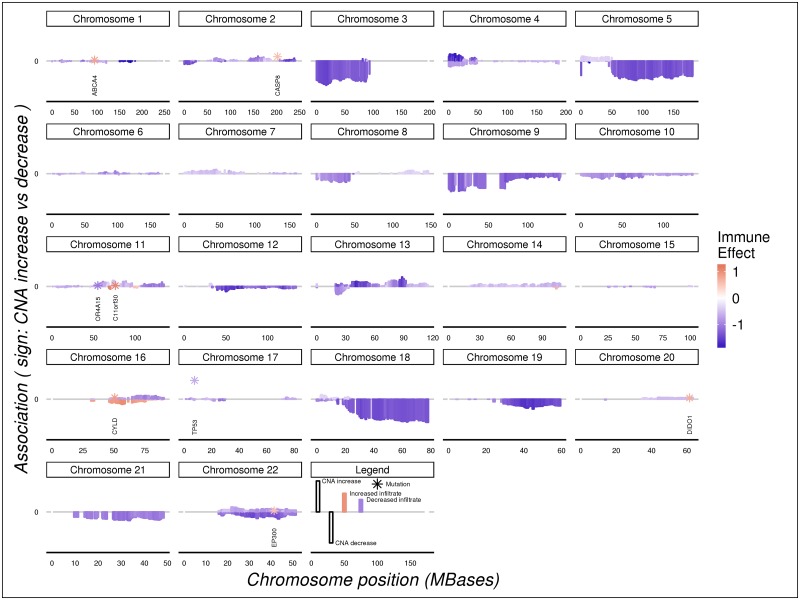
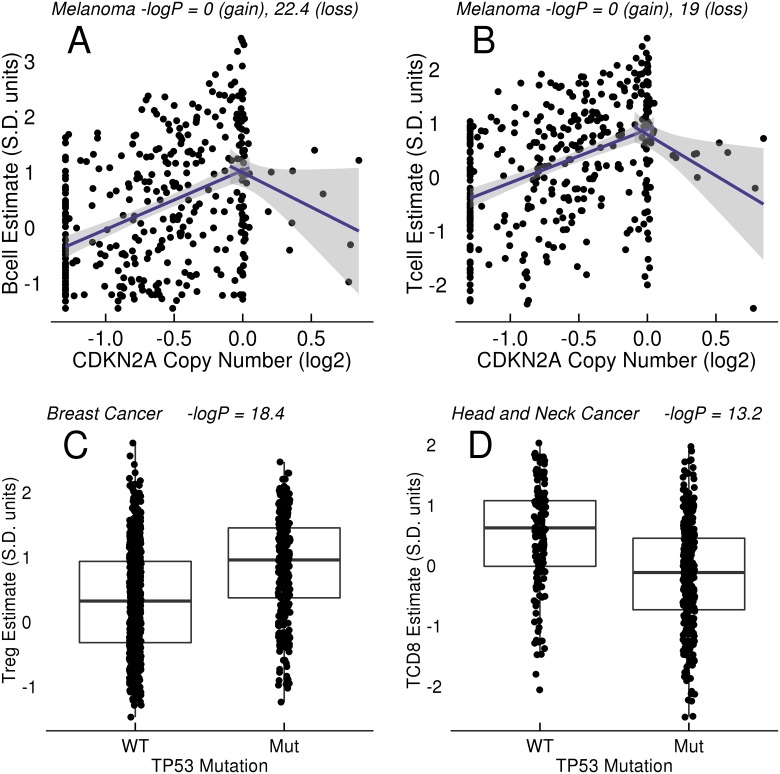
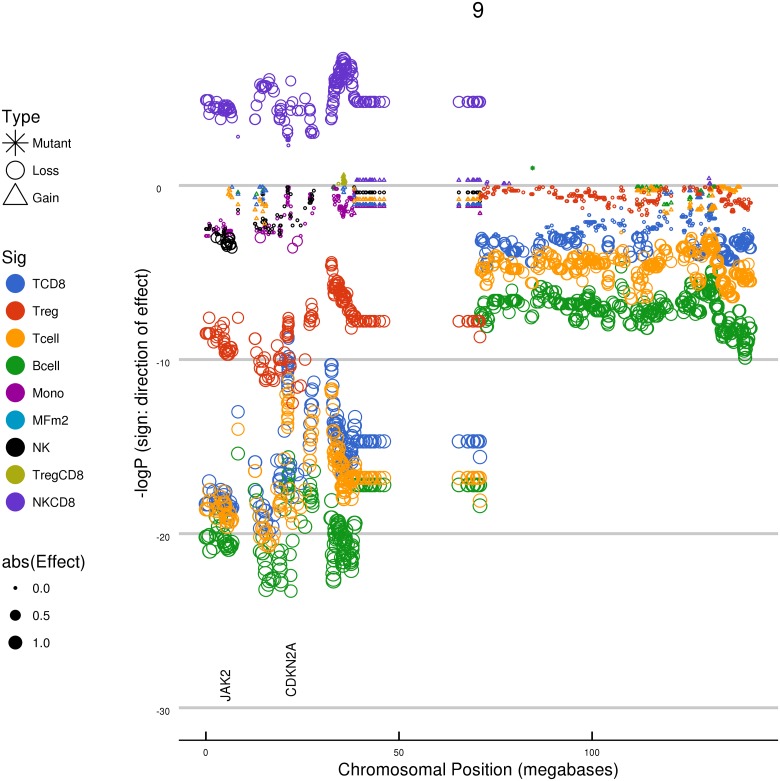
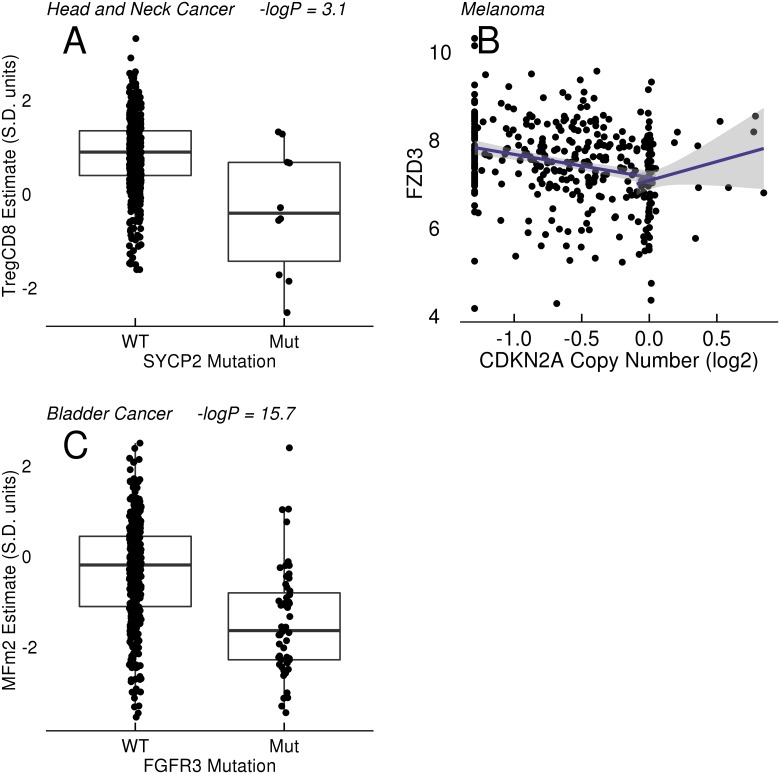
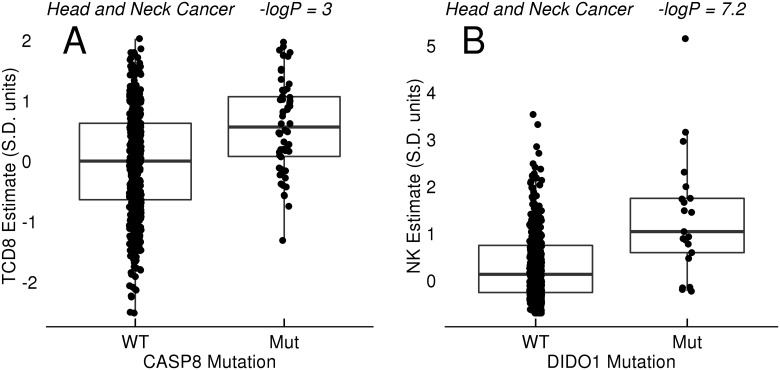
Therapeutic options for the treatment of an increasing variety of cancers have been expanded by the introduction of a new class of drugs, commonly referred to as checkpoint blocking agents, that target the host immune system to positively modulate anti-tumor immune response. Although efficacy of these agents has been linked to a pre-existing level of tumor immune infiltrate, it remains unclear why some patients exhibit deep and durable responses to these agents while others do not benefit. To examine the influence of tumor genetics on tumor immune state, we interrogated the relationship between somatic mutation and copy number alteration with infiltration levels of 7 immune cell types across 40 tumor cohorts in The Cancer Genome Atlas. Levels of cytotoxic T, regulatory T, total T, natural killer, and B cells, as well as monocytes and M2 macrophages, were estimated using a novel set of transcriptional signatures that were designed to resist interference from the cellular heterogeneity of tumors. Tumor mutational load and estimates of tumor purity were included in our association models to adjust for biases in multi-modal genomic data. Copy number alterations, mutations summarized at the gene level, and position-specific mutations were evaluated for association with tumor immune infiltration. We observed a strong relationship between copy number loss of a large region of chromosome 9p and decreased lymphocyte estimates in melanoma, pancreatic, and head/neck cancers. Mutations in the oncogenes PIK3CA, FGFR3, and RAS/RAF family members, as well as the tumor suppressor TP53, were linked to changes in immune infiltration, usually in restricted tumor types. Associations of specific WNT/beta-catenin pathway genetic changes with immune state were limited, but we noted a link between 9p loss and the expression of the WNT receptor FZD3, suggesting that there are interactions between 9p alteration and WNT pathways. Finally, two different cell death regulators, CASP8 and DIDO1, were often mutated in head/neck tumors that had higher lymphocyte infiltrates. In summary, our study supports the relevance of tumor genetics to questions of efficacy and resistance in checkpoint blockade therapies. It also highlights the need to assess genome-wide influences during exploration of any specific tumor pathway hypothesized to be relevant to therapeutic response. Some of the observed genetic links to immune state, like 9p loss, may influence response to cancer immune therapies. Others, like mutations in cell death pathways, may help guide combination therapeutic approaches.


Conflict of interest statement

Competing Interests: The authors are employed at Bristol-Myers Squibb, which discovered and commercialized ipilimumab and nivolumab therapies for cancer. There are no patents, clinical research programs, nor marketed products to declare that are directly related to this manuscript. Bristol-Myers Squibb has major efforts in the area of immuno-oncology in general. Our affiliation with Bristol-Myers Squibb does not alter our adherence to PLOS ONE policies on sharing data and materials.

Figures

Fig 1
Fig 1. Expression and correlation of immunological markers in TCGA and Tirosh et al. single cell melanoma RNA-seq data.
A: CD4 is co-expressed with both T cell (CD3E) and myeloid linege (CSF1R) markers in melanoma. Scatter plots of CD4, CD3E, and CSF1R transcript levels from a single-cell RNA-seq data study of melanoma patients (Tirosh et al.). Only CD45 positive cells (PTPRC, expression > 1) are shown. Gaussian noise (s.d. = 0.25) was added to the transcript estimates to improve data visualization (log2 scale). B: Mutual rank-based co-regulatory network around FOXP3 in TCGA. All solid tumor samples in the TCGA pan-cancer data release were used to create the mutual rank correlation network. Color saturation and thickness of lines represent strength of correlation. CCR8 and FOXP3 were selected to create a regulatory T cell (Treg) signature for estimating Treg content in tumors. C: Mutual rank-based co-regulatory network around FOXP3 in Tirosh et al. single cell melanoma RNA-seq data. D: Mutual rank-based co-regulatory network around macrophage marker VSIG4 in TCGA. VSIG4, CD163, and MS4A4A were selected to create a signature to estimate macrophage content in tumors.
Fig 2
Fig 2. Landscape of association between tumor copy number changes, mutations, and CD8+ T cell estimates in TCGA head and neck cancer.
Chromosomal location is shown on the horizontal axis with each point (mutation) or bar (CNA) representing the results for a locus. The length of the bars reflects the strength of the association signal; for CNAs, the sign indicates copy number gains (positive) or losses (negative). Mutation are indicated by stars and annotated with the HGNC gene name.
Fig 3
Fig 3. Association of CDKN2A CNA and TP53 mutation with immune estimates in tumors.
(A-B) Relationship of CDKN2A copy number estimates to B and T cell estimates across TCGA melanoma. The horizontal scale is the log2 GISTIC CNA estimate (0 = diploid, -1.3 = homozygous loss). The signature scores are measured in units of standard deviation of the signature's variation across TCGA tumors. Independent tests of association were performed for CNA > -0.1 and CNA < 0.1. The lines drawn are the linear regressions of the gain/loss CNA with the immune estimate, with shading to indicate the 95% confidence interval around the line's slope (without model covariate adjustments or multiple test corrections). (C) Relationship of TP53 mutation to regulatory T cell (Treg) estimates across breast cancer. (D) Relationship of TP53 mutation to CD8+ Tcell estimates in head and neck cancer.
Fig 4
Fig 4. Relationship between chromosome 9 genetic changes and immune cell abundance estimates in TCGA melanoma.
Chromosomal location is displayed on the horizontal axis, and effect size is displayed on the vertical axis. Each data point represents the results for a given locus, with significance (negative log(10) P value) indicated by the size of the data point. The negative log(10) of the multiplicity-corrected model P value is plotted on the vertical axes; negative values indicate a negative effect on the cellular estimate. A large region of chromosome 9p, when lost, is in association with the changes in cellular estimates for many immune cell types. The horizontal axis is the physical coordinate on chromosome 9 in units of 106 bases. The vertical axis is the negative log(10) of the model P value, with negative numbers used to indicate associations that decrease the immune estimate being tested.
Fig 5
Fig 5. Association of SYCP2 and FGFR3 with immune estimates in tumors; correlation of chromosome 9p copy number (CDKN2A) with FZD3 RNA expression.
A: Relationship between SYCP2 mutation and Treg—CD8 ratios in head and neck cancer. B: correlation of FZD3 (log2) RNA expression with CDKN2A copy number. C: Relationship between FGFR3 mutation and macrophage (MFm2) estimates in bladder cancer.
Fig 6
Fig 6. Mutations in cell death pathways.
A: Relationship between CASP8 mutation with CD8+ T cell (TCD8) estimates in head and neck cancer. B: Relationship between DIDO1 mutation and NK estimates in head and neck cancer.

Similar articles

Cited by

References

    1. Wherry EJ, Kurachi M. Molecular and cellular insights into T cell exhaustion. Nature reviews Immunology. 2015;15: 486–499. doi: 10.1038/nri3862 - DOI - PMC - PubMed
    1. Wolchok JD, Kluger H, Callahan MK, Postow MA, Rizvi NA, Lesokhin AM, et al. Nivolumab plus ipilimumab in advanced melanoma. The New England journal of medicine. 2013;369: 122–133. doi: 10.1056/NEJMoa1302369 - DOI - PMC - PubMed
    1. Schadendorf D, Hodi FS, Robert C, Weber JS, Margolin K, Hamid O, et al. Pooled Analysis of Long-Term Survival Data From Phase II and Phase III Trials of Ipilimumab in Unresectable or Metastatic Melanoma. Journal of clinical oncology: official journal of the American Society of Clinical Oncology. 2015;33: 1889–1894. doi: 10.1200/JCO.2014.56.2736 - DOI - PMC - PubMed
    1. Ji R-R, Chasalow SD, Wang L, Hamid O, Schmidt H, Cogswell J, et al. An immune-active tumor microenvironment favors clinical response to ipilimumab. Cancer immunology, immunotherapy: CII. 2012;61: 1019–1031. doi: 10.1007/s00262-011-1172-6 - DOI - PMC - PubMed
    1. Rizvi NA, Hellmann MD, Snyder A, Kvistborg P, Makarov V, Havel JJ, et al. Cancer immunology. Mutational landscape determines sensitivity to PD-1 blockade in non-small cell lung cancer. Science (New York, NY). 2015;348: 124–128. - PMC - PubMed

MeSH terms