. 2017 Jul 27;12(7):e0180616.
doi: 10.1371/journal.pone.0180616. eCollection 2017.

Prediction of novel target genes and pathways involved in irinotecan-resistant colorectal cancer

Affiliations

Prediction of novel target genes and pathways involved in irinotecan-resistant colorectal cancer

Precious Takondwa Makondi et al. PLoS One. .

Abstract

Background: Acquired drug resistance to the chemotherapeutic drug irinotecan (the active metabolite of which is SN-38) is one of the significant obstacles in the treatment of advanced colorectal cancer (CRC). The molecular mechanism or targets mediating irinotecan resistance are still unclear. It is urgent to find the irinotecan response biomarkers to improve CRC patients' therapy.

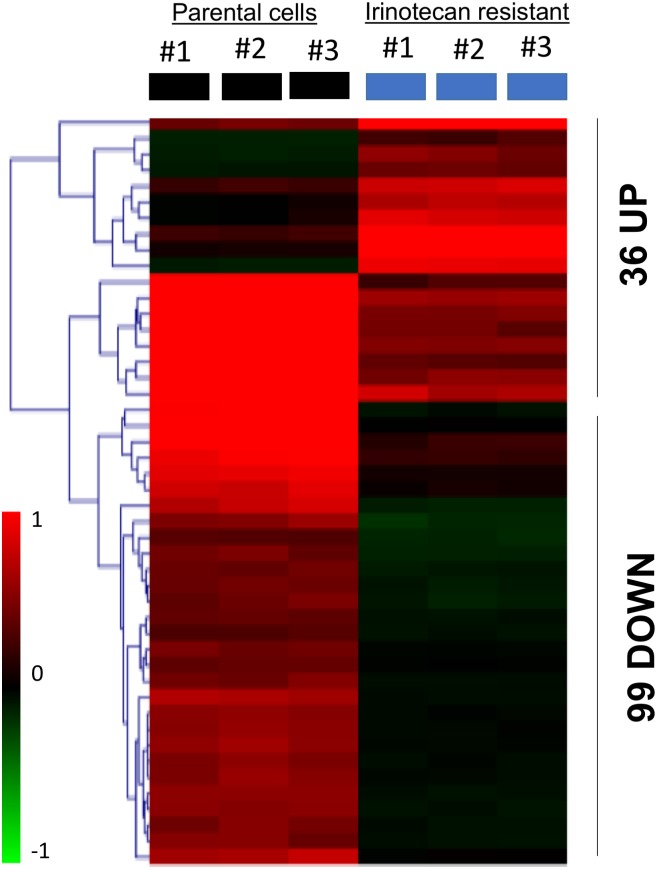
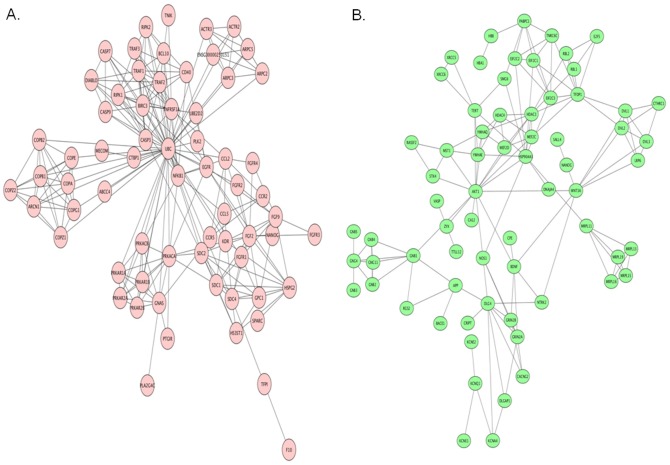
Methods: Genetic Omnibus Database GSE42387 which contained the gene expression profiles of parental and irinotecan-resistant HCT-116 cell lines was used. Differentially expressed genes (DEGs) between parental and irinotecan-resistant cells, protein-protein interactions (PPIs), gene ontologies (GOs) and pathway analysis were performed to identify the overall biological changes. The most common DEGs in the PPIs, GOs and pathways were identified and were validated clinically by their ability to predict overall survival and disease free survival. The gene-gene expression correlation and gene-resistance correlation was also evaluated in CRC patients using The Cancer Genomic Atlas data (TCGA).

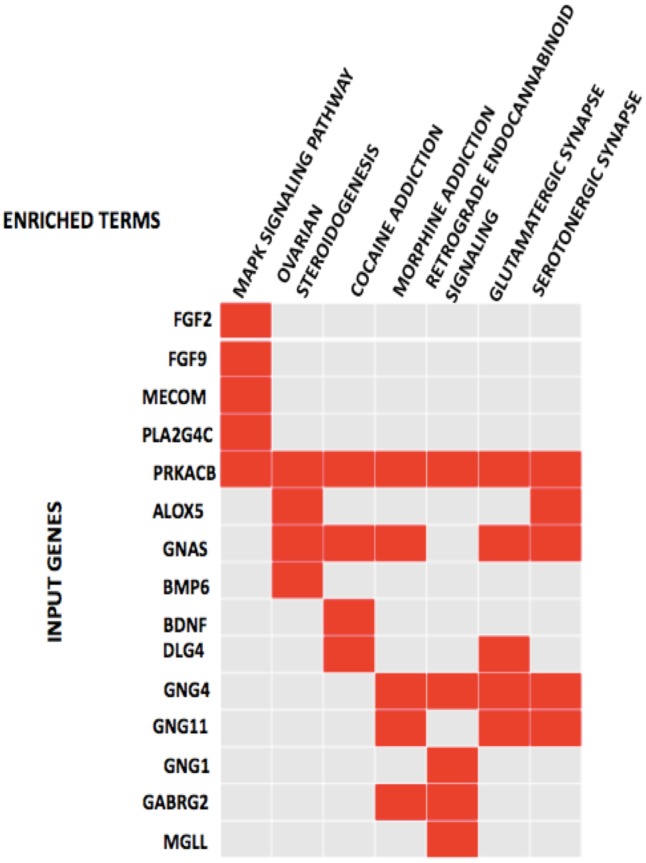
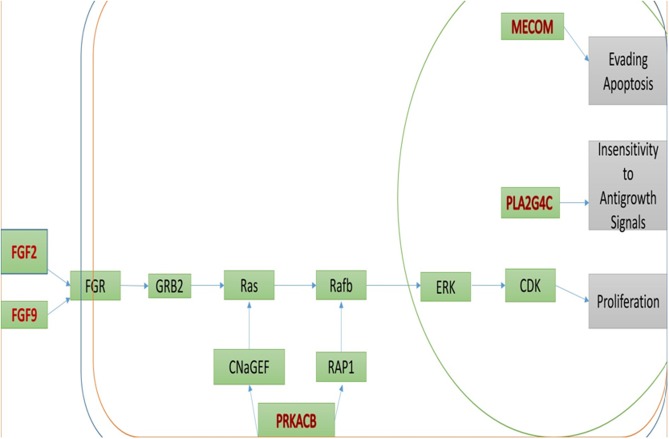
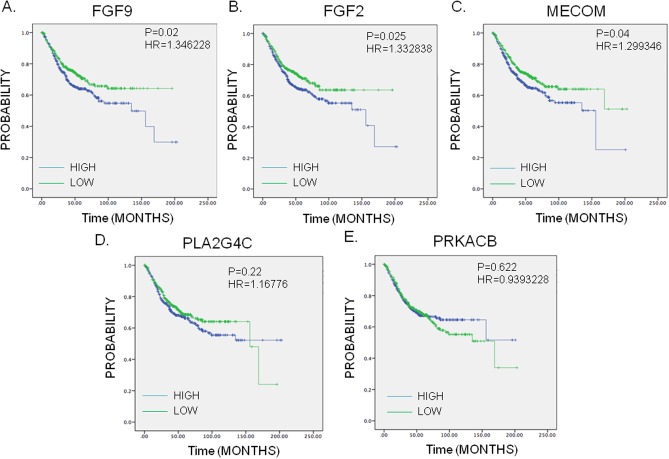
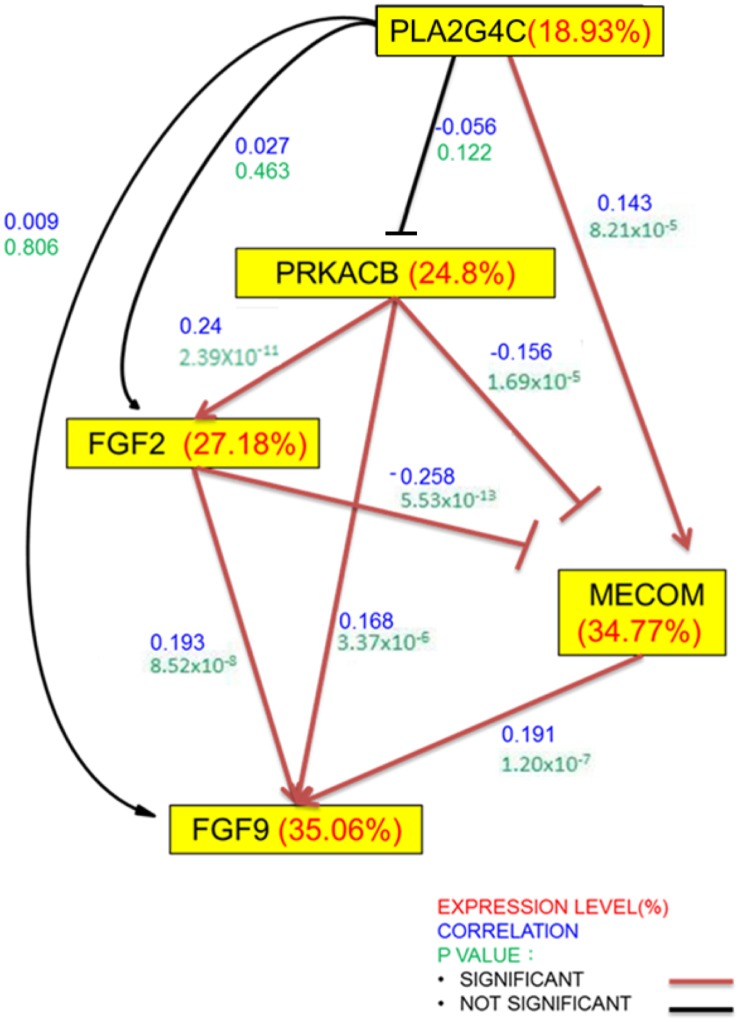
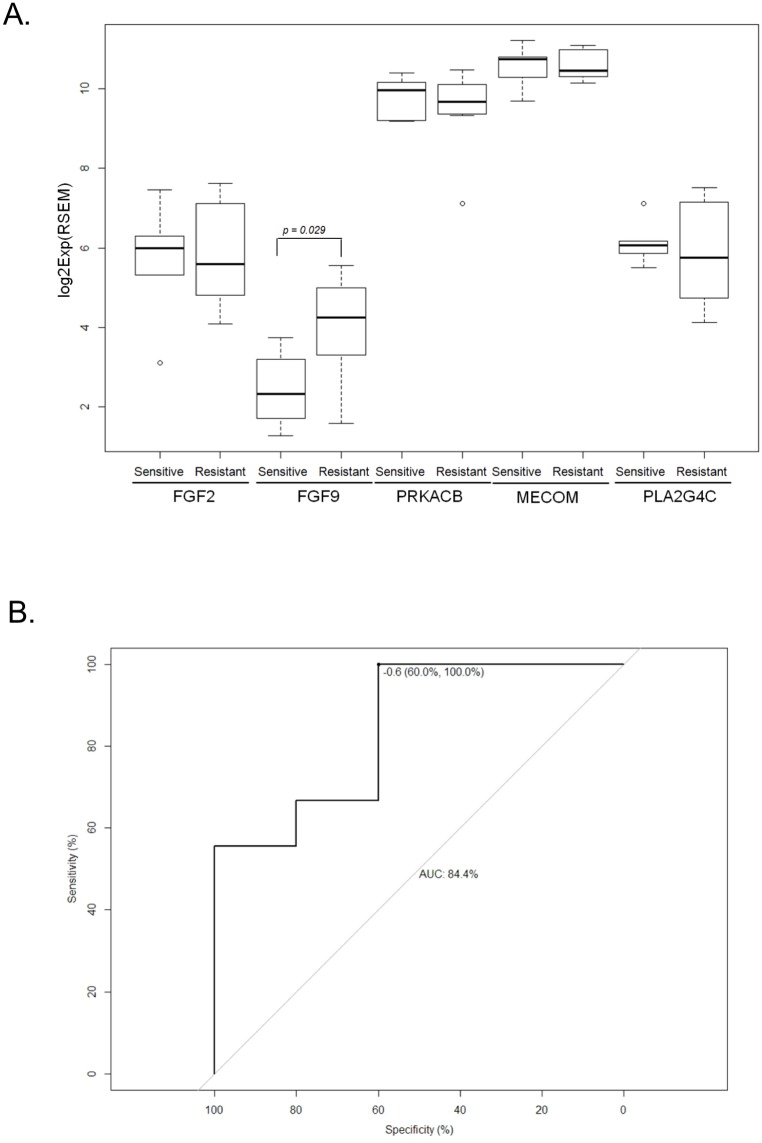
Results: The 135 DEGs were identified of which 36 were upregulated and 99 were down regulated. After mapping the PPI networks, the GOs and the pathways, nine genes (GNAS, PRKACB, MECOM, PLA2G4C, BMP6, BDNF, DLG4, FGF2 and FGF9) were found to be commonly enriched. Signal transduction was the most significant GO and MAPK pathway was the most significant pathway. The five genes (FGF2, FGF9, PRKACB, MECOM and PLA2G4C) in the MAPK pathway were all contained in the signal transduction and the levels of those genes were upregulated. The FGF2, FGF9 and MECOM expression were highly associated with CRC patients' survival rate but not PRKACB and PLA2G4C. In addition, FGF9 was also associated with irinotecan resistance and poor disease free survival. FGF2, FGF9 and PRKACB were positively correlated with each other while MECOM correlated positively with FGF9 and PLA2G4C, and correlated negatively with FGF2 and PRKACB after doing gene-gene expression correlation.

Conclusion: Targeting the MAPK signal transduction pathway through the targeting of the FGF2, FGF9, MECOM, PLA2G4C and PRKACB might increase tumor responsiveness to irinotecan treatment.


Conflict of interest statement

Competing Interests: The authors have declared that no competing interests exist.

Figures

Fig 1
Fig 1. Heat map showing upregulated and downregulated differentially expressed genes (DEGs) in irinotecan-resistant colon cancer cells.
A bidirectional hierarchical clustering heat map Constructed using multiExperimental Viewer(MEV). The expression values are log2 fold changes (>1 or <−1, FDR <0.05)) between corresponding irinotecan-resistant HCT116 cell lines and parental HCT116 cell lines. Black represents no change in expression, green represents downregulation, and red represents upregulation.
Fig 2
Fig 2. Protein–protein interaction (PPI) network of differentially expressed genes (A) upregulated genes and (B) downregulated genes.
The PPI pairs were imported into Cytoscape software as described in Methods and Materials. Pink nodes represent up regulated genes while green nodes represent down regulated genes. The lines represent interaction relationship between nodes.
Fig 3
Fig 3. Significant KEGG pathways and the genes involved.
Gene enrichment analysis of the DEGs involved in irinotecan resistance showing KEGG pathways significantly enriched in irinotecan resistant cell lines and the genes involved in the pathways (the pathways in order of their enrichment from left to right) (FDR <0.05 p-value of <0.05).
Fig 4
Fig 4. Simplified MAPK pathway showing the location of the significant genes in the pathway.
The DAVID online tool was used to download the pathway and show the position of the DEGs in the pathway using the pathway ID of hsa04010. Input genes are in red. And the final effect of the pathway is represented in gray.
Fig 5
Fig 5. Kaplan-Meier survival curves presenting the prognostic relationship between high and low expression of specific genes involved in irinotecan resistance to overall survival (A) MECOM, (B) FGF2, (C) FGF9, (D) PLA2G4C and (E) PRKACB.
The survival curves were plotted using the survExpress online tool. The specific DEGs expression levels were dichotomized by median value and the results presented visually by Kaplan-Meier survival plots. P-values were calculated using log-rank statistics. Patient number = 808, HR = Hazard Ratio, P = Logrank P-value.
Fig 6
Fig 6. Gene expression correlation of the genes involved in the MAPK pathway in the CRC tumor samples from the TCGA data base.
The pooled microarray datasets downloaded from NCBI were used to identify the relationship of these candidate genes. The genes in the upstream of the network were assumed to be less variant, so coefficient of variation (CV) of each gene (presented in percent) was calculated to determine its site in the regulatory network. Besides, Spearman’s rank correlation coefficients (-1 to 1) of the desired gene pairs decide whether they were negative/positive control with significance level p<0.05. Number of patients = 653. The red lines or arrows represent significant correlation (P-value <0.05). Coefficient of variation in red, correlation coefficient in blue and P-value in green.
Fig 7
Fig 7
(A)Box plots presenting the gene expression status between irinotecan sensitive and irinotecan resistant patients of the five candidate genes (MECOM, FGF2, FGF9, PLA2G4C and PRKACB). (B) The receiver operating characteristic (ROC) curve showing area under ROC curve (AUC) and the threshold of score between FGF9 and PLA2G4C. The regression model was also estimated based on the two genes and the score was calculated representing irinotecan resistance. TCGA-COAD RNA-sequence dataset (level 3.1.12.0) was used. The patients were divided into sensitive and resistant. The significance value was found by the Mann-Whitney U test method (P <0.05 as significant). Number of patients = 14.

References

    1. Siegel RL, Miller KD, Jemal A (2015) Cancer statistics, 2015. CA Cancer J Clin 65: 5–29. doi: 10.3322/caac.21254 - DOI - PubMed
    1. Nordlinger B, Van Cutsem E, Gruenberger T, Glimelius B, Poston G, et al. (2009) Combination of surgery and chemotherapy and the role of targeted agents in the treatment of patients with colorectal liver metastases: recommendations from an expert panel. Ann Oncol 20: 985–992. doi: 10.1093/annonc/mdn735 - DOI - PubMed
    1. Ruers T, Bleichrodt RP (2002) Treatment of liver metastases, an update on the possibilities and results. Eur J Cancer 38: 1023–1033. - PubMed
    1. Gallagher DJ, Kemeny N (2010) Metastatic colorectal cancer: from improved survival to potential cure. Oncology 78: 237–248. doi: 10.1159/000315730 - DOI - PubMed
    1. Van Cutsem E, Nordlinger B, Cervantes A (2010) Advanced colorectal cancer: ESMO Clinical Practice Guidelines for treatment. Ann Oncol 21 Suppl 5: v93–97. - PubMed

MeSH terms