. 2017 Jul 27;13(7):e1006471.
doi: 10.1371/journal.ppat.1006471. eCollection 2017 Jul.

Cross-modulation of pathogen-specific pathways enhances malnutrition during enteric co-infection with Giardia lamblia and enteroaggregative Escherichia coli

Affiliations

Cross-modulation of pathogen-specific pathways enhances malnutrition during enteric co-infection with Giardia lamblia and enteroaggregative Escherichia coli

Luther A Bartelt et al. PLoS Pathog. .

Abstract

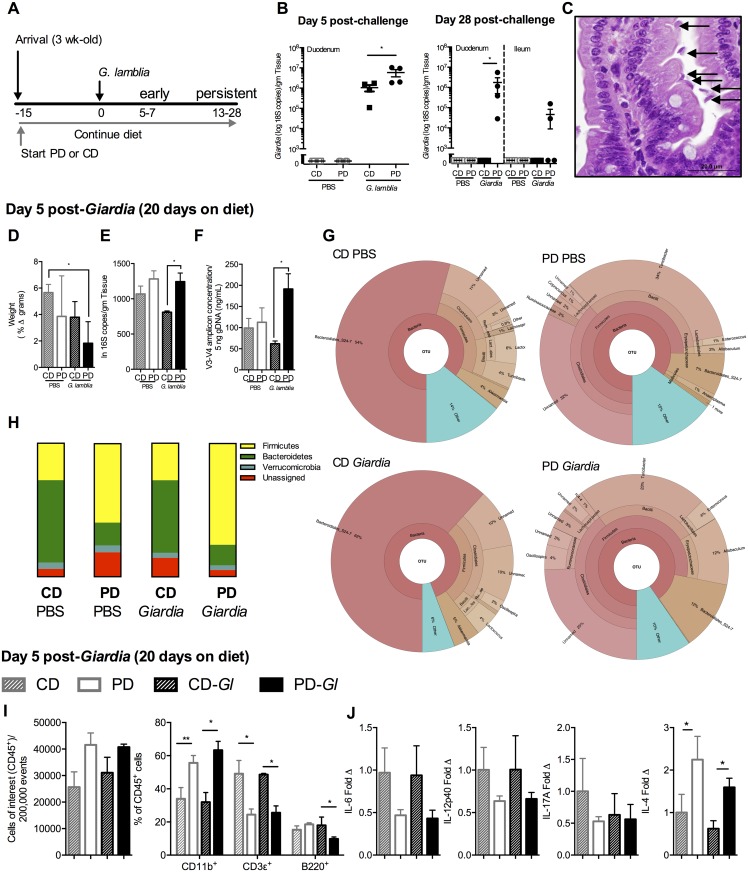
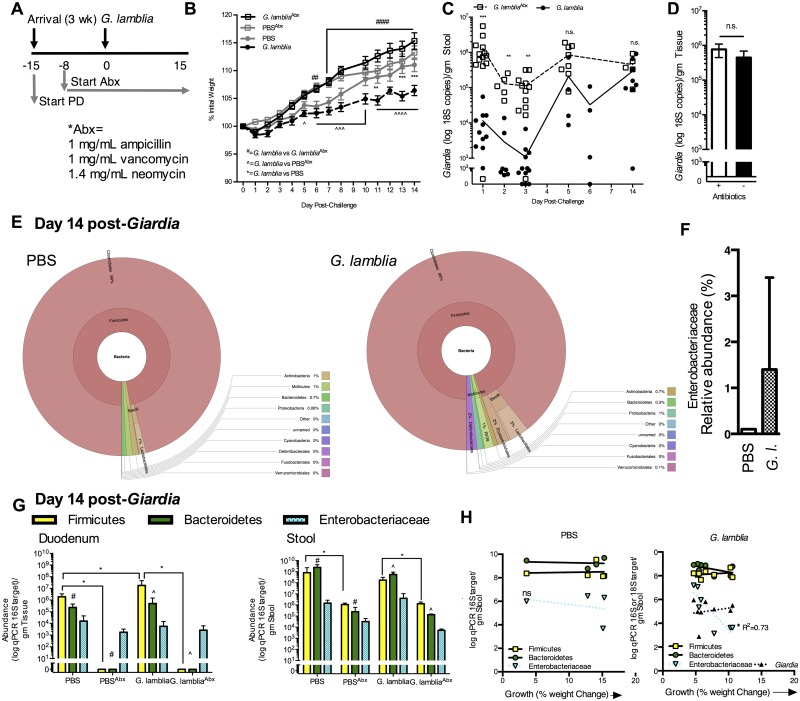
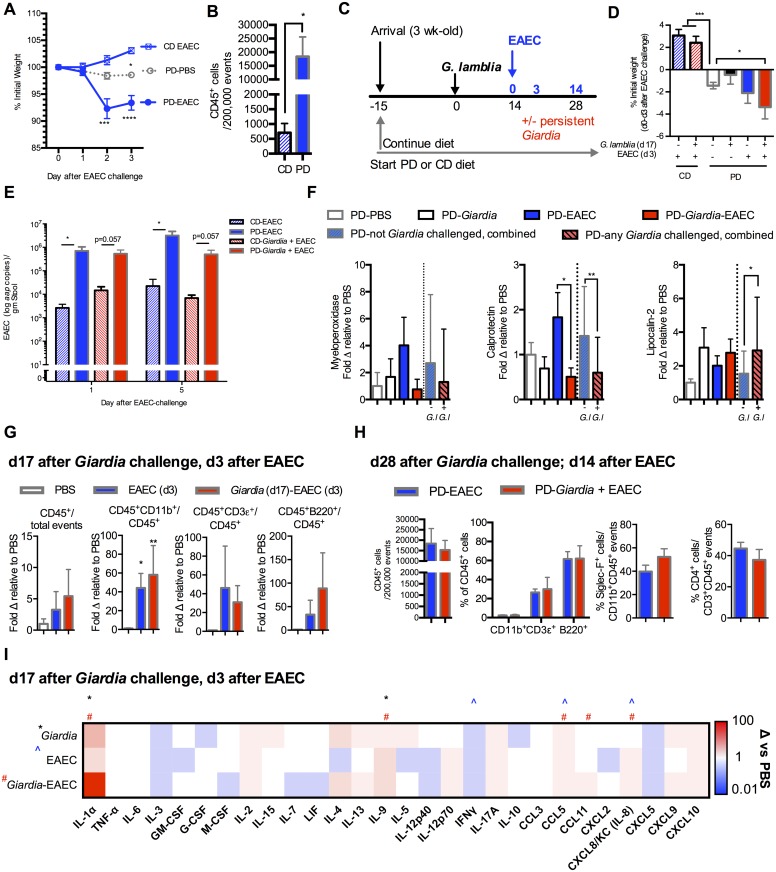
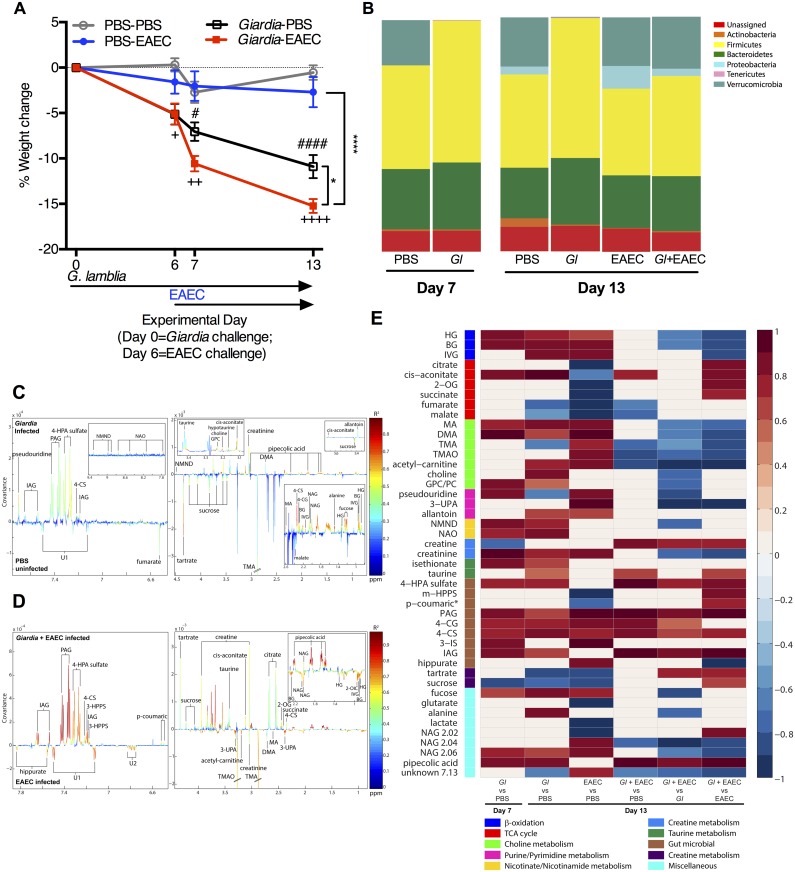
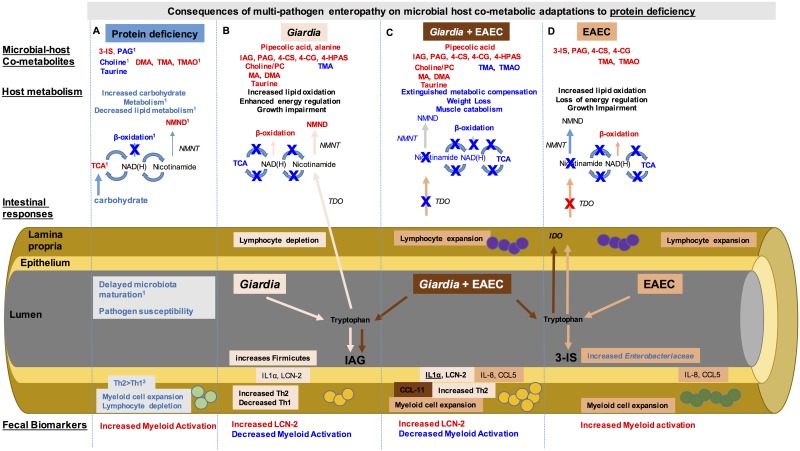
Diverse enteropathogen exposures associate with childhood malnutrition. To elucidate mechanistic pathways whereby enteric microbes interact during malnutrition, we used protein deficiency in mice to develop a new model of co-enteropathogen enteropathy. Focusing on common enteropathogens in malnourished children, Giardia lamblia and enteroaggregative Escherichia coli (EAEC), we provide new insights into intersecting pathogen-specific mechanisms that enhance malnutrition. We show for the first time that during protein malnutrition, the intestinal microbiota permits persistent Giardia colonization and simultaneously contributes to growth impairment. Despite signals of intestinal injury, such as IL1α, Giardia-infected mice lack pro-inflammatory intestinal responses, similar to endemic pediatric Giardia infections. Rather, Giardia perturbs microbial host co-metabolites of proteolysis during growth impairment, whereas host nicotinamide utilization adaptations that correspond with growth recovery increase. EAEC promotes intestinal inflammation and markers of myeloid cell activation. During co-infection, intestinal inflammatory signaling and cellular recruitment responses to EAEC are preserved together with a Giardia-mediated diminishment in myeloid cell activation. Conversely, EAEC extinguishes markers of host energy expenditure regulatory responses to Giardia, as host metabolic adaptations appear exhausted. Integrating immunologic and metabolic profiles during co-pathogen infection and malnutrition, we develop a working mechanistic model of how cumulative diet-induced and pathogen-triggered microbial perturbations result in an increasingly wasted host.


Conflict of interest statement

I have read the journal's policy and the authors of this manuscript have the following competing interests: LAB was a temporary consultant for Lupin Pharmaceuticals, June - December 2015.

Figures

Fig 1
Fig 1. Protein malnutrition in weaned mice disrupts Giardia clearance, promotes increased microbial-pathogen abundance in small intestine, and establishes cytokine profiles associated with persistent Giardia infection.
(A) Experimental timeline of Giardia challenge in 3 week-old C56Bl/6 mice initiated on either control diet (CD) or protein-deficient diet (PD) upon arrival and continued throughout the duration of the experiment. G. lamblia (Assemblage B, H3) infection occurred on experimental day 0. Data for this and subsequent experiments were obtained during either early timepoints when mice on both diets remained infected with Giardia (day 5–7) or later timepoints (up to 28 days) (persistent) when only mice fed PD diet remained infected. (B) Duodenal Giardia burden at day 5 (left) and duodenal and ileal Giardia burden on day 28 (right) post-challenge in either CD or PD-fed mice and uninfected controls. (C) Histopathology of duodenum in infected mice fed PD diet (20x, H&E, arrows designate trophozoites). (D) Growth in mice (as % weight increase between day 5 and day 0). (E) Small intestinal bacterial abundance by total 16S rRNA universal primers and (F) quantification of the V3-V4 region amplification product. (G) Krona visualizations of 16S rRNA OTUs in the upper small intestine high-abundance taxa (>10,000 reads per OTU) in mice fed CD (left) or PD (right) 5 days after Giardia lamblia (bottom) compared with age and diet-matched controls (top) as indicated. (H) Phyla-level 16S rRNA relative abundances in upper small intestine 5 days after G. lamblia challenge compared with age and diet-matched controls. (I) Flow cytometry of duodenal lamina propria leukocytes (LPL) day 5 post-challenge, stained for leukocytes (CD45+) and frequency of myeloid (CD11b+), T- (CD3+) and B- (B220+) cells and (J) Cytokine protein levels in duodenum shown as fold change relative to uninfected CD-fed controls (PBS). For all studies n = 4/group; *P<0.05, **P<0.01.
Fig 2
Fig 2. Giardia interacts with resident microbiota to impair host growth during protein malnutrition.
(A) Experimental timeline. 3-week-old C57Bl/6 mice were initiated on the PD diet upon arrival. Antibiotic (Abx)-treated animals received antibiotics vancomycin, neomycin, and ampicillin continuously ad libitum in drinking water beginning 8 days prior to G. lamblia challenge and throughout the duration of the experiment. (B) Growth curves of each experimental group as percent of initial weight beginning on the day of G. lamblia challenge (Day 0). **P<0.01, *** P<0.001 (G. lamblia vs. PBS); ^P<0.05, ^^^P<0.01, ^^^^P<0.001 (G. lamblia vs. PBSAbx), and ## P<0.01 and #### P<0.0001 (G. lamblia vs. G.lambliaAbx) (n = 11-13/group in combined replicate experiments). (C) Effect of continuous antibiotics on serial Giardia fecal shedding and (D) day 14 duodenum burden as determined by 18S qPCR. (E) Krona visualization of fecal 16S V3-V4 OTUs in PBS control (left) and G. lamblia infected (right) mice at 14 days post-challenge. (F) Fecal Enterobacteriaceae abundance by 16S V3-V4 OTUs in PBS and G. lamblia (G.l.) infected mice at 14 days post-challenge. (G) Abundance of Firmicutes, Bacteroidetes and Enterobacteriaceae by qPCR in duodenum (left) and feces (right) day 14 after G.lamblia challenge (*P<0.05, ****P<0.0001), #P<0.05, ^P<0.05 as indicated (n = 4 = 8/group). (H) Correlation between growth as % weight change at 14 days after G. lamblia challenge (such that 0 = no change in weight and 15 = 15% weight increase) and fecal qPCR abundance of designated bacterial taxa or G. lamblia in uninfected (left) and G. lamblia challenged mice (right).
Fig 3
Fig 3. Giardia and EAEC combine to worsen growth during protein malnutrition and persistent Giardia infection alters intestinal immune responses to EAEC.
(A) Impact of 109 EAEC042 challenge on growth (% initial weight) of PD-fed and CD-fed mice compared with PD-fed uninfected controls (Day 0 = 28 days on diet) (n = 4/group; *P<0.05 PD-PBS vs CD-EAEC day 3; ***P<0.001 and ****P<0.0001 PD-EAEC vs PD-PBS day 2 and day 3). (B) Flow cytometry of ileum lamina propria leukocytes (CD45+) through 14 days post-EAEC infection (n = 4/group; *P<0.05). (C) Experimental timeline for persistent G. lamblia-EAEC co-infection challenge model. 3-week-old C57Bl/6 mice were initiated on either the PD or the CD diet upon arrival and for 15 days prior to G. lamblia challenge. Sequential challenge with EAEC occurred during persistent (d 14) G. lamblia infection. (D) Impact of prior Giardia exposure on growth following EAEC co-infection. Depicted is growth through 3 days after EAEC co-infection (32 days on diet, 17 days after Giardia infection) (n = 4 per group (CD diet groups) and 6-17/group (PD diet groups); ***P<0.001 PD uninfected vs. either CD-EAEC or CD-G.lamblia-EAEC; *P<0.05 PD-G. lamblia-EAEC vs. PD uninfected) (E) EAEC shedding on day 1 and day 5 post-challenge in CD or PD-fed mice either with or without prior Giardia exposure as indicated. (n = 4/group; *P<0.05 as indicated). (F) Luminal inflammatory biomarkers (Myeloperoxidase (MPO), Calprotectin, and Lipocalin-2) depicted as fold change relative to PBS uninfected controls 3 days after EAEC and 13 days after G. lamblia challenge (n = 7-13/group). Data to the right of the dashed line in all groups represents differences dichotomized to whether mice received G. lamblia challenge (any Giardia challenged, combined) or not (not Giardia challenged, combined) (n = 12-24/group). Data for fecal MPO also includes two individual combined experiments, at 13–17 days after Giardia and 3–7 days after EAEC (n = 7-13/group). (G) Flow cytometry of ileum lamina propria leukocytes (CD45+), and proportions of myeloid (CD11b+), T- (CD3+) and B- (B220+) cells 3 days after EAEC042 challenge (17 days after G. lamblia challenge) in PD-fed mice as indicated (n = 4-8/group; *P<0.05 (EAEC vs PBS), **P<0.01 (Giardia-EAEC vs PBS). Data is shown as fold change relative to uninfected PBS controls. (H) Flow cytometry of ileum lamina propria (left) leukocytes (CD45+), (middle) proportion of myeloid (CD11b+), T- (CD3+) and B- (B220+) and (right) eosinophils (Siglec-F+CD11b+) and CD4+ T-cells at 14 days after EAEC042 challenge (28 days after G. lamblia challenge) in PD-fed mice as indicated. (I) Intestinal protein levels 3 days after EAEC042 challenge (17 days after G. lamblia) in PD-fed mice. 29 of Luminex 32-target panel results shown in heatmap. Data depicted as fold change relative to uninfected controls (range 0.01 to 100). (*P<0.05 for Giardia, ^P<0.05 for EAEC, and #P<0.05 for Giardia-EAEC vs uninfected controls, n = 6-12/group).
Fig 4
Fig 4. EAEC combines with Giardia to enhance microbial host co-metabolic perturbations and co-infection exhausts regulatory host energy expenditure adaptations during malnutrition.
C57Bl/6 males were initiated on the protein deficient diet upon arrival at 3 weeks of age and then challenged with G. lamblia 7 days later. Six days after G. lamblia, two groups were challenged with enteroaggregative E. coli (EAEC). Uninfected controls received PBS-PBS sham gavages at each infection timepoint. (n = 6/group). (A) Depicted is growth as percentage of starting weight beginning on the day of G. lamblia infection (Experimental day 0 (Day 0)) and through 13 days after Giardia challenge (7 days after EAEC challenge) (Day 13). (+P<0.05, ++P<0.01, ++++P<0.001 Giardia-PBS vs PBS-PBS; #P<0.05, ####P<0.001 Giardia-PBS vs PBS-EAEC; *P<0.05 Giardia-EAEC vs. Giardia-PBS Day 7 and Day 13; ****P<0.0001 Giardia-EAEC vs. PBS-EAEC Day 7 and Day 13). (B) Phylum-level relative operational taxonomic unit (OTU) abundances determined after amplification and sequencing of the V3-V4 region of 16S rRNA gene in fecal samples from uninfected, Giardia-infected, EAEC-infected, and co-infected mice on experimental days 7 and 13 as indicated. (C,D) OPLS-DA correlation coefficient plots indicating the variation between (C) Giardia infected (Day 13) and uninfected PBS controls (Day 13) (Q2Y = 0.40; P = 0.02) or (D) co-infection (Day 13) versus EAEC mono-infection (Day 13) (Q2Y = 0.82; p = 0.001) (n = 4-5/group). Correlation coefficients plots were generated with the use of a back-scaling transformation to display the contribution of each metabolite to the sample classification. Positive peaks indicate metabolites that were excreted in greater amounts in the Giardia infected (C) or co-infected (D) mice, and negative peaks indicate metabolites that were excreted in lower amounts. The color scale represents the significance of the correlation for each metabolite to the class membership with red indicating stronger significance and blue indicating weaker significance. (E) Heat map of significant changes in urinary metabolites measured using 1H NMR spectroscopy associated with OPLS-DA models. Represented as correlation coefficients (R) (red = increased; blue = decreased) in G. lamblia (Gl) infection at Day 7 and Day 13 versus age-matched uninfected (PBS) controls, EAEC mono-infection Day 13 versus age-matched uninfected (PBS) controls, or co-infection (Gl+EAEC) Day 13 compared with age-matched uninfected controls (PBS) or either mono-infection alone. Abbreviations: 2-OG, 2-oxoglutarate; 3-IS, 3-indoxylsulfate; 3-UPA, 3-ureidopropionic acid; 4-HPA, 4-hydroxyphenylacete; 4-CG, 4-cresolglucuronide; 4-CS 4-cresyl sulfate; DMA, dimethylamine; BG, butyrylglycine; GPC, α-glycerophosphocholine; HG, hexanoylglycine; IAG, indole acetyl gulconate; IVG, isovalarylglycine; MA, methylamine; m-HPPS, m-hydroxyphenylpropionylsulfate; NAG, N-acetyl glutamine; NAO, nicotinamide-N-oxide; NMND, N-methyl- nicotinamide; PAG, N-phenylacetylglycine; TMA, trimethylamine; TMAO, trimethylamine-N-oxide; UK, unknown.
Fig 5
Fig 5. Co-enteropathogens co-modulate host immune and metabolic responses during protein deficiency that converge to worsen malnutrition.
Integrated studies identified that protein deficiency (Column A) results in an increase (red) in microbial host co-metabolites of tryptophan (3-indoxyl sulfate, 3-IS) as well as choline (dimethylamine, DMA; trimethylamine, TMA; and trimethylamine oxide, TMAO) whereas endogenous choline and taurine excretion were decreased (blue). Host metabolism indicated increased carbohydrate metabolism through the tricarboxyclic acid cycle (TCA) and decreased β-oxidation metabolites. Methylation of nicotinamide was increased leading to increased N-methyl nicotinamide (NMND). The intestinal microbiota during protein deficiency are ‘immature’ and result in increased pathogen susceptibility. This microbiota restructuring is accompanied by proportionally increased myeloid cells in the lamina propria, but decreased lymphocytes and a Th2>Th1 skew. During Giardia infection (light orange) (Column B), there are unique metabolites (such as pipecolic acid and alanine). Additional increases in metabolites of tryptophan (indole-3-acetylglycine), phenylalanine (phenylacetylglycine, PAG; 4-hydroxyphenylacetyl (4-HPA) sulfate), and tyrosine (4-cresyl sulfate, 4-CS, and 4-cresolglucuronide 4-CG) indicate further microbial-mediated proteolysis, whereas increased choline, posphatidylcholine (PC), MA and DMA suggest increased choline absorption and decreased TMA indicates limited microbial choline breakdown. These metabolic changes occur despite little perturbation in the intestinal microbial composition. Host metabolism through TCA is shutdown, limiting production of NAD(H), however, NMND excretion is further increased, suggesting generation of nicotinamide through alternative pathways such as tryptophan 2,3 dioxygenase (TDO). Giardia further depletes lymphocytes in the intestinal mucosa while enhancing the Th2>Th1 skew, despite signals of intestinal injury IL1α and lipocalin-2 (LCN-2). EAEC infection (dark orange) (Column D) similarly enhances microbial proteolytic metabolites, though tryptophan is broken down to 3-IS rather than IAG. Increased intestinal microbial choline metabolism leads to increases in TMA and TMAO, opposite to Giardia infection. Although host TCA metabolism is diminished as occurs during Giardia infection, NMND is not increased. Rather, cellular expansion of lymphocytes in response to EAEC and the broadly acting chemokine CCL5 limits alternative nicotinamide generation pathways through the actions of indoleamine 2,3 dioxygenase (IDO). EAEC also enhances myeloid cell recruitment with concurrent increases in IL-8. During co-infection (rust) (Column C) the microbial host co-metabolites resemble those occurring during Giardia infection alone, however, host metabolic compensatory responses are lost. Unique metabolic products of Giardia metabolism, such as pipecolic acid, are detectable. Inflammatory cell recruitment resembles EAEC infection, but with a Giardia-mediated altered immune response profile, with the unique elevation of CCL11. Fecal markers of myeloid activation that are diminished during Giardia infection are also attenuated during co-infection, implicating either parasite- or metabolite-induced changes in myeloid cell phenotypes. 1Mayneris-Perxachs, et al. 2016 [16] 2 Bartelt, et al. 2015 [35].

Comment in

References

    1. Smith MI, Yatsunenko T, Manary MJ, Trehan I, Mkakosya R, Cheng J, et al. Gut microbiomes of Malawian twin pairs discordant for kwashiorkor. Science. 2013;339(6119):548–54. Epub 2013/02/01. doi: 10.1126/science.1229000 ; - DOI - PMC - PubMed
    1. Blanton LV, Charbonneau MR, Salih T, Barratt MJ, Venkatesh S, Ilkaveya O, et al. Gut bacteria that prevent growth impairments transmitted by microbiota from malnourished children. Science. 2016;351(6275). doi: 10.1126/science.aad3311 ; - DOI - PMC - PubMed
    1. Guerrant RL, Leite AM, Pinkerton R, Medeiros PH, Cavalcante PA, DeBoer M, et al. Biomarkers of Environmental Enteropathy, Inflammation, Stunting, and Impaired Growth in Children in Northeast Brazil. PLoS One. 2016;11(9):e0158772 doi: 10.1371/journal.pone.0158772 ; - DOI - PMC - PubMed
    1. Taniuchi M, Platts-Mills JA, Begum S, Uddin MJ, Sobuz SU, Liu J, et al. Impact of enterovirus and other enteric pathogens on oral polio and rotavirus vaccine performance in Bangladeshi infants. Vaccine. 2016;34(27):3068–75. Epub 2016/05/08. doi: 10.1016/j.vaccine.2016.04.080 ; - DOI - PMC - PubMed
    1. Prata MMG H A, Bolick DT, Pinkerton R, Lima AMM, Guerrant RL. Comparisons between myeloperoxidase, lactoferrin, calprotectin and lipocalin-2, as fecal biomarkers of intestinal inflammation in malnourished children. J Transl Sci. 2016;2(2):134–9. doi: 10.15761/JTS.1000130 - DOI - PMC - PubMed

MeSH terms