Prevalence of Hearing Loss in US Children and Adolescents: Findings From NHANES 1988-2010
- PMID: 28750123
- PMCID: PMC5710291
- DOI: 10.1001/jamaoto.2017.0953
Prevalence of Hearing Loss in US Children and Adolescents: Findings From NHANES 1988-2010
Abstract
Importance: There have been concerns about increasing levels of hearing impairment in children and adolescents, especially in relation to noise exposure, because even mild levels of hearing loss can affect educational outcomes.
Objective: To further characterize changes in prevalence of hearing loss and noise exposures in the US pediatric population over time.
Design, setting, and participants: This is a retrospective analysis of demographic and audiometric data from the Third National Health and Nutrition Examination Survey (NHANES III, 1988-1994), NHANES 2005-2006, NHANES 2007-2008, and NHANES 2009-2010. The NHANES are nationally representative survey data sets collected and managed by the US National Center for Health Statistics, and this study includes a total of 7036 survey participants ages 12 to 19 years with available audiometric measurements.
Exposures: Hearing-related behaviors and risk factors such as history of ear infections, noise exposures, firearm use, and hearing protection use.
Main outcomes and measures: Level of hearing loss measured by pure-tone audiometry, as well as high-frequency and low-frequency hearing loss and noise-induced threshold shifts.
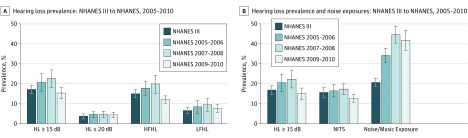
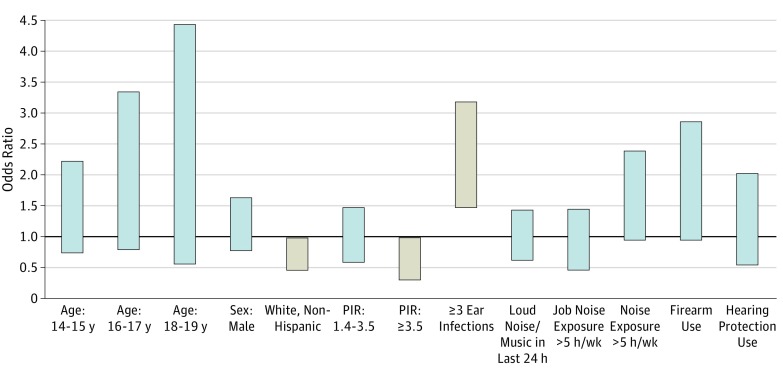
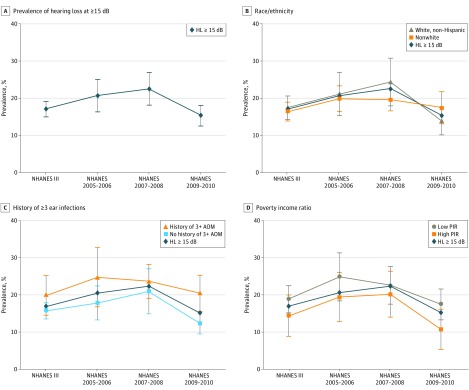
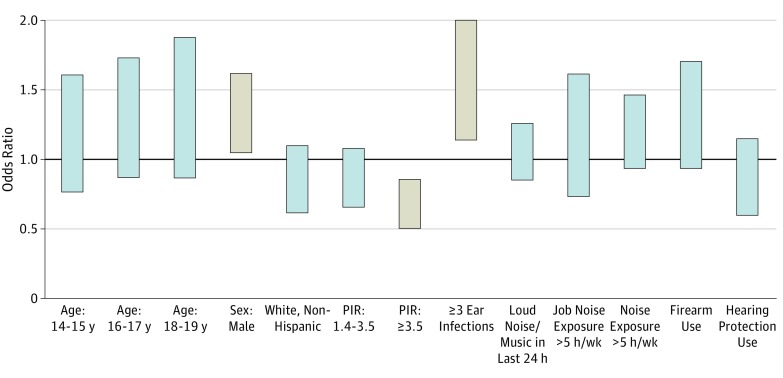
Results: Overall, data from 7036 survey participants ages 12 to 19 years with available audiometric measurements were analyzed. The prevalence of hearing loss increased from NHANES III to NHANES 2007-2008 (17.0% to 22.5% for >15 dB hearing loss; absolute difference, 5.5%; 95% CI, 6.1%-10.3%) but decreased in the NHANES 2009-2010 to 15.2% (absolute difference, 7.2%; 95% CI, 2.0%-12.4%) with no significant overall secular trend identified. There was an overall rise in exposure to loud noise or music through headphones 24 hours prior to audiometric testing from NHANES III to NHANES 2009-2010. However, noise exposure, either prolonged or recent, was not consistently associated with an increased risk of hearing loss across all surveys. The most recent survey cycle showed that nonwhite race/ethnicity and low socioeconomic status are independent risk factors for hearing loss.
Conclusions and relevance: This analysis did not identify significant changes in prevalence of hearing loss in US youth ages 12 to 19 years over this time period despite increases in reported noise exposures. No consistent associations were shown between noise exposure and hearing loss, though there was an association between racial/ethnic minority status and low socioeconomic status and increased risk of hearing loss. Ongoing monitoring of hearing loss in this population is necessary to elucidate long-term trends and identify targets for intervention.
Conflict of interest statement
Figures
Comment in
-
Variations in the Prevalence of Hearing Loss in Children: Truth or Artifact?JAMA Otolaryngol Head Neck Surg. 2017 Sep 1;143(9):935-936. doi: 10.1001/jamaoto.2017.1172. JAMA Otolaryngol Head Neck Surg. 2017. PMID: 28750124 No abstract available.
References
-
- Clark JG. Uses and abuses of hearing loss classification. ASHA. 1981;23(7):493-500. - PubMed
MeSH terms
Grants and funding
LinkOut - more resources
Full Text Sources
Other Literature Sources
Miscellaneous