

Projected temperature-related deaths in ten large U.S. metropolitan areas under different climate change scenarios
- PMID: 28750225
- PMCID: PMC5575805
- DOI: 10.1016/j.envint.2017.07.006
Projected temperature-related deaths in ten large U.S. metropolitan areas under different climate change scenarios
Abstract
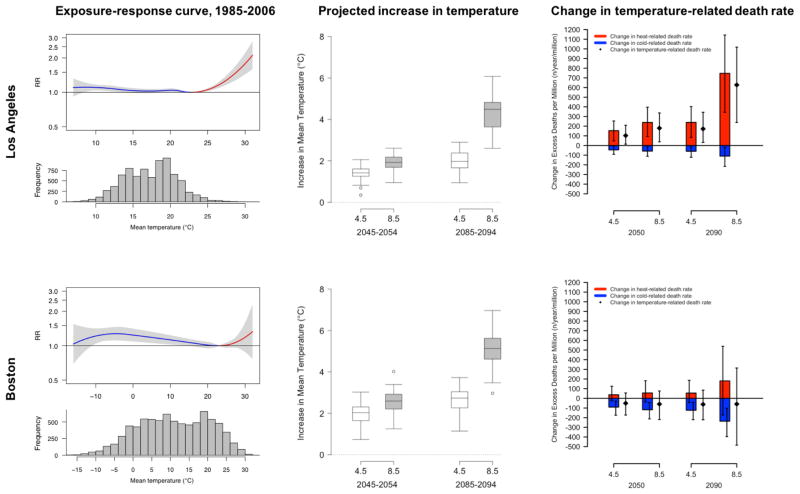
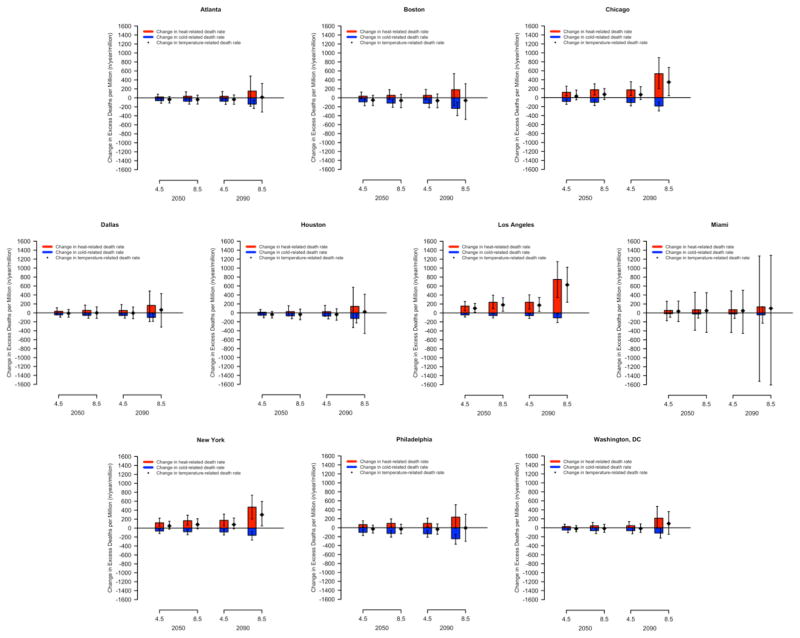
Background: There is an established U-shaped association between daily temperature and mortality. Temperature changes projected through the end of century are expected to lead to higher rates of heat-related mortality but also lower rates of cold-related mortality, such that the net change in temperature-related mortality will depend on location.
Objectives: We quantified the change in heat-, cold-, and temperature-related mortality rates through the end of the century across 10 large US metropolitan areas.
Methods: We applied location-specific projections of future temperature from over 40 downscaled climate models to exposure-response functions relating daily temperature and mortality in 10 US metropolitan areas to estimate the change in temperature-related mortality rates in 2045-2055 and 2085-2095 compared to 1992-2002, under two greenhouse gas emissions scenarios (RCP 4.5 and 8.5). We further calculated the total number of deaths attributable to temperature in 1997, 2050, and 2090 in each metropolitan area, either assuming constant population or accounting for projected population growth.
Results: In each of the 10 metropolitan areas, projected future temperatures were associated with lower rates of cold-related deaths and higher rates of heat-related deaths. Under the higher-emission RCP 8.5 scenario, 8 of the 10 metropolitan areas are projected to experience a net increase in annual temperature-related deaths per million people by 2086-2095, ranging from a net increase of 627 (95% empirical confidence interval [eCI]: 239, 1018) deaths per million in Los Angeles to a net decrease of 59 (95% eCI: -485, 314) deaths per million in Boston. Applying these projected temperature-related mortality rates to projected population size underscores the large public health burden of temperature.
Conclusions: Increases in the heat-related death rate are projected to outweigh decreases in the cold-related death rate in 8 out of 10 cities studied under a high emissions scenario. Adhering to a lower greenhouse gas emissions scenario has the potential to substantially reduce future temperature-related mortality.
Keywords: Ambient temperature; Climate change; Health impacts; United States.
Copyright © 2017 Elsevier Ltd. All rights reserved.
Figures
References
-
- Benmarhnia T, Bailey Z, Kaiser D, Auger N, King N, Kaufman JS. A difference-indifferences approach to assess the effect of a heat action plan on heat-related mortality, and differences in effectiveness according to sex, age, and socioeconomic status (Montreal, Quebec) Environmental Health Perspectives. 2016;124(11):1694–1699. - PMC - PubMed
-
- Bureau of Reclamation; U.S. Department of the Interior, Bureau of Reclamation, Technical Services Center, editor. Downscaled CMIP3 and CMIP5 Climate and Hydrology Projections: Release of Downscaled CMIP5 Climate Projections, Comparison with Preceding Information, and Summary of Users Needs. Denver, Colorado: 2013.
MeSH terms
Grants and funding
LinkOut - more resources
Full Text Sources
Other Literature Sources
Medical
