

Quantitative metagenomics reveals unique gut microbiome biomarkers in ankylosing spondylitis
- PMID: 28750650
- PMCID: PMC5530561
- DOI: 10.1186/s13059-017-1271-6
Quantitative metagenomics reveals unique gut microbiome biomarkers in ankylosing spondylitis
Erratum in
-
Correction to: Quantitative metagenomics reveals unique gut microbiome biomarkers in ankylosing spondylitis.Genome Biol. 2017 Nov 8;18(1):214. doi: 10.1186/s13059-017-1352-6. Genome Biol. 2017. PMID: 29117868 Free PMC article.
Abstract
Background: The assessment and characterization of the gut microbiome has become a focus of research in the area of human autoimmune diseases. Ankylosing spondylitis is an inflammatory autoimmune disease and evidence showed that ankylosing spondylitis may be a microbiome-driven disease.
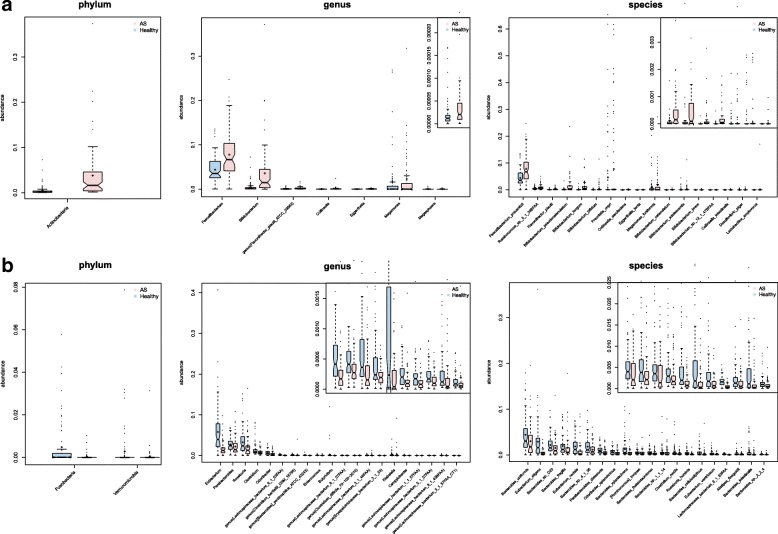
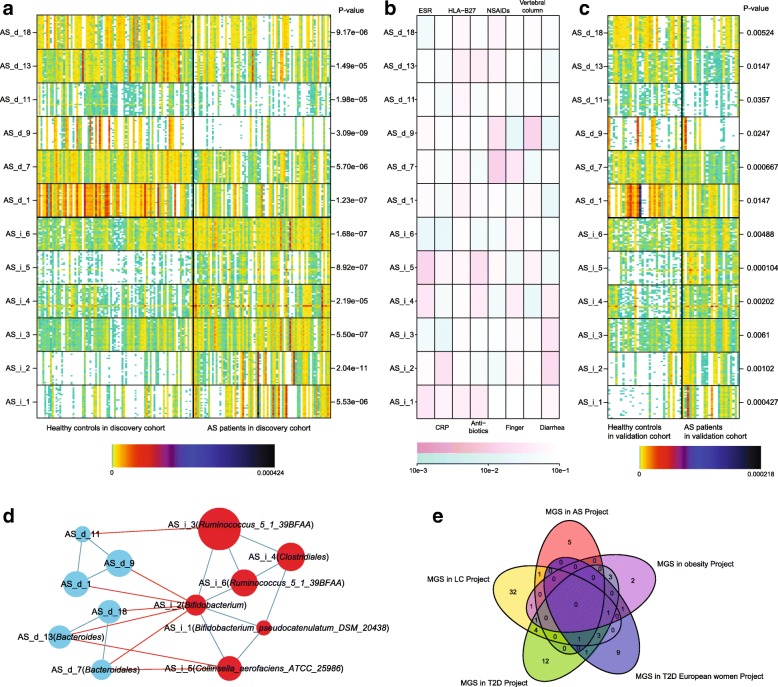
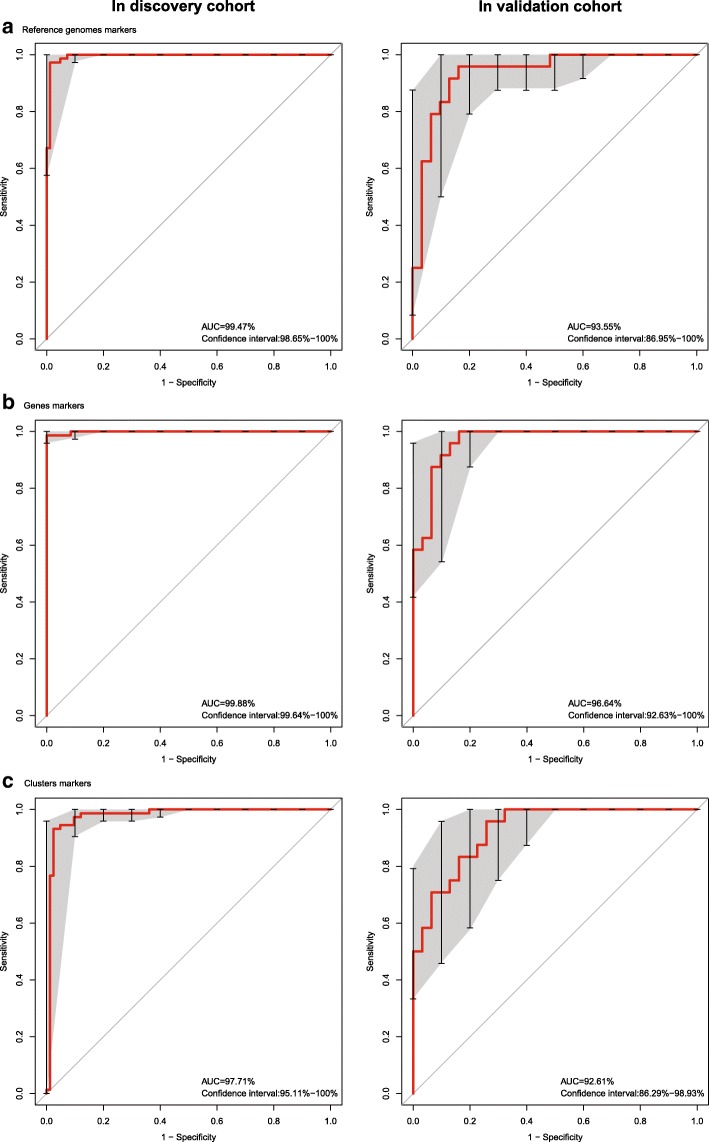
Results: To investigate the relationship between the gut microbiome and ankylosing spondylitis, a quantitative metagenomics study based on deep shotgun sequencing was performed, using gut microbial DNA from 211 Chinese individuals. A total of 23,709 genes and 12 metagenomic species were shown to be differentially abundant between ankylosing spondylitis patients and healthy controls. Patients were characterized by a form of gut microbial dysbiosis that is more prominent than previously reported cases with inflammatory bowel disease. Specifically, the ankylosing spondylitis patients demonstrated increases in the abundance of Prevotella melaninogenica, Prevotella copri, and Prevotella sp. C561 and decreases in Bacteroides spp. It is noteworthy that the Bifidobacterium genus, which is commonly used in probiotics, accumulated in the ankylosing spondylitis patients. Diagnostic algorithms were established using a subset of these gut microbial biomarkers.
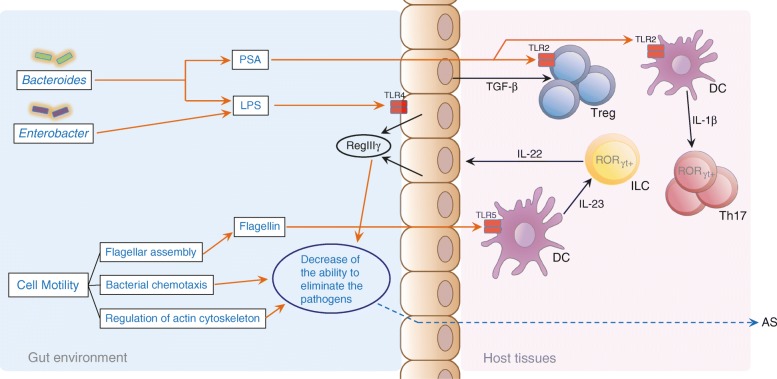
Conclusions: Alterations of the gut microbiome are associated with development of ankylosing spondylitis. Our data suggest biomarkers identified in this study might participate in the pathogenesis or development process of ankylosing spondylitis, providing new leads for the development of new diagnostic tools and potential treatments.
Keywords: Ankylosing spondylitis; Biomarkers; Human gut microbiome; Pathogenesis.
Conflict of interest statement
Ethics approval and consent to participate
After being informed about the purpose of this study, as well as the roles and responsibilities as participants, written informed consent were given by all individuals. The study was approved by the Zhejiang Chinese Medical University Institutional Review Board. Meanwhile, all procedures performed in studies involving human participants were in accordance with the ethical standards of the institutional, national research committee and with the Helsinki Declaration and its later amendments.
Consent for publication
Consent was given by participants to release personal information and related data for publication as needed.
Competing interests
The authors declare that they have no competing interests.
Publisher’s note
Springer Nature remains neutral with regard to jurisdictional claims in published maps and institutional affiliations.
Figures
Similar articles
-
Shotgun metagenomics reveals an enrichment of potentially cross-reactive bacterial epitopes in ankylosing spondylitis patients, as well as the effects of TNFi therapy upon microbiome composition.Ann Rheum Dis. 2020 Jan;79(1):132-140. doi: 10.1136/annrheumdis-2019-215763. Epub 2019 Oct 29. Ann Rheum Dis. 2020. PMID: 31662318
-
Role of gut microbiome in ankylosing spondylitis: an analysis of studies in literature.Discov Med. 2016 Dec;22(123):361-370. Discov Med. 2016. PMID: 28147218 Review.
-
Metagenomic profiling of the pro-inflammatory gut microbiota in ankylosing spondylitis.J Autoimmun. 2020 Feb;107:102360. doi: 10.1016/j.jaut.2019.102360. Epub 2019 Dec 2. J Autoimmun. 2020. PMID: 31806420
-
The correlation between intestinal dysbiosis and the development of ankylosing spondylitis.Microb Pathog. 2019 Jul;132:188-192. doi: 10.1016/j.micpath.2019.04.038. Epub 2019 Apr 27. Microb Pathog. 2019. PMID: 31039390 Review.
-
Metagenomics analysis reveals features unique to Indian distal gut microbiota.PLoS One. 2020 Apr 8;15(4):e0231197. doi: 10.1371/journal.pone.0231197. eCollection 2020. PLoS One. 2020. PMID: 32267865 Free PMC article.
Cited by
-
Partners in Leaky Gut Syndrome: Intestinal Dysbiosis and Autoimmunity.Front Immunol. 2021 Apr 22;12:673708. doi: 10.3389/fimmu.2021.673708. eCollection 2021. Front Immunol. 2021. PMID: 33968085 Free PMC article. Review.
-
Bacterial Contamination of the Surgical Site at the Time of Elective Caesarean Section in Belgian Blue Cows-Part 2: Identified by 16Sr DNA Amplicon Sequencing.Vet Sci. 2023 Jan 26;10(2):94. doi: 10.3390/vetsci10020094. Vet Sci. 2023. PMID: 36851398 Free PMC article.
-
Increasing the diversity of dietary fibers in a daily-consumed bread modifies gut microbiota and metabolic profile in subjects at cardiometabolic risk.Gut Microbes. 2022 Jan-Dec;14(1):2044722. doi: 10.1080/19490976.2022.2044722. Gut Microbes. 2022. PMID: 35311446 Free PMC article. Clinical Trial.
-
[Advances in research on axial spondyloarthritis].Z Rheumatol. 2018 Sep;77(7):609-612. doi: 10.1007/s00393-018-0517-3. Z Rheumatol. 2018. PMID: 30069739 German. No abstract available.
-
No Evidence of a Genetic Causal Relationship between Ankylosing Spondylitis and Gut Microbiota: A Two-Sample Mendelian Randomization Study.Nutrients. 2023 Feb 20;15(4):1057. doi: 10.3390/nu15041057. Nutrients. 2023. PMID: 36839415 Free PMC article.
References
-
- International Genetics of Ankylosing Spondylitis Consortium (IGAS) Cortes A, Hadler J, Pointon JP, Robinson PC, Karaderi T, et al. Identification of multiple risk variants for ankylosing spondylitis through high-density genotyping of immune-related loci. Nat Genet. 2013;45:730–8. doi: 10.1038/ng.2667. - DOI - PMC - PubMed
Publication types
MeSH terms
Substances
LinkOut - more resources
Full Text Sources
Other Literature Sources
Medical
Research Materials
Miscellaneous
