

Review
doi: 10.1016/j.kint.2017.03.052.
Epub 2017 Jul 24.
Label-free molecular imaging of the kidney
Affiliations
- PMID: 28750926
- PMCID: PMC6193761
- DOI: 10.1016/j.kint.2017.03.052
Item in Clipboard
Review
Label-free molecular imaging of the kidney
Kidney Int.
2017 Sep.
Abstract
In this review, we will highlight technologies that enable scientists to study the molecular characteristics of tissues and/or cells without the need for antibodies or other labeling techniques. Specifically, we will focus on matrix-assisted laser desorption/ionization imaging mass spectrometry, infrared spectroscopy, and Raman spectroscopy.
Keywords: advanced-glycation end products; cancer; fibrosis; inflammation; renal biopsy; renal pathology.
Copyright © 2017 International Society of Nephrology. Published by Elsevier Inc. All rights reserved.
Conflict of interest statement
DISCLOSURE
All the authors declared no competing interests.
Figures
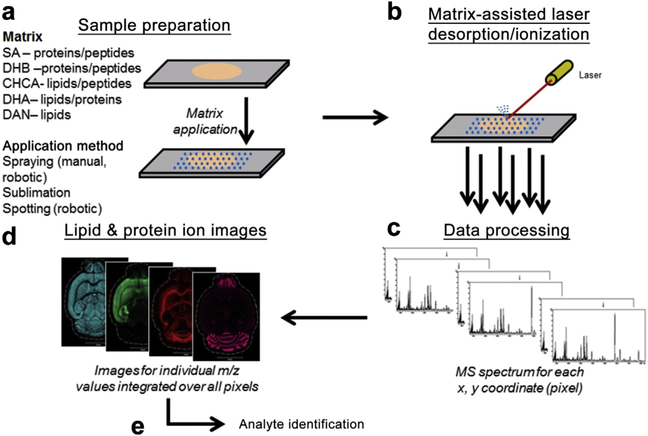
(a) Specimens are prepared for analysis by mounting thinly sliced tissue sections onto slides. Then, matrix application is performed via any number of methods prior to (b) matrix-assisted laser desorption/ionization analysis. (c) Mass spectra generated at each x, y coordinate are then used to (d) construct intensity map images for any single ion of interest. (e) Analyte identification can be performed by 1 or a combination of several techniques. Reprinted with permission from publisher from Prentice BM, Caprioli RM. The need for speed in MALDI imaging mass spectrometry. J Postdoc Res. 2016;4:3–13. Matrix abbreviations are as follows: CHCA, α-acyano-4-hydroxycinnamic acid; DAN, 1,5-diaminonapthalene; DHA, 2,5-dihydroxyacetphenone; DHB, 2,5-dihydroxybenzoic acid; SA, sinapinic acid. To optimize viewing of this image, please see the online version of this article at www.kidney-international.org .

Each color denotes a single molecular entity (red: m/z 750, PE[P-38:4]; yellow: m/z 863, PI[36:1]; green: m/z 885, PI[38:4]; blue: m/z 1,052, SM3[d18:1/24:0]). The image was taken at a 2-μm spatial resolution using a transmission geometry matrix-assisted laser desorption/ionization (MALDI) source. A periodic acid-Schiff–stained microscopy image of a serial tissue section is shown for comparison (left panel). Reprinted with permission from Grove KJ. Imaging Mass Spectrometry for the Elucidation of Lipid and Protein Changes in Diabetic Nephropathy and Assessment of Drug Efficacy [dissertation]. Nashville: Vanderbiltniversity; 2014. To optimize viewing of this image, please see the online version of this article at www.kidney-international.org .
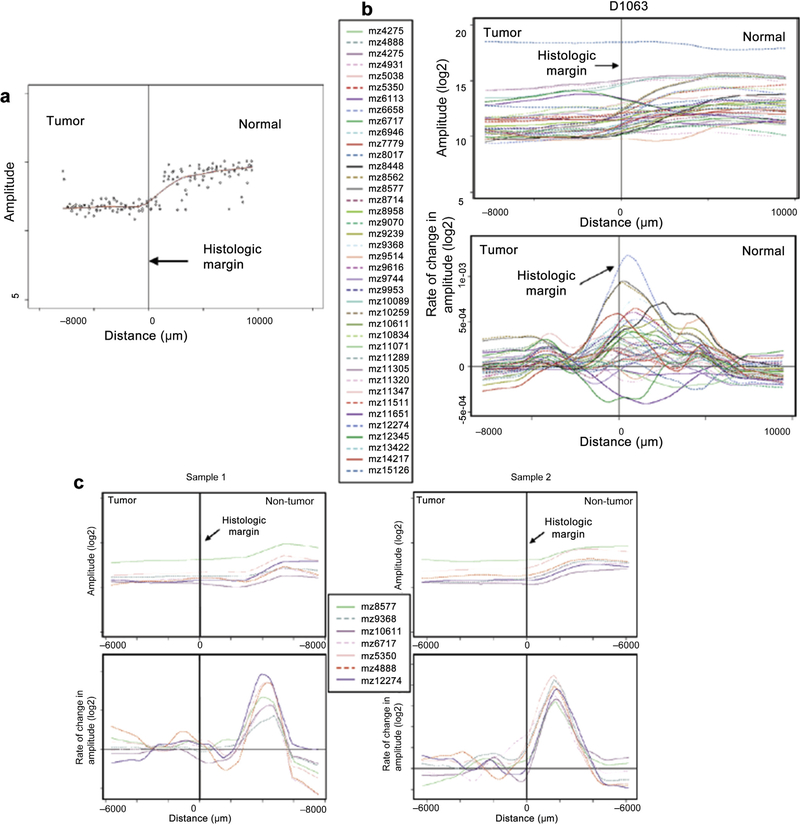
(a) The locally weighted scatterplot smoothing (LOWESS) fit line of scatter plot data. (b) Top: The LOWESS line of 40 selected significant features. Bottom: First derivative of all LOWESS lines x-axis error is approximately (400 μm). (c) LOWESS and corresponding first derivative plots of 7 selected features for 2 representative samples. The notation “mz” represents m/z or the mass-to-charge ratio. Adapted and reprinted with permission from Oppenheimer SR, Mi D, Sanders ME, Caprioli RM. Molecular analysis of tumor margins by MALDI mass spectrometry in renal carcinoma. J Proteome Res. 2010;9:2182–2190. Copyright 2010 American Chemical Society.
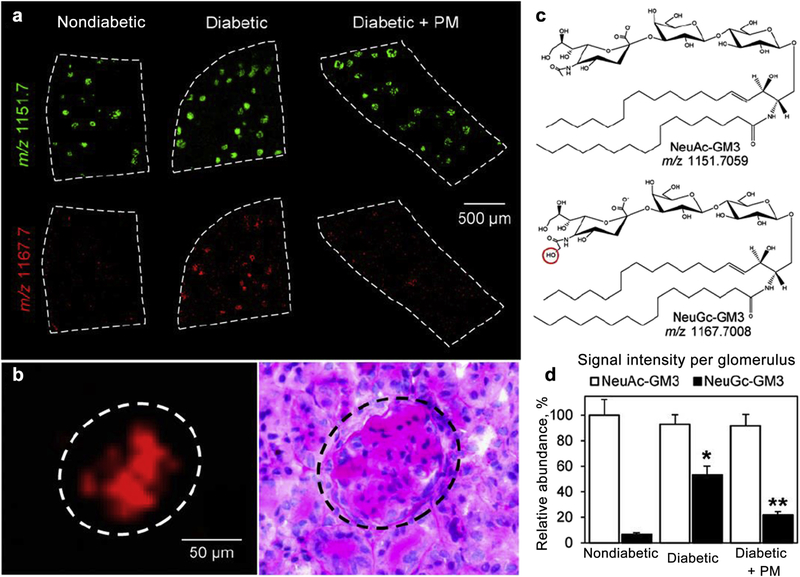
(a) Matrix-assisted laser desorption/ionization time-of-flight imaging mass spectrometry (MALDI TOF IMS) ion images of m/z 1151.7 (NeuAc-GM3) and m/z 1167.7 (NeuGc-GM3) in kidneys of nondiabetic control mice, diabetic mice, and diabetic mice treated with pyridoxamine (PM). MALDI IMS was performed at a 10-μm spatial resolution and was compared with periodic acid-Schiff (PAS) staining of the same section to confirm the localization to glomeruli. (b) IMS of the signal at m/z 1167.7 and corresponding PAS staining showing the specific localization of NeuGc-GM3 to the glomerulus. (c) Structures of gangliosides corresponding to the signals at m/z 1151.7 and m/z 1167.7, as identified using Fourier transform ion cyclotron resonance mass spectrometry. (d) The bar graph represents mean SEM for 3 biological replicates per group analyzing 200 glomeruli in total. The average signal per glomerulus was determined using ImageJ software (U.S. National Institutes of Health, Bethesda, MD), and data were normalized to nondiabetic NeuAc-GM3. *P < 0.05, diabetic versus nondiabetic groups; **P < 0.05, diabetic versus diabetic + PM groups. This research was originally published in the Journal of Lipid Research. Grove KJ, Voziyan PA, Spraggins JM, et al. Diabetic nephropathy induces alterations in the glomerular and tubule lipid profiles. J Lipid Res. 2014;55:1375–1385. Copyright © the American Society for Biochemistry and Molecular Biology. Reprinted with permission. To optimize viewing of this image, please see the online version of this article at www.kidney-international.org .

(a) i; Mass spectrum of crystals isolated from kidney tissues analyzed by liquid chromatography-mass spectrometry (LC-MS). Retention time (Rt) and mass-to-charge ratio (m/z) matches that of the bisulfonamide standard. ii; MS/MS spectrum of 234.98 observed in the crystal isolate. The fragmentation pattern matches that of the bisulfonamide standard. (b) Proton nuclear magnetic resonance spectra of the aromatic proton region of crystals from kidney tissues dissolved in dimethylsulfoxide. (c) Optical images of analyzed tissue sections: i) vehicle control, ii) bisulfonamide standard on vehicle control, iii) compound 1-dosed tissue with a low crystal load, iv) compound 1-dosed tissue with a high density of crystals, and v) compound 2-dosed tissue with a high-crystal load. All samples were coated with sinapinic acid and were analyzed in negative mode on the G2 Synapt. The data was normalized by total ion count. (d) Ion distribution of bisulfonamide (m/z 235) on the tissue sections in panel (c). The color intensity scale is adjusted to 2% of the maximum intensity on tissue v to visualize the distribution patterns on all tissues using the same color intensity scale. This means that pixels on the tissues in panel (d) above this value appear saturated. Data were acquired at a spatial resolution of 100 μm. (e) Ion distribution of bisulfonamide overlaid on tissue sections from the animal with a low crystal load after administering compound 1 (e). Left: Ion distribution image of m/z 235 overlaid on scanned image of tissue sections. Crystals are marked with arrows. Right: Scanned image following hematoxylin and eosin staining of the same tissue with an example of a crystalline deposit in the kidney surrounded by a slight mononuclear cell reaction. Crystals are marked with arrows and circled in green. The size of the majority of the crystals ranged between 50 and 100 μm. Reprinted with permission from Nilsson A, Forngren B, Bjurström S, et al. In situ mass spectrometry imaging and ex vivo characterization of renal crystalline deposits induced in multiple preclinical drug toxicology studies. PLOS One. 2012;7:e47353. http://dx.doi.org/10.1371/journal.pone.0047353 . This work was originally published under the Creative Commons Attribution (CC BY) license. To optimize viewing of this image, please see the online version of this article at www.kidney-international.org .

To assess the distribution of Mn and Zn within the kidney during infection, C57BL/6 or calprotectin (CP)-deficient (S100A9−/−) mice were infected with wild-type (Wt) Staphylococcus aureus or mock infected with phosphate-buffered saline. After 4 days of infection, the tissues were harvested and analyzed by hematoxylin and eosin (H&E) staining (a), matrix-assisted laser desorption/ionization imaging mass spectrometry (MALDI IMS) for CP distribution (b), and laser ablation inductively coupled plasma MS for calcium, Mn, and Zn distribution (c). (b) Scale represents percent maximal ion intensity. To assess the distribution of S100A8, a mass of 10,165 dalton (Da) was mapped. For S100A9, a mass of 12,999 Da was mapped, which corresponds to S100A9 in the complex with a sodium ion. (c) Scale represents absolute ion intensity for the indicated metal. Images are representative of 2 independent experiments. Reprinted with permission from Kehl-Fie TE, Zhang Y, Moore JL, et al. MntABC and MntH contribute to systemic Staphylococcus aureus infection by competing with calprotectin for nutrient mangane. Infect Immun. 2013;81:3395–3405. Copyright © 2013, American Society for Microbiology. To optimize viewing of this image, please see the online version of this article at www.kidney-international.org .
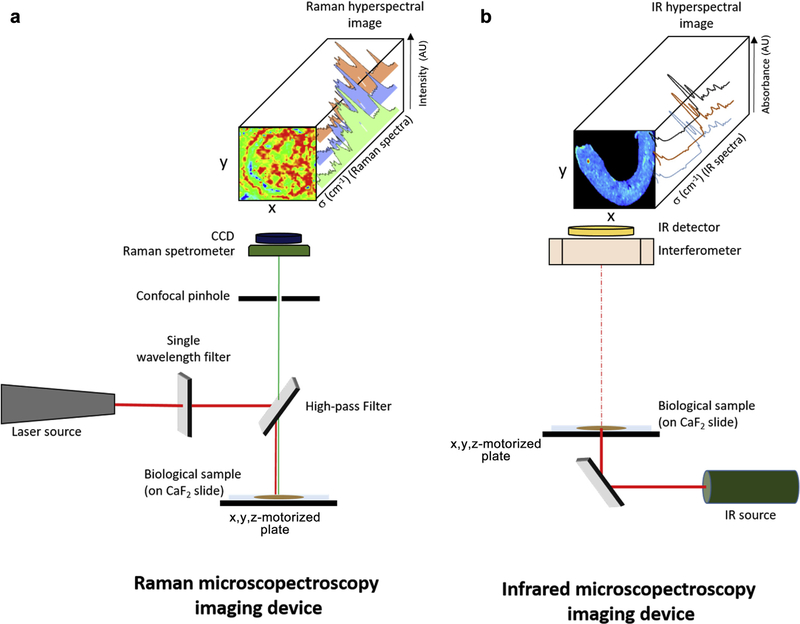
(a) Raman microspectroscopy imaging device: a monochromatic light source (laser) excites a biological sample placed on an x, y, z-motorized plate controlled by a computer. A high-pass filter makes it possible to retain only the generated red-shifted Raman photons that cross a confocal pinhole before being spectrally dispersed and detected by a charge coupled device (CCD) camera. Before the micro-Raman acquisition, the sample is illuminated with a visible light for the delineation of the area of interest. (b) Infrared (IR) microspectroscopy imaging device: the biological sample placed on an x, y, z-motorized plate is illuminated by a light emitted in the mid-IR spectral window. According to their wavelengths, the photons are either absorbed (if the wavelength corresponds to the energy of a molecular vibration) or transmitted. The spectral dispersion is ensured by an interferometric device combined with a Fourier transform operation. Before micro-IR acquisition, the sample is illuminated with a visible light for the delineation of the area of interest. AU, arbitrary unit; CaF2, calcium fluoride. To optimize viewing of this image, please see the online version of this article at www.kidney-international.org .

(a) Spectral image built by computing the intensity ratio between HES (480 cm−1) and tissue (1660 cm−1) signals. Tubular sections are outlined with a dashed line. The color scale represents the intensity ratio: from violet (ratio = 0) to red (ratio = 1). Red areas on certain tubular sections are highlighted while adjacent tubular sections appeared in violet or blue. (b) Raman spectra extracted from 2 points of the spectral image, corresponding to the blue (◆) and red (*) areas. Reprinted with permission from Vuiblet V, Nguyen TT, Wynckel A, et al. Contribution of Raman spectroscopy in nephrology: a candidate technique to detect hydroxyethyl starch of third generation in osmotic renal lesions. The Analyst. 2015;140:7382–7390. To optimize viewing of this image, please see the online version of this article at www.kidney-international.org .

(a) Intratubular calcium oxalate stone (Masson trichrome). (b) Corresponding visualization by polarized light. (c) Corresponding Raman microimaging constructed on the 896 cm−1 vibration. (d) Spectral fingerprint extracted from the Raman image allowing the precise identification of calcium oxalate. AU, arbitrary unit. To optimize viewing of this image, please see the online version of this article at www.kidney-international.org .
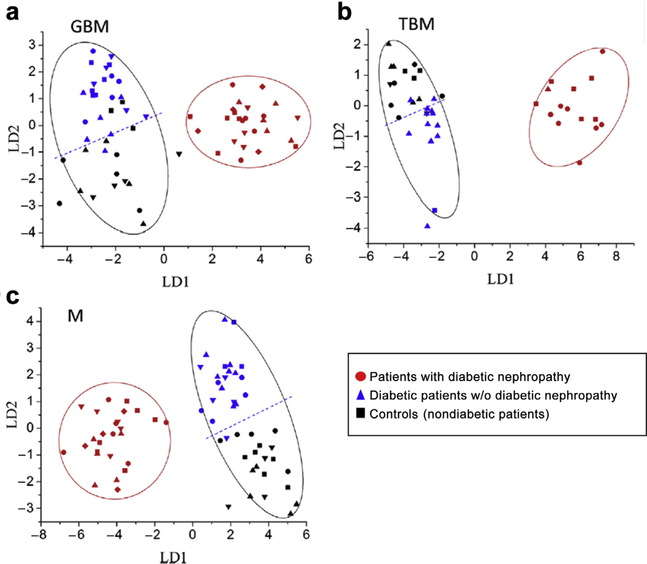
LDA was performed using the complete spectral data set for each of the features studied: (a) GBM, (b) TBM, and (c) M. Each group appears biochemically distinct on the basis of their vibrational signature. The DN group is clearly separated from the other 2 groups. Reprinted with permission from Varma VK, Kajdacsy-Balla A, Akkina SK, et al. A label-free approach by infrared spectroscopic imaging for interrogating the biochemistry of diabetic nephropathy progression. Kidney Int. 2016;89:1153–1259.

(a,d) Masson trichrome–stained sections of 2 renal allograft biopsies. (b,e) Digital image analysis performed using the Masson trichrome–stained sections. Percentages indicate the black pixel (in green on Masson trichrome staining) proportion in the whole tissue section. (c,f) Classified images constructed from the IR prediction model distinguishing 4 different tissue structures (constitutive collagen, fibrosis, normal parenchyma, inflammation). The fibrosis proportions correspond to the indicated percentages. To optimize viewing of this image, please see the online version of this article at www.kidney-international.org .
References
-
- Caprioli RM, Farmer TB, Gile J. Molecular imaging of biological samples: localization of peptides and proteins using MALDI-TOF MS. Anal Chem. 1997;69:4751–4760. - PubMed
-
- McDonnell LA, Heeren RMA. Imaging mass spectrometry. Mass Spectrom Rev. 2007;26:606–643. - PubMed
-
- Spengler B Mass spectrometry imaging of biomolecular information. Anal Chem. 2015;87:64–82. - PubMed
Publication types
MeSH terms
Grants and funding
LinkOut - more resources
Full Text Sources
Other Literature Sources
Medical
