. 2017 Aug 15;114(33):8776-8781.
doi: 10.1073/pnas.1704955114. Epub 2017 Jul 27.

Circadian repressors CRY1 and CRY2 broadly interact with nuclear receptors and modulate transcriptional activity

Affiliations

Circadian repressors CRY1 and CRY2 broadly interact with nuclear receptors and modulate transcriptional activity

Anna Kriebs et al. Proc Natl Acad Sci U S A. .

Abstract

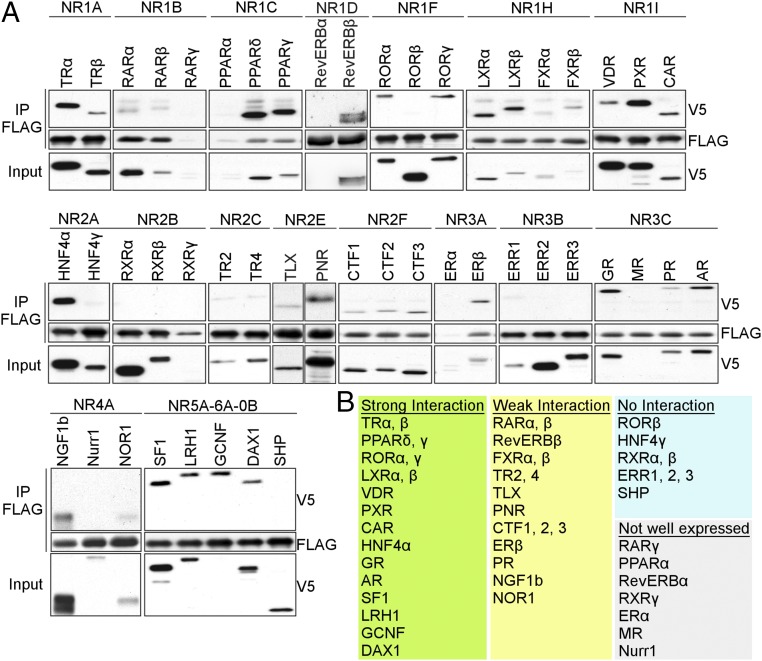
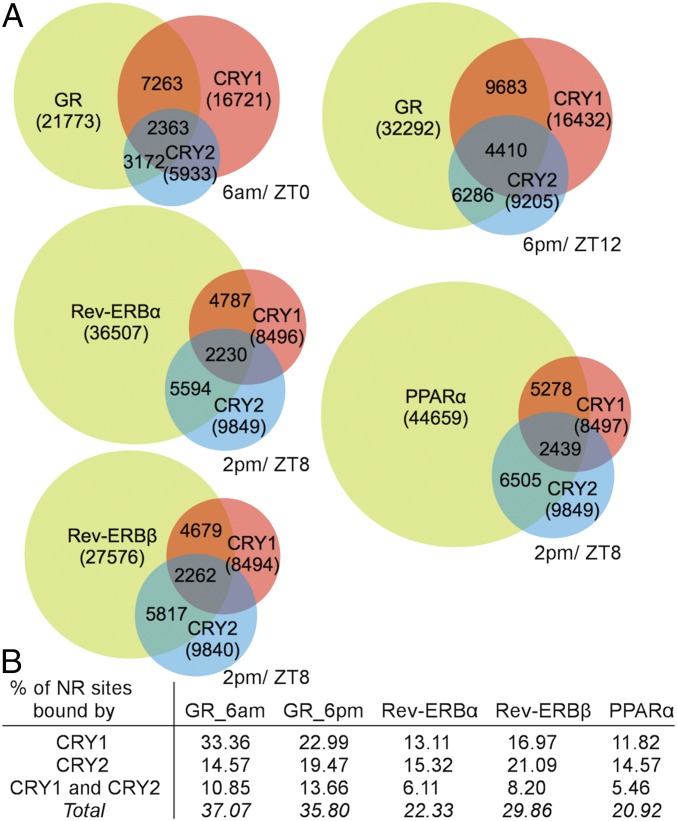
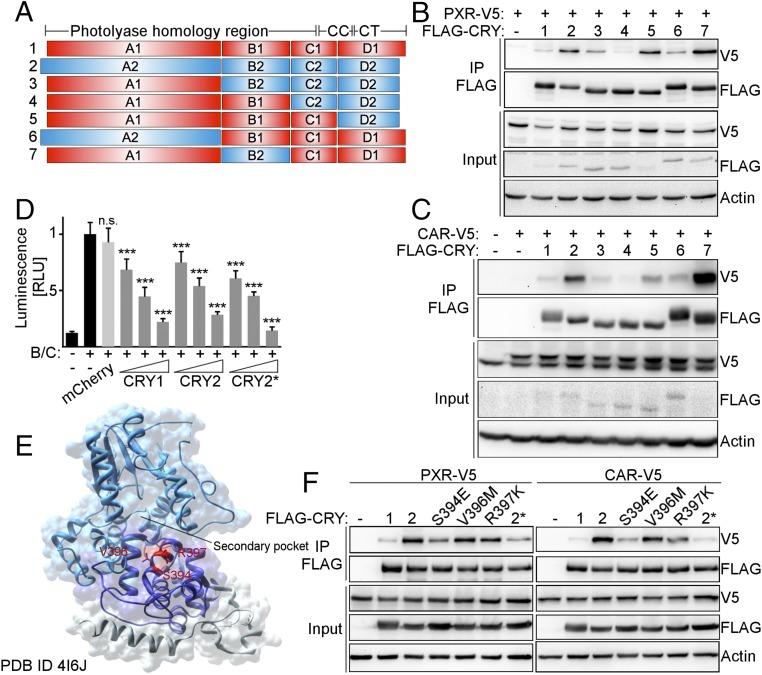
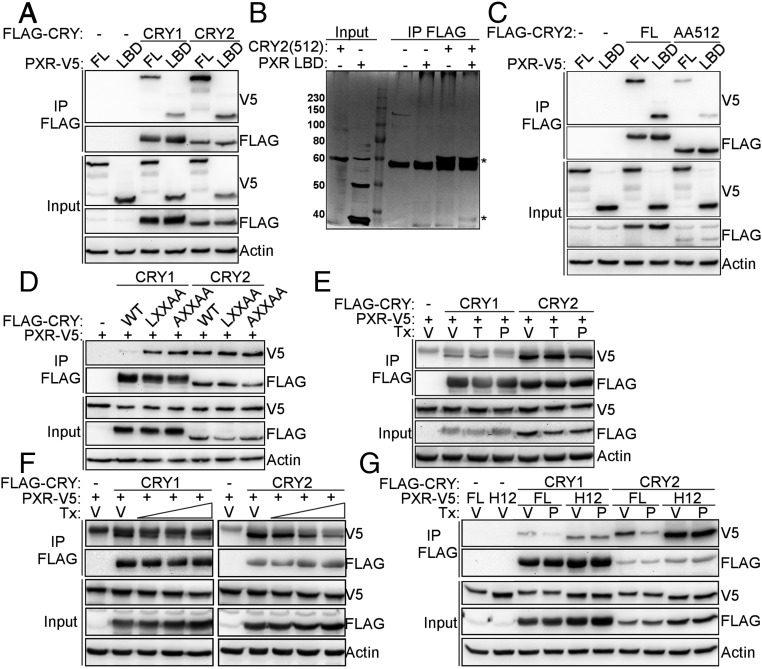
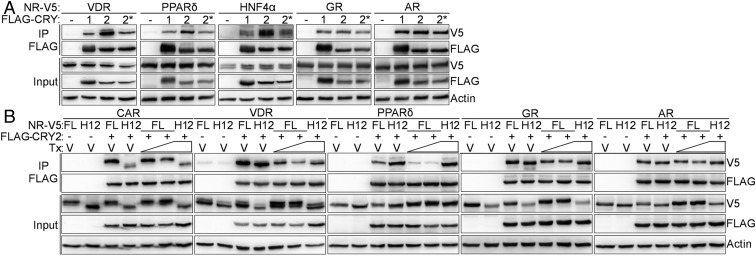
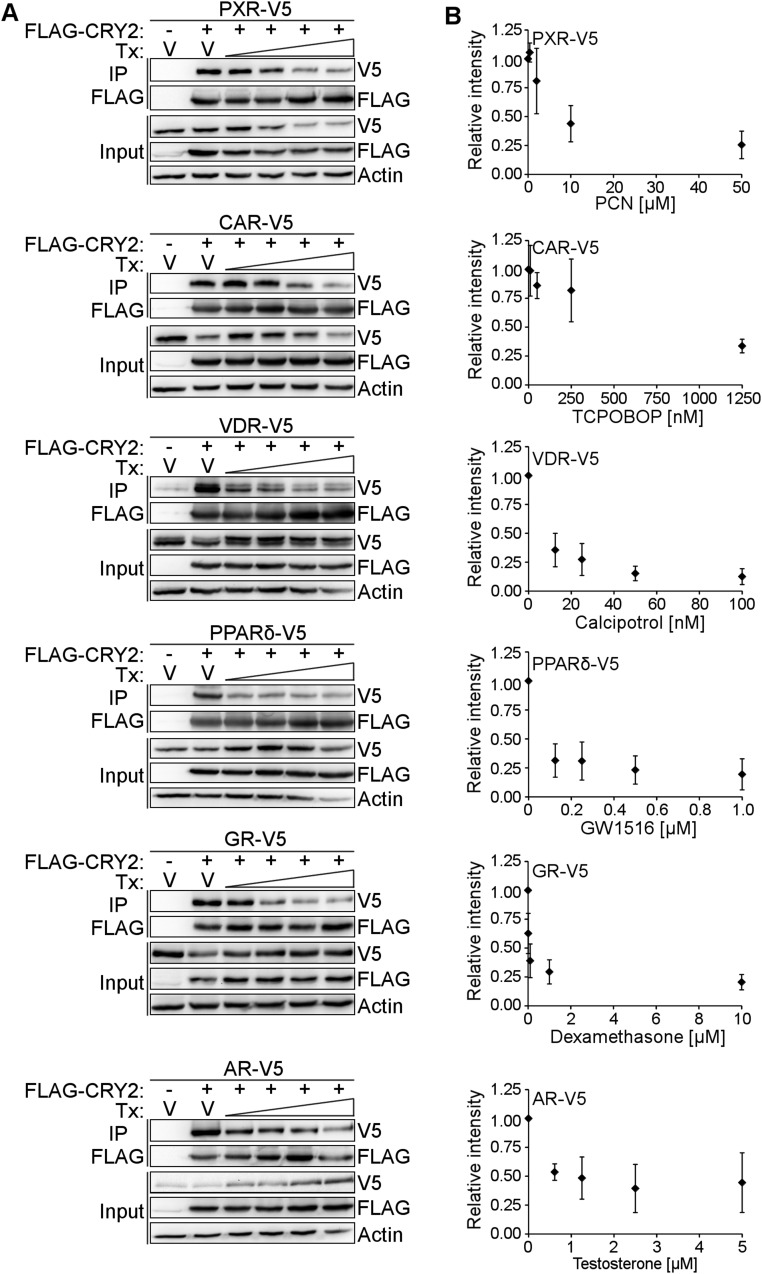
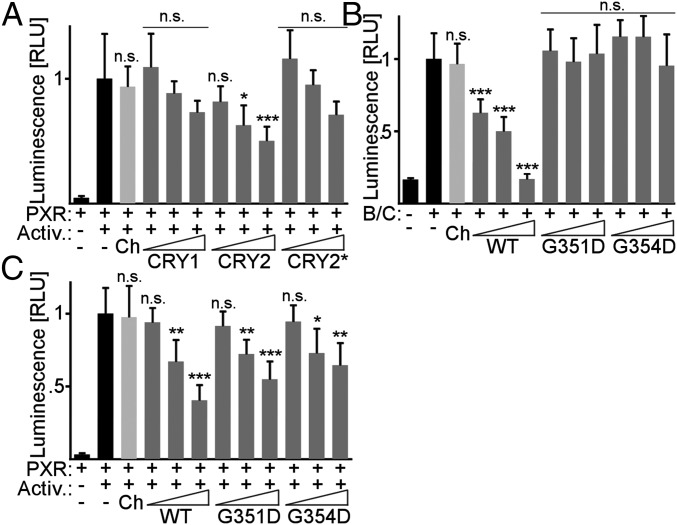
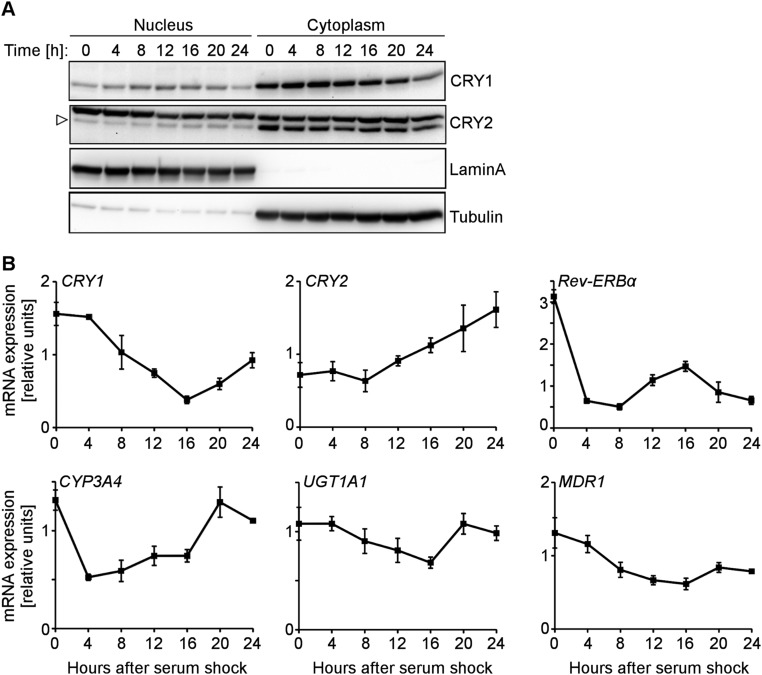
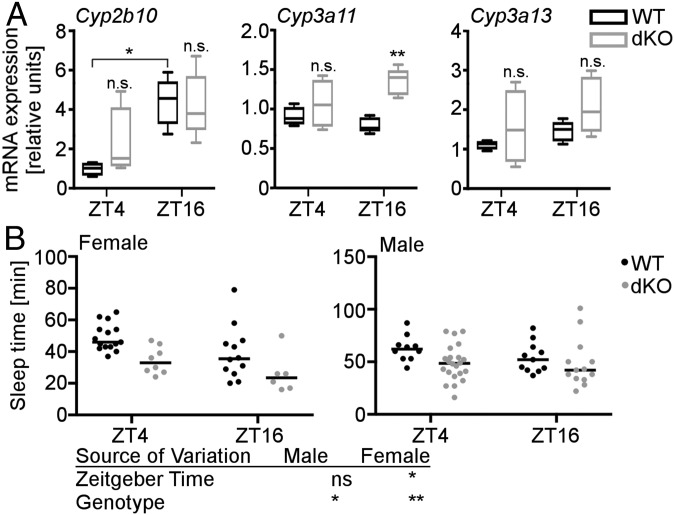
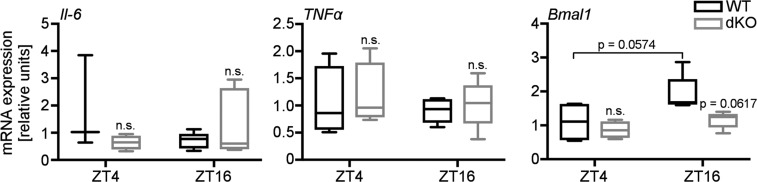
Nuclear hormone receptors (NRs) regulate physiology by sensing lipophilic ligands and adapting cellular transcription appropriately. A growing understanding of the impact of circadian clocks on mammalian transcription has sparked interest in the interregulation of transcriptional programs. Mammalian clocks are based on a transcriptional feedback loop featuring the transcriptional activators circadian locomotor output cycles kaput (CLOCK) and brain and muscle ARNT-like 1 (BMAL1), and transcriptional repressors cryptochrome (CRY) and period (PER). CRY1 and CRY2 bind independently of other core clock factors to many genomic sites, which are enriched for NR recognition motifs. Here we report that CRY1/2 serve as corepressors for many NRs, indicating a new facet of circadian control of NR-mediated regulation of metabolism and physiology, and specifically contribute to diurnal modulation of drug metabolism.

Keywords: circadian; corepressor; cryptochrome; nuclear hormone receptor; xenobiotic metabolism.


Conflict of interest statement

The authors declare no conflict of interest.

Figures

Fig. 1.
Fig. 1.
CRY1 interacts with a subset of nuclear receptors. (A) Co-IP of FLAG-CRY1 with V5-NRs transiently expressed in HEK293T cells. (B) Table listing strongly or weakly interacting NRs, and NRs that were not or only poorly expressed.
Fig. 2.
Fig. 2.
CRYs and NRs co-occupy many sites in the genome. (A) Overlap of DNA binding sites for indicated proteins in mouse liver at matched ZT. Numbers in parentheses represent total number of binding sites for each protein. Numbers in overlapping areas indicate: (Top) total overlap between NR and CRY1; (Middle) total overlap between CRY1, CRY2, and NR; (Bottom) total overlap between CRY2 and NR. (B) Table depicting percent NR sites bound by CRY1 and CRY2.
Fig. 3.
Fig. 3.
The CRY2-NR interaction is disrupted by mutations near the secondary pocket of CRY2. (A) CRY1/2 hybrid constructs (red: CRY1; blue: CRY2). CC, coiled coil; CT, C-terminal tail. (B and C) Co-IP of FLAG-CRY hybrids with V5-PXR (B) and V5-CAR (C) from transfected cells. (D) Repression of BMAL1:CLOCK by CRY1, CRY2, and CRY2*. U2OS cells transiently expressed Per2-luciferase, Bmal1, Clock, and Cry1, Cry2, or Cry2*. mCherry was used as a negative control. Luminescence was normalized to β-Galactosidase activity. (E) CRY2 (PDB ID code 4I6J). A, B, and C domains are light blue, dark blue, and gray, respectively. Amino acids mutated in CRY2* are red. (F) Co-IP of FLAG-CRY1, -CRY2, and -CRY2* with V5-PXR and -CAR from transfected cells. In D, data represent the mean + SD for five to six replicates per condition from one of three experiments. n.s., not significant; ***P < 0.005 vs. BMAL1:CLOCK by t test.
Fig. 4.
Fig. 4.
CRYs exhibit many characteristics of NR corepressors. (A and CG) Proteins detected by Western blot in IPs from 293T cells expressing the indicated plasmids. (B) Silver stain of recombinant proteins after co-IP performed in vitro. An asterisk (*) indicates CRY2(512) and PXR LBD. In D, CRY1/2 CoRNR box-like sequences were mutated as indicated. In EG cells were treated overnight with (E) DMSO (V, vehicle), 250 nM TCPOBOP (T, CAR agonist ligand) or 10 µM PCN (P, PXR agonist ligand), or (F) DMSO (V, vehicle), or 2, 10, and 50 µM PCN (P, PXR agonist ligand), or (G) DMSO (V, vehicle) or 10 µM PCN (P, PXR agonist ligand). Tx, treatment.
Fig. 5.
Fig. 5.
The features of PXR–CRY interaction are reproduced with other NRs. (A and B) Proteins detected by Western blot in FLAG IPs from 293T cells expressing the indicated plasmids. In B, cells were treated with DMSO (V, vehicle) or 100/500 nM TCPOBOP (CAR agonist ligand), 10/100 nM calcipotrol (VDR agonist ligand), 0.1/1 µM GW1516 (PPARδ agonist ligand), 0.1/1 µM dexamethasone (GR agonist ligand), and 0.1/1 µM testosterone (AR agonist ligand) for 6 h in the presence of 10 µM MG132.
Fig. S1.
Fig. S1.
Ligand dose dependently decreases the interaction between CRY2 and NRs. (A) One representative experiment of n = 3. FLAG-tagged CRY2 was coexpressed with V5-tagged PXR, CAR, VDR, PPARδ, GR, and AR in HEK293T cells. Cells were treated with either vehicle (DMSO) or 0.4, 2, 10, 50 µM PCN for PXR; 10, 50, 250, 1,250 nM TCPOBOP for CAR; 12.5, 25, 50, 100 nM calcipitrol for VDR; 0.125, 0.25, 0.5, 1 µM GW1516 for PPARδ; 0.01, 0.1, 1, 10 µM dexamethasone for GR; and 0.625, 1.25, 2.5, 5 µM testosterone for AR. Cells were lysed and FLAG-tagged CRY was precipitated using anti-FLAG antibodies. V5-tagged NRs were detected using anti-V5 immunoblot. (B) Quantification of signal intensities for V5 tagged NRs in IP blots corrected for signal intensities for corresponding FLAG-CRY2 in IP blots. n = 3 independent experiments.
Fig. 6.
Fig. 6.
CRYs repress PXR-driven transcriptional activity. (A) Luciferase activity in HepG2 cells expressing Gal4-luciferase, GAL4 DBD–PXR LBD, and 0.5, 1, or 2 ng of CRY1, CRY2, or CRY2*. PXR was activated by PGC1α expression and 1 µM PCN overnight (Activ.). (B) Luciferase activity in U2OS cells expressing Per2-luciferase, Bmal1, Clock, and 10–50 pg of Cry2 (WT), Cry2G351D (G351D), or Cry2G354D (G354D). (C) Luciferase activity as in A with 0.5, 1, or 2 ng of Cry2 (WT), Cry2G351D (G351D), or Cry2G354D (G354D). In AC mCherry (Ch) was used as a negative control and luminescence was normalized to β-galactosidase activity. Data represent the mean + SD for five to six replicates per condition from a representative of at least three experiments. n.s., not significant; RLU, relative luminescence units; *P < 0.05, **P < 0.01, ***P < 0.005 vs. PXR+activators in A, C, or BMAL1:CLOCK in B by t test.
Fig. S2.
Fig. S2.
HepaRG cells reconstitute xenobiotic metabolism in vitro. (A) HepaRG cell differentiation over 4 wk in culture. Immunofluorescent staining of hepatocyte maker protein albumin in HepaRG cells at low density, in confluent cells (1 wk postseeding), and in differentiated cells (4 wk postseeding) imaged with Axio Imager M1 (Zeiss) 40× objective (total magnification 400×). (B) qPCR analysis of Albumin and xenobiotic genes PXR, CAR, CYP3A4, CYP2B6 mRNA expression in HepaRG cells at low density and differentiated cells. (C) Induction of PXR and CAR target gene expression by agonist ligand. Differentiated HepaRG cells were treated with 10 µM rifampicin (PXR agonist ligand) or 500 µM phenobarbital (CAR agonist ligand) for 8 h. The expression of CYP3A4 and CYP2B6 mRNA was measured using qPCR. (D) HepaRG cells stably expressing shRNAs targeting CRY1 or CRY2. Whole-cell lysate was prepared from HepaRG cells harboring shSCR, shCRY1, or shCRY2. CRY protein expression was detected using anti-CRY1 or anti-CRY2 antibody. (E and F) PXR and CAR expression after CRY protein knock down. PXR and CAR expression was measured using qPCR analysis of mRNA prepared form shSCR, shCRY1, or shCRY2 HepaRG cells. (G and H) PXR and CAR target genes expression after CRY protein knock down. Differentiated shSCR, shCRY1, shCRY2, and shPXR or shCAR HepaRG cells were treated with 50 µM rifampicin (PXR agonist ligand) or 500 µM phenobarbital (CAR agonist ligand) overnight. CYP3A4 or CYP2B6 expression was measured using qPCR. Error bars represent the mean ± SD for three replicates per condition. n.s., not significant; *P ≤ 0.05, **P < 0.01, ***P < 0.001 vs. vehicle treated in C, shSCR in E and F, and vehicle treated shSCR in G and H by t test.
Fig. S3.
Fig. S3.
HepaRG cell circadian clocks can be synchronized. (A) HepaRG cell circadian rhythms were synchronized using 2-h treatment with 50% horse serum. Nuclear and cytosolic lysates were prepared at indicated times after synchronization. CRY protein expression was detected using CRY1- or CRY2-specific antibodies. For antibody validation, see Fig. S2D. (B) HepaRG cell circadian rhythms were synchronized as described above and mRNA was prepared from cells collected at indicated times after synchronization. Clock and xenobiotic gene expression was measured using qPCR. Error bars represent the mean ± SD for three replicates per condition.
Fig. 7.
Fig. 7.
CRY-deficient mice exhibit reduced anesthesia sleep time. (A) Cyp2b10, Cyp3a11, and Cyp3a13 gene expression in livers from female dKO mice and WT littermates. n = 4–5 female animals per group. *P < 0.05, **P < 0.01, ***P < 0.005 by t test. (B) Duration of ketamine induced sleep in dKO mice and WT littermates. n (female) = 6–15 per genotype, n (male) = 10–22 per genotype. n.s., not significant; *P < 0.05, **P < 0.01 by two-way ANOVA.
Fig. S4.
Fig. S4.
Inflammatory gene expression in WT and dKO livers. Il-6, TNFα, and Bmal1 expression in livers from female dKO mice and WT littermates. P values calculated by t test.

Similar articles

Cited by

References

    1. Sonoda J, Pei L, Evans RM. Nuclear receptors: Decoding metabolic disease. FEBS Lett. 2008;582:2–9. - PMC - PubMed
    1. Gustafson CL, Partch CL. Emerging models for the molecular basis of mammalian circadian timing. Biochemistry. 2015;54:134–149. - PMC - PubMed
    1. Zhang R, Lahens NF, Ballance HI, Hughes ME, Hogenesch JB. A circadian gene expression atlas in mammals: Implications for biology and medicine. Proc Natl Acad Sci USA. 2014;111:16219–16224. - PMC - PubMed
    1. Zhao X, et al. Nuclear receptors rock around the clock. EMBO Rep. 2014;15:518–528. - PMC - PubMed
    1. Yang X, et al. Nuclear receptor expression links the circadian clock to metabolism. Cell. 2006;126:801–810. - PubMed

Publication types

MeSH terms