. 2017 Oct 15;23(20):6138-6150.
doi: 10.1158/1078-0432.CCR-17-1232. Epub 2017 Jul 27.

Association of FGFR1 with ERα Maintains Ligand-Independent ER Transcription and Mediates Resistance to Estrogen Deprivation in ER+ Breast Cancer

Affiliations

Association of FGFR1 with ERα Maintains Ligand-Independent ER Transcription and Mediates Resistance to Estrogen Deprivation in ER+ Breast Cancer

Luigi Formisano et al. Clin Cancer Res. .

Erratum in

Abstract

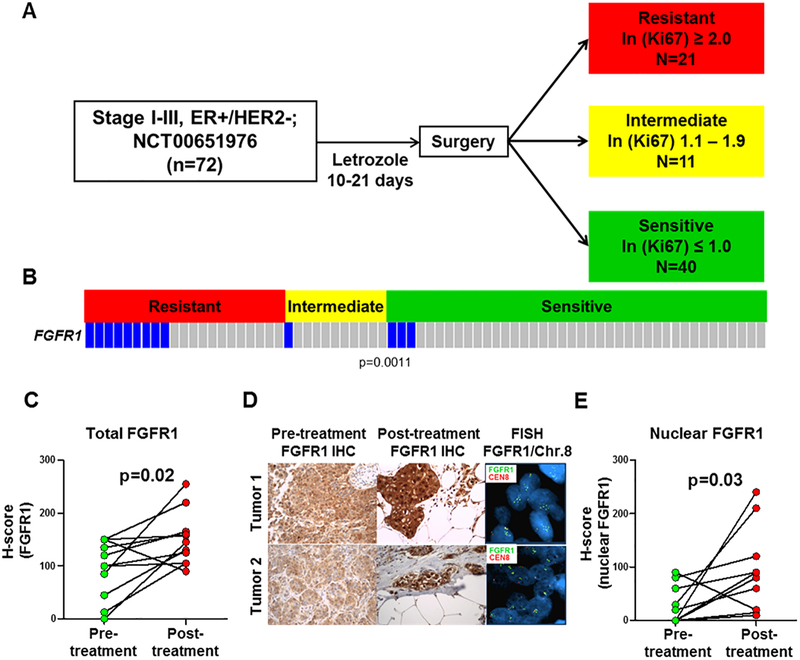
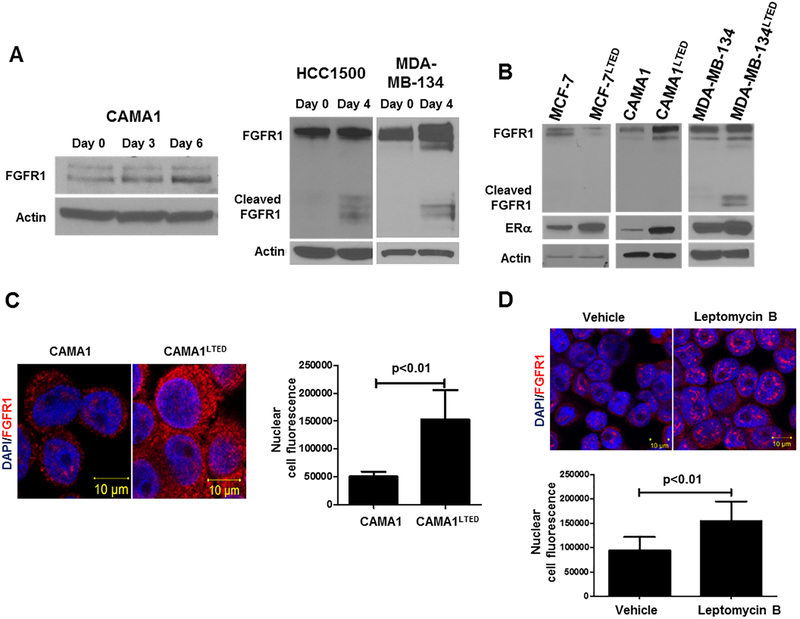
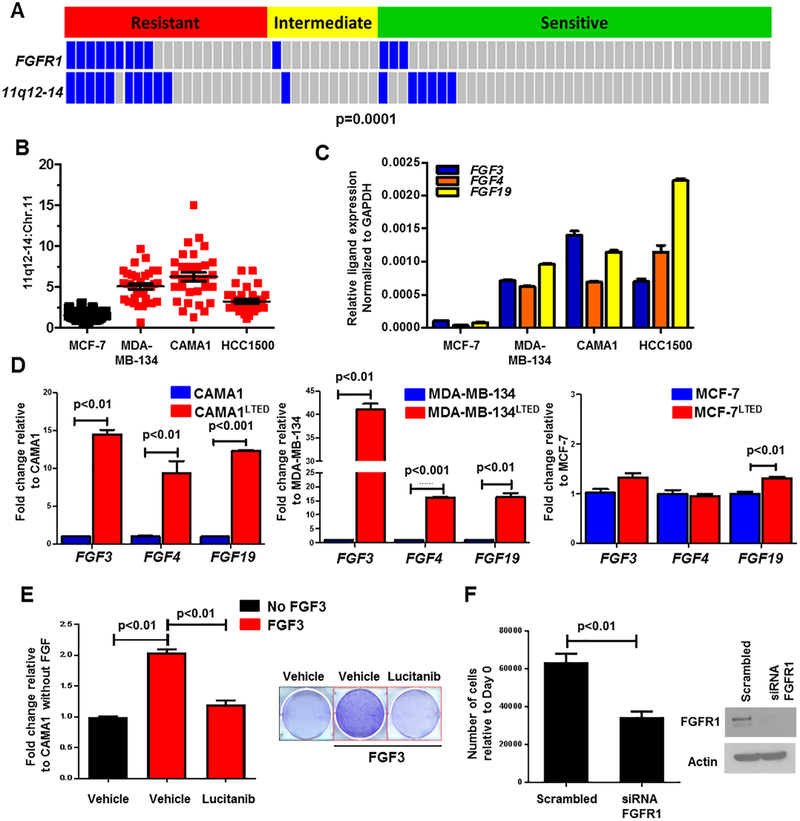
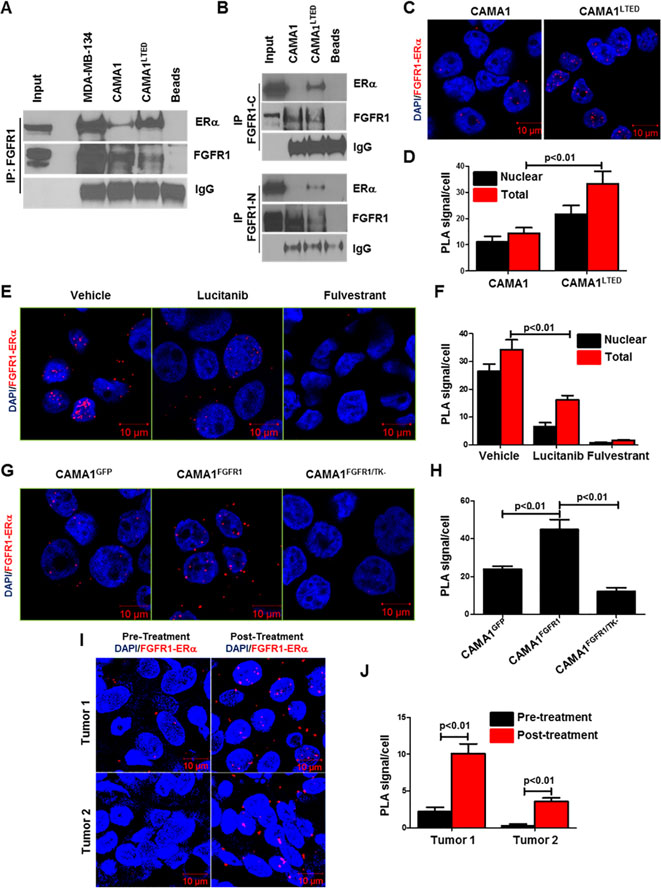
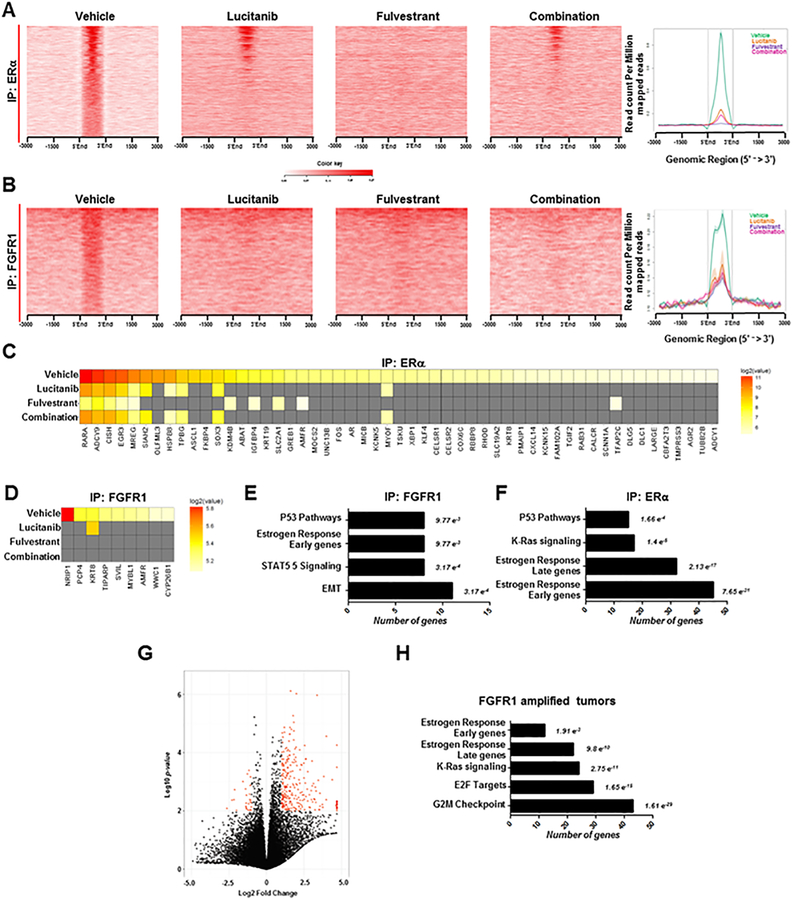
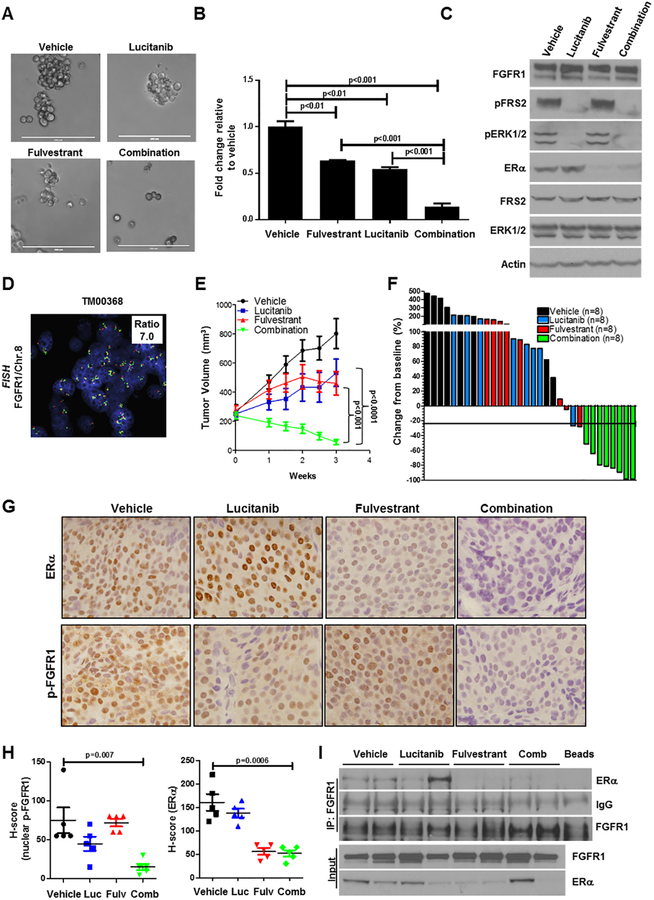
Purpose:FGFR1 amplification occurs in approximately 15% of estrogen receptor-positive (ER+) human breast cancers. We investigated mechanisms by which FGFR1 amplification confers antiestrogen resistance to ER+ breast cancer.Experimental Design: ER+ tumors from patients treated with letrozole before surgery were subjected to Ki67 IHC, FGFR1 FISH, and RNA sequencing (RNA-seq). ER+/FGFR1-amplified breast cancer cells, and patient-derived xenografts (PDX) were treated with FGFR1 siRNA or the FGFR tyrosine kinase inhibitor lucitanib. Endpoints were cell/xenograft growth, FGFR1/ERα association by coimmunoprecipitation and proximity ligation, ER genomic activity by ChIP sequencing, and gene expression by RT-PCR.Results: ER+/FGFR1-amplified tumors in patients treated with letrozole maintained cell proliferation (Ki67). Estrogen deprivation increased total and nuclear FGFR1 and FGF ligands expression in ER+/FGFR1-amplified primary tumors and breast cancer cells. In estrogen-free conditions, FGFR1 associated with ERα in tumor cell nuclei and regulated the transcription of ER-dependent genes. This association was inhibited by a kinase-dead FGFR1 mutant and by treatment with lucitanib. ChIP-seq analysis of estrogen-deprived ER+/FGFR1-amplified cells showed binding of FGFR1 and ERα to DNA. Treatment with fulvestrant and/or lucitanib reduced FGFR1 and ERα binding to DNA. RNA-seq data from FGFR1-amplified patients' tumors treated with letrozole showed enrichment of estrogen response and E2F target genes. Finally, growth of ER+/FGFR1-amplified cells and PDXs was more potently inhibited by fulvestrant and lucitanib combined than each drug alone.Conclusions: These data suggest the ERα pathway remains active in estrogen-deprived ER+/FGFR1-amplified breast cancers. Therefore, these tumors are endocrine resistant and should be candidates for treatment with combinations of ER and FGFR antagonists. Clin Cancer Res; 23(20); 6138-50. ©2017 AACR.


Conflict of interest statement

Conflict of Interest: The authors have declared no conflicts of interest

Figures

Figure 1.
Figure 1.. FGFR1 amplification and overexpression associate with endocrine resistance in ER+ breast cancer.
A, Clinical trial schema: Patients with stage I-III, ER+/HER2– breast cancer were treated with letrozole for 10–21 days. Surgery was performed following treatment and tumor response was categorized by calculating the natural log (ln) of the post-letrozole Ki67 score as determined by IHC analysis. B, FGFR1 amplification, determined by FISH, was significantly associated with resistant vs. intermediate or sensitive tumors (p<0.05, Student’s t-test). C-E, FFPE sections from FGFR1-amplified tumors were stained for FGFR1; the percent of FGFR1-positive tumor cells and staining intensity were assessed in both the cytoplasmic and nuclear compartments by a blinded expert breast pathologist (M.V.E.) to generate an H-score (D). The percent of cytoplasmic and nuclear FGFR1+ tumor cells and their staining intensity were assessed by a blinded expert pathologist (M.V.E.) to generate an H-score. Total and nuclear FGFR1 H-scores are shown in C and E, respectively (Student’s t-test). Both total and nuclear FGFR1 staining was higher in post-treatment tumor sections.
Figure 2.
Figure 2.. Estrogen deprivation increases nuclear and cytosolic FGFR1 expression.
A, Immunoblot analysis of lysates from CAMA1, HCC1500 and MDA-MB-134 cells exposed to short-term estrogen deprivation up to 6 days revealed an increase in FGFR1 expression over time. HCC1500 cells showed increased expression of the cleaved form of FGFR1. B, Immunoblot analysis of parental and LTED ER+ cell lines following 24 h of estrogen deprivation revealed an increase in FGFR1 and ERα in FGFR1-amplified CAMA1LTED and MDA-MB-134LTED cells but not in FGFR1 non-amplified MCF-7 cells. C, Proximity ligation assay (PLA) to detect FGFR1 expression. Analysis of red, amplified loci by confocal microscopy confirmed immunoblot and FISH results in that CAMA1LTED cells harbor more cytosolic and nuclear FGFR1 compared to CAMA1 parental cells. Each bar in the graph to the right of the PLA image represents the mean nuclear fluorescent signals ± SD of 3 wells. D, Immunofluorescence (IF) was performed in CAMA1 cells treated with vehicle or 30 ng/mL leptomycin B for 2 h. Nuclear localization of FGFR1 was detected by confocal microscopy. Each bar represents the mean nuclear fluorescent signals ± SD of 3 wells.
Figure 3.
Figure 3.. FGF3/4/19 expression is upregulated upon estrogen deprivation.
A, FISH analysis of primary tumor sections showed co-amplification of FGFR1 and 11q12–14 mainly in letrozole-resistant vs. intermediate and sensitive cancers (p=0.0001, Student’s t-test). B, Co-amplification of 11q12–14 was observed in ER+/FGFR1-amplified cell lines MDA-MB-134, CAMA1 and HCC1500; the Y axis shows the 11q12–14:Chr.11 ratio. C, Relative transcript expression of FGF3/4/19 in the indicated cell lines was determined by qPCR as described in Methods. D, Transcript levels of FGF3/4/19 were higher in FGFR1-amplified LTED cells (CAMA1 and MDA-MB-134) but not in FGFR1 non-amplified MCF-7LTED cells compared to their parental counterparts (Student’s t-test). E, CAMA1 cells were treated with 100 ng/mL FGF3 ± 2 μM lucitanib in estrogen-free medium. After 15 days, plates were washed and stained with crystal violet and their imaging intensity was quantified by spectrophotometric detection. Representative images and quantification of the integrated intensity values as % of vehicle-treated controls are shown (Student’s t-test). F, CAMA1 cells were plated in 100-mm dishes and transfected with FGFR1 or control siRNAs as described in Methods. Medium containing 100 ng/mL FGF3 was replenished every 3 days. Seven days later, monolayers were harvested and cell counts determined using a Coulter Counter. Each bar in the left panel represents the mean cell number ± SD of triplicate wells (Student’s t-test). FGFR1 knockdown was confirmed by immunoblot analysis of cell lysates from plates treated identically in parallel (right panel).
Figure 4.
Figure 4.. Long-term estradiol deprivation increases the interaction of FGFR1 with ERα.
A, FGFR1 was precipitated from MDA-MB-134, CAMA1 and CAMA1LTED cell lysates; immune complexes were separated by SDS-PAGE and subjected to immunoblot analysis with an ERα antibody. CAMA1LTED cells exhibited greater levels of FGFR1-ERα co-immunoprecipitation compared to CAMA1 cells. B, FGFR1 was precipitated from CAMA1 and CAMA1LTED nuclear extracts with C-terminal (Abcam) and N-Terminal (Cell Signaling) FGFR1 antibodies; immune complexes were separated by SDS-PAGE and analyzed by ERα immunoblot. C-D, PLA of CAMA1LTED cells showed greater nuclear co-localization of FGFR1 and ERα compared to parental CAMA1 cells. PLA foci/cell are quantified in D. E-F, CAMA1LTED cells were treated with 2 μM lucitanib or 1 μM fulvestrant for 6 h. Monolayers were subjected to PLA as described in Methods. Quantification of FGFR1-ERα complexes as PLA signals/cell is shown in (F). Each bar represents the mean ± SD of 3 wells. G-H, CAMA1 cells were stable transfected with expression vectors encoding GFP, FGFR1 and FGFR1/TK– (K514M TK mutant), as described in Methods, and then plated in chamber slides followed by PLA. Quantification of FGFR1-ERα complexes as PLA signals/cell is shown in (H). Each bar represents the mean ± SD of 3 wells. I-J, Paired pre- and post-letrozole primary tumor sections were subjected to PLA as described in Methods. Post-letrozole tumor cells exhibited more FGFR1-ERα complexes compared to pre-treatment tumor cells as quantitated in J. Each bar represents the mean PLA signals/cell ± SD of 20 cells counted in each of 4 high-power fields.
Figure 5.
Figure 5.. Identification of FGF-sensitive ERα and FGFR1 genomic binding sites.
A-B, CAMA1 cells were plated in estrogen-free medium and stimulated with 100 ng/mL FGF3 for 6 h in the presence of 1 μM fulvestrant, 2 μM lucitanib or the combination. Cells were harvested and subjected to ChIP-seq as described in Methods. Shown are heatmaps generated from ChIP-seq analysis of ERα (A) and FGFR1 (B) DNA binding. Treatment with fulvestrant, lucitanib or the combination reduced binding of ERα (A) or FGFR1 (B) binding to DNA. Heatmaps represent the mean of two different experiments. C-D, Heatmaps of ChIP-seq data showing the effects of fulvestrant, lucitanib or the combination on DNA/ERα-associated (C) and DNA/FGFR1-associated (D) genes, respectively, as shown in A-B. E-F, Gene set enrichment analysis (GSEA) of FGFR1- and ERα-associated genes. Numbers to the right of each bar represent the False Discovery Rate (FDR) q-value. G, Volcano plot analysis of differentially expressed genes in tumors from patients treated with letrozole in the clinical trial. Each data point represents the ratio of the average expression for a particular gene in FGFR1-amplified tumors (n=7) vs. FGFR1 non-amplified tumors (n=25). The red dots in the Volcano plot represent genes that are significantly up- or down-regulated >2-fold with p<0.01. H, GSEA of significantly enriched genes in FGFR1-amplified relative to FGFR1 non-amplified tumors showed that ERα-related pathways are still active in estrogen-deprived (by letrozole treatment) ER+/FGFR1-amplified primary tumors (G). Numbers to the right of each bar represent the FDR q-value.
Figure 6.
Figure 6.. Combined blockade of FGFR1 and ERα potently inhibits growth of ER+/FGFR1-amplified breast cancers.
A-B, CAMA1 cells were cultured in 3D Matrigel as described in Methods and treated with vehicle, 2 μM lucitanib, 1 μM fulvestrant or the combination. After 15 days, images were captured from 3 different fields using a CK40 microscope. Quantitation of representative images is shown in (B). Each bar represents the fold change in colony number relative to vehicle ± SD of three replicate wells repeated twice (Student’s t-test). C, CAMA1 cells in were treated as in A & B for 6 h, after which lysates were prepared and subjected to immunoblot analyses with the indicated antibodies. E, ER+/HER2–/FGFR1-amplified TM00368 PDXs were established in ovariectomized SCID/beige mice implanted with a s.c. 21-day relase, 0.25-mg 17β-estradiol pellet. Once tumors reached ≥200 mm3, mice were randomized to treatment with vehicle, fulvestrant (5 mg/kg/week), lucitanib (7 mg/kg/day), or both drugs for 3 weeks. Each data point represents the mean tumor volume in mm3 ± SD (n=8 per arm; ANOVA test). F, Bar graph showing the % change in volume in individual TM00368 PDXs after three weeks of treatment relative to tumor volumes on day 0 (baseline). G-H, TM00368 tumors were harvested at the end of treatment. FFPE tumor sections were prepared and subjected to IHC with Y653/4 phosphorylated FGFR1 and ERα antibodies as described in Methods. The percent of phospho-FGFR1+ and ER+ tumor cells and their staining intensity was assessed by an expert breast pathologist (M.V.E.) blinded to treatment to generate an H-score. Nuclear phospho-FGFR1 and ERα H-scores are shown Student’s t-test). I, FGFR1 was precipitated from lysates of TM00368 tumors harvested at the end of treatment; immune complexes were separated by SDS-PAGE and subjected to immunoblot analysis with the indicated antibodies. Bottom two lanes show FGFR1 and ERα content in lysates before i.p.

Similar articles

Cited by

References

    1. Courjal F, Cuny M, Simony-Lafontaine J, Louason G, Speiser P, Zeillinger R, et al. Mapping of DNA amplifications at 15 chromosomal localizations in 1875 breast tumors: definition of phenotypic groups. Cancer Res. 1997;57(19):4360–7. - PubMed
    1. Jacquemier J, Adelaide J, Parc P, Penault-Llorca F, Planche J, deLapeyriere O, et al. Expression of the FGFR1 gene in human breast-carcinoma cells. Int J Cancer. 1994;59(3):373–8. - PubMed
    1. Reis-Filho JS, Simpson PT, Turner NC, Lambros MB, Jones C, Mackay A, et al. FGFR1 emerges as a potential therapeutic target for lobular breast carcinomas. Clin Cancer Res. 2006;12(22):6652–62. - PubMed
    1. Gorringe KL, Jacobs S, Thompson ER, Sridhar A, Qiu W, Choong DY, et al. High-resolution single nucleotide polymorphism array analysis of epithelial ovarian cancer reveals numerous microdeletions and amplifications. Clin Cancer Res. 2007;13(16):4731–9. - PubMed
    1. Simon R, Richter J, Wagner U, Fijan A, Bruderer J, Schmid U, et al. High-throughput tissue microarray analysis of 3p25 (RAF1) and 8p12 (FGFR1) copy number alterations in urinary bladder cancer. Cancer Res. 2001;61(11):4514–9. - PubMed

MeSH terms

Substances