. 2017 Aug 30;37(35):8330-8348.
doi: 10.1523/JNEUROSCI.3141-16.2017. Epub 2017 Jul 27.

Optogenetic Central Amygdala Stimulation Intensifies and Narrows Motivation for Cocaine

Affiliations

Optogenetic Central Amygdala Stimulation Intensifies and Narrows Motivation for Cocaine

Shelley M Warlow et al. J Neurosci. .

Abstract

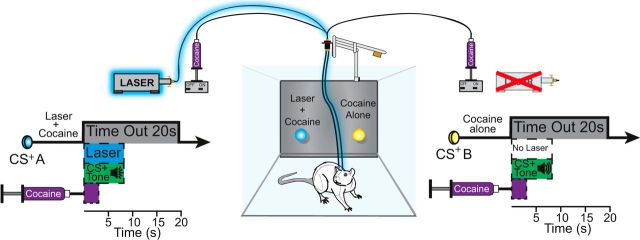
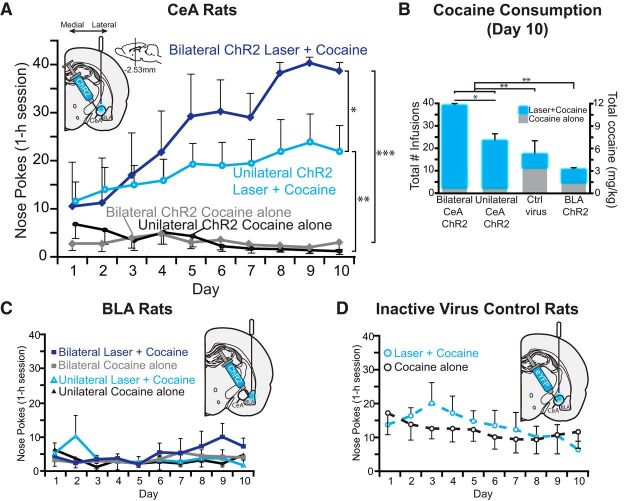
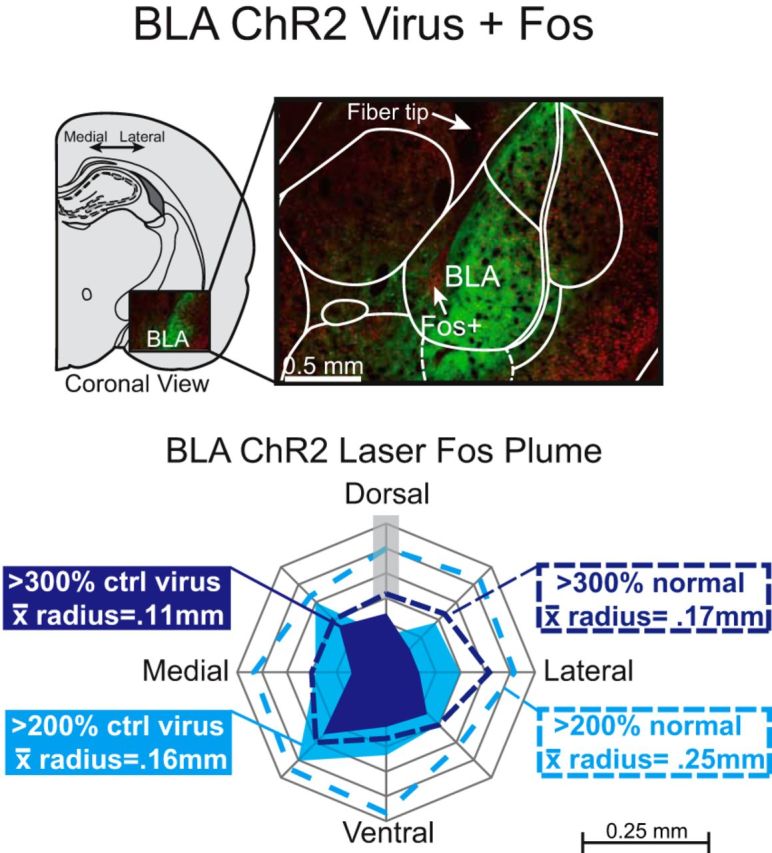
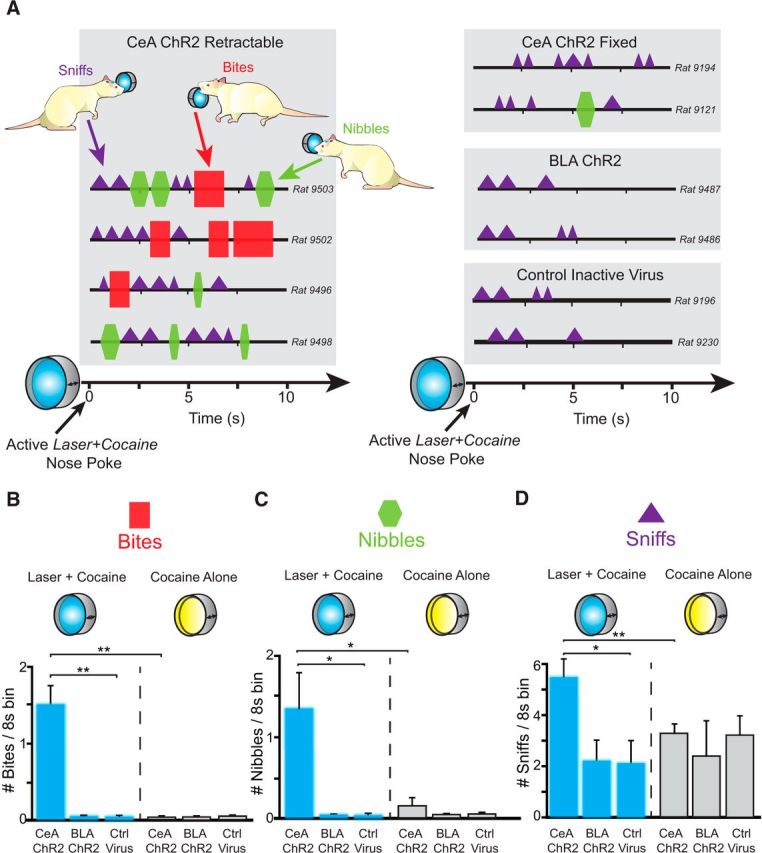
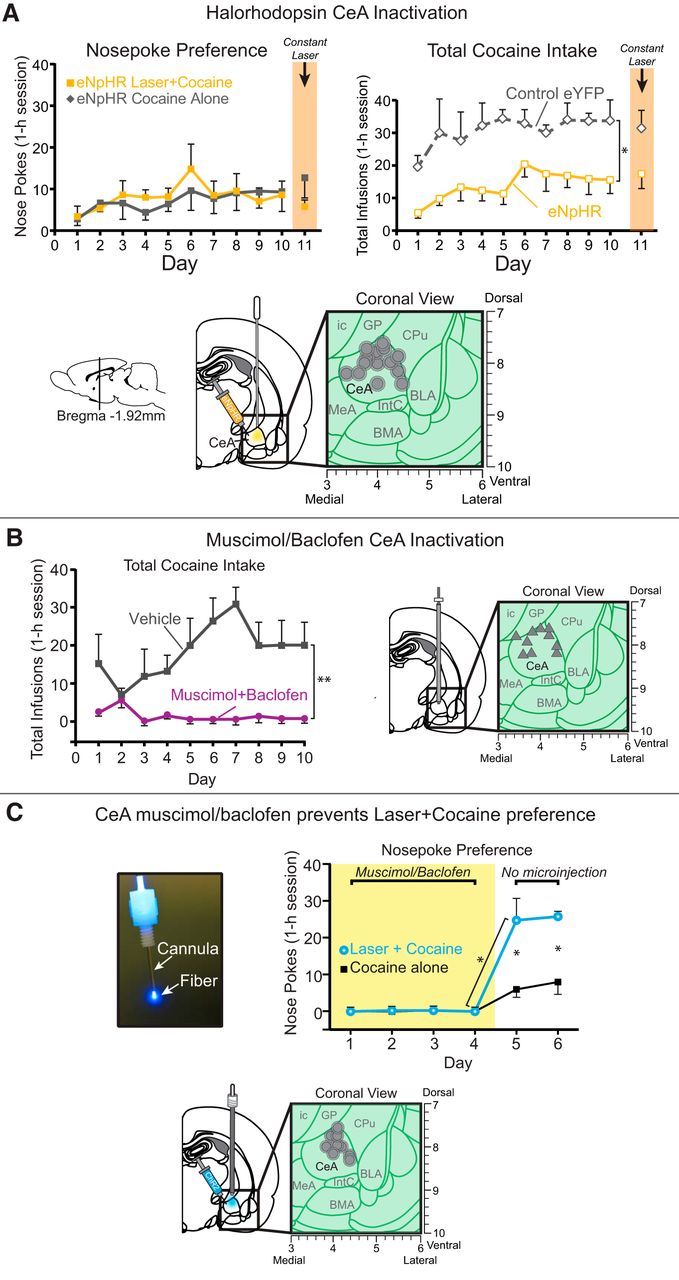
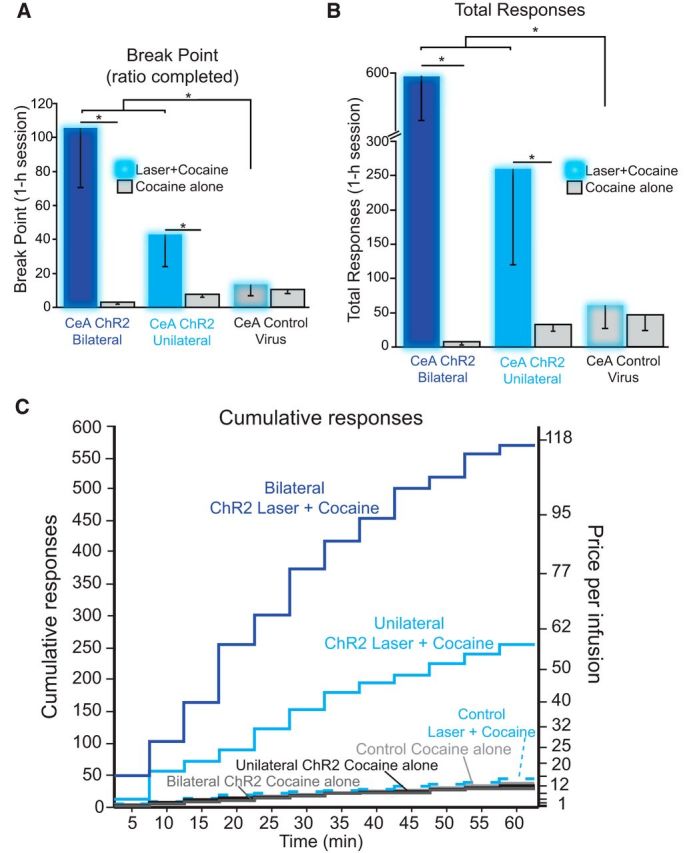
Addiction is often characterized by intense motivation for a drug, which may be narrowly focused at the expense of other rewards. Here, we examined the role of amygdala-related circuitry in the amplification and narrowing of motivation focus for intravenous cocaine. We paired optogenetic channelrhodopsin (ChR2) stimulation in either central nucleus of amygdala (CeA) or basolateral amygdala (BLA) of female rats with one particular nose-poke porthole option for earning cocaine infusions (0.3 mg/kg, i.v.). A second alternative porthole earned identical cocaine but without ChR2 stimulation. Consequently, CeA rats quickly came to pursue their CeA ChR2-paired cocaine option intensely and exclusively, elevating cocaine intake while ignoring their alternative cocaine alone option. By comparison, BLA ChR2 pairing failed to enhance cocaine motivation. CeA rats also emitted consummatory bites toward their laser-paired porthole, suggesting that higher incentive salience made that cue more attractive. A separate progressive ratio test of incentive motivation confirmed that CeA ChR2 amplified rats' motivation, raising their breakpoint effort price for cocaine by 10-fold. However, CeA ChR2 laser on its own lacked any reinforcement value: laser by itself was never self-stimulated, not even by the same rats in which it amplified motivation for cocaine. Conversely, CeA inhibition by muscimol/baclofen microinjections prevented acquisition of cocaine self-administration and laser preference, whereas CeA inhibition by optogenetic halorhodopsin suppressed cocaine intake, indicating that CeA circuitry is needed for ordinary cocaine motivation. We conclude that CeA ChR2 excitation paired with a cocaine option specifically focuses and amplifies motivation to produce intense pursuit and consumption focused on that single target.SIGNIFICANCE STATEMENT In addiction, intense incentive motivation often becomes narrowly focused on a particular drug of abuse. Here we show that pairing central nucleus of amygdala (CeA) optogenetic stimulation with one option for earning intravenous cocaine makes that option almost the exclusive focus of intense pursuit and consumption. CeA stimulation also elevated the effort cost rats were willing to pay for cocaine and made associated cues become intensely attractive. However, we also show that CeA laser had no reinforcing properties at all when given alone for the same rats. Therefore, CeA laser pairing makes its associated cocaine option and cues become powerfully attractive in a nearly addictive fashion.

Keywords: addiction; amygdala; intravenous self-administration; motivation; reward.


Figures

Figure 1.
Figure 1.
Instrumental two-choice task. Rats instrumentally nose poked into two different ports, first one at a time and then were allowed to choose between the two for the remainder of each session. One port earned a cocaine infusion (0.3 mg/kg in 50 μl, 2.8 s duration; FR1 schedule) accompanied by a discrete 8 s tone and additional blue laser stimulation (25 Hz, 8–10 mW, 8 s) (laser + cocaine). Nose poking into a second port located on the same wall earned an identical cocaine infusion (0.3 mg/kg in 50 μl, 2.8 s duration) accompanied by a different 8 s tone (cocaine alone). Both choices resulted in a 20 s timeout after cocaine infusion.
Figure 2.
Figure 2.
CeA ChR2 stimulation captures choice for a cocaine reward. A, Rats exclusively pursued their cocaine reward paired with CeA optogenetic ChR2 stimulation: either unilateral CeA laser illumination (unilateral ChR2 laser + cocaine; solid light blue line with circle symbols) or bilateral CeA illumination (bilateral ChR2 laser +cocaine; solid dark blue line with diamond symbols). The cocaine alone option became relatively ignored (unilateral ChR2 cocaine alone; solid black line with circle symbols; bilateral ChR2 cocaine alone; solid gray line with diamond symbols). B, CeA laser resulted in increased cocaine consumption compared with control inactive virus rats and BLA ChR2 rats by the last day of training (day 10). C, In contrast, basolateral amygdala ChR2 simulation failed to enhance cocaine preference whether bilateral stimulation was earned (bilateral ChR2 laser + cocaine; solid blue lines with blue squares vs bilateral cocaine alone; solid gray lines with gray squares) or unilateral stimulation was earned (unilateral ChR2 laser + cocaine; solid blue lines with blue triangles vs unilateral cocaine alone; solid black lines with black triangles). D, Similarly, control inactive virus rats lacking ChR2 gene chose equally between the two cocaine options (laser + cocaine; dashed blue line with gray circles and blue outline vs cocaine alone; dashed black line with gray circles and black outline). CeA ChR2: n = 15, BLA ChR2: n = 6, CeA Control virus: n = 5. Data are shown as mean ± SEM *p < 0.05, **p < 0.01, ***p < 0.001.
Figure 3.
Figure 3.
Localization of function maps. Maps show behavioral effects in the two-choice task of corresponding amygdala sites in Figure 2. At each sagittal, coronal, and horizontal view, the outermost boundaries of CeA and BLA are shown at varying medial/lateral levels (sagittal view; ML 3.7 to 4.6 mm from bregma), rostral/caudal levels (coronal view; AP −1.9 to −2.8 mm from bregma), or dorsal/ventral levels (horizontal view; DV −7.6 to −8.6 mm from bregma). The unique boundaries at each level within CeA or BLA are shown as lighter to darker shades (shades of green for CeA and shades of pink for BLA). CeA but not BLA sites of fiber optics enhanced preference for cocaine. Colors depict the preference intensity for laser + cocaine caused by ChR2 laser pairing at that site, expressed as percentage of choice over cocaine alone during the last two sessions of the two-choice test. Sizes of symbols represent the average Fos plume diameter observed in CeA ChR2 and BLA ChR2 after laser stimulation (inner plumes scaled to represent Fos plume elevations >200% above control virus baseline Fos levels 0.2 mm radius; and outer plumes represent Fos plume elevations >150% above baseline Fos levels ∼0.3 mm radius).
Figure 4.
Figure 4.
Anatomical spread of laser-induced CeA Fos plumes and of virus expression. Top, Photomicrographs of CeA show green ChR2 virus expression (CeA ChR2 virus), red Fos protein immunohistochemistry expression stimulated around an fiber-optic tip, induced by laser illumination in a CeA ChR2 rat before euthanasia (CeA ChR2 laser Fos), and overlay photo combining GFP virus infection plus laser-induced Fos plume in the same CeA ChR2 rat (overlay: CeA ChR2 virus + Fos). Magnifications of 150 μm × 150 μm × 40 μm CeA tissue from immediately below the fiber-optic tip depict sample numbers of Fos-expressing neurons in each condition, which were used to help determine the percentage Fos intensity within local plumes induced by laser stimulation. Groups include normal tissue baseline (spontaneous Fos in CeA of a normal unoperated rat), control virus baseline (a control rat with inactive virus in CeA, after local blue laser illumination), CeA ChR2 laser Fos plume (a CeA ChR2 rat after blue laser illumination), and CeA halorhodopsin laser (a CeA halorhodopsin rat after yellow laser illumination). For each magnification, the mean number ± SE of Fos+ neurons per 150 μm × 150 μm × 40 μm tissue sample for that entire condition's group at same anatomical position within CeA plume (relative to fiber tip) is also shown. These numbers were used to calculate the percentage change in local Fos expression at various positions within Fos plume and to establish the borders of laser-induced Fos plumes). Middle, Map on left (CeA ChR2 Virus) shows average mean radius of ChR2 virus spread in CeA from center of infection (virus radius = 0.86 mm, spherical volume = 2.63 mm3). Blue map on right shows laser-induced CeA ChR2 Fos plume (light blue outer zone is the extent of >200% Fos elevation induced by laser illumination (measured relative to baseline levels in control inactive virus rats after similar CeA laser; ∼0.14 mm mean radius). Dark blue inner zone is the extent of higher >300% Fos elevation over inactive virus levels. Note that Fos plumes may extend maximally straight below fiber-optic tip, reflecting downward path of light beam (0.35 mm). Dotted blue lines indicate similar ChR2 elevations relative to normal CeA tissue baselines (illumination of control virus may induce mild Fos elevation over normal tissue levels, perhaps due to heat, virus infection, or surgical penetration). Yellow map below shows Fos suppression caused by yellow laser illumination in CeA halorhodopsin rats (i.e., anti-plume). Outer solid orange plume is the extent of >25% Fos suppression (i.e., Fos reduction to <75% control level) compared with control inactive virus condition after yellow laser (0.25 mm mean radius). Inner solid dark orange plume shows zones of more intense >50% Fos suppression over inactive virus levels (0.072 mm mean radius). Dotted lines depict zones of suppression compared with normal baseline tissue. Bottom, Quantitative comparison of virus infection versus Fos elevation intensity as a function of distance beneath center of fiber-optic tip. Fos is plotted as percentage change from normal tissue Fos baseline (100%) (CeA ChR2 laser Fos plume: blue circles and solid blue lines; halorhodopsin laser Fos: orange downward triangles and solid orange lines; control virus Fos: solid gray diamonds). ChR2 GFP virus intensity is plotted as a percentage change from uninjected tissue (baseline = 0 + 1; CeA virus: green circles with green dashed line). All data are shown as mean ± SEM. Note that Fos elevation falls from peak levels more rapidly with distance than ChR2 virus infection, perhaps reflecting thresholds of light intensity needed to induce Fos in infected neurons.
Figure 5.
Figure 5.
Photomicrograph showing BLA ChR2 Fos protein immunohistochemistry and virus expression in BLA rats similar to Figure 4 around an optic fiber tip, induced by laser illumination before euthanasia (red = Fos, green = ChR2 GFP virus). Outer solid light blue plume is the >200% elevation in Fos plume expression relative to control inactive virus condition after similar BLA laser (0.16 mm mean radius). Inner solid dark blue plume shows >300% Fos elevation over inactive virus levels (0.11 mm mean radius). Dotted lines indicate Fos elevations calculated relative to normal BLA tissue baseline (spontaneous Fos baseline in BLA of unoperated rats).
Figure 6.
Figure 6.
Consummatory bites, nibbles, and sniffs at porthole. A, Topography of behavior toward the laser + cocaine porthole among representative rats from each group (CeA ChR2 rats toward a retractable or fixed port, BLA ChR2, and control inactive virus rats). Each choreograph shows a “typical” response ∼30 min into a session at a porthole during the 8 s after a successful nose poke that earns a cocaine infusion and laser illumination plus accompanying auditory cue. Bites (red squares) and nibbles (green hexagons) predominantly occurred only in CeA ChR2 rats toward their laser + cocaine retractable port, whereas sniffs (purple triangles) were more common toward fixed ports and in other groups. CeA ChR2 rats on average bit (B), nibbled (C), and sniffed (D) at greater numbers during each 8 s bin after successful nose poke of their laser + cocaine retractable porthole (blue bars) compared with both their cocaine alone port (gray bars) or compared with BLA ChR2 and Control inactive virus rats at their laser + cocaine retractable port (blue bars). Data are shown as mean ± SEM. *p < 0.05 **p < 0.01.
Figure 7.
Figure 7.
Loss of CeA function. Optogenetic CeA inhibition does not alter choice, but pharmacological CeA inhibition abolishes cocaine pursuit and laser preference. A, Optogenetic CeA inhibition paired with earning one cocaine reward failed to alter nose poke preference, as CeA halorhodopsin rats (eNpHR; n = 7) chose equally between the laser + cocaine (solid orange lines with orange filled squares) and cocaine alone (solid gray line with gray filled squares). However, over the course of the 10 d, total cocaine intake graph on right shows that halorhodopsin rats (eNpHR; solid orange lines with open squares outlined in orange) self-administered less cocaine infusions compared with control inactive virus rats (control eYFP; n = 2; dashed gray lines with open diamonds outlined in gray). B, Muscimol/baclofen CeA inactivation. Rats receiving microinjections into CeA of muscimol/baclofen (muscimol + baclofen; n = 5; solid purple lines with filled purple circles) self-administered fewer infusions than rats receiving vehicle (vehicle; n = 4; solid gray lines with filled gray circles). C, CeA muscimol/baclofen prevents laser + cocaine preference. When CeA microinjections of muscimol/baclofen were administered for the first 4 d of training, cocaine responding was completely suppressed for both cocaine options in the 2-choice task. As soon as microinjections ceased (starting on days 5–6), CeA ChR2 rats (n = 4) exclusively chose the laser + cocaine option (solid blue lines with blue filled circles) over and above their cocaine alone option (solid black lines with black filled squares), as well as above the prior day when receiving muscimol/baclofen. Data are shown as mean ± SEM. *p < 0.05 **p < 0.01.
Figure 8.
Figure 8.
CeA ChR2 stimulation amplifies breakpoint motivation. A progressive ratio test of breakpoint was given on 2 consecutive days (counterbalanced order). On one day, rats earned laser + cocaine accompanied by its 8 s auditory cue. On the other day, rats earned cocaine alone plus its own 8 s auditory cue. On each day, effort required to obtain the next cocaine infusion increased exponentially after each earned infusion. A, CeA ChR2 rats reached higher breakpoints (maximum effort price rats were willing to pay) for laser + cocaine than for cocaine alone: making more nose pokes overall (B) and (C). Bilateral amygdala laser illumination increased motivation more than unilateral laser illumination in CeA ChR2 rats (CeA ChR2 bilateral; dark blue bars; n = 3; CeA ChR2 unilateral; light blue bars; n = 8). In contrast, control virus rats worked equally hard for cocaine regardless of laser condition and at much lower levels than CeA ChR2 rats did for laser + cocaine (CeA control virus; gray bars; n = 5). Data are shown as mean ± SEM. *p < 0.05.
Figure 9.
Figure 9.
CeA ChR2 laser fails to support self-stimulation. A, In an active spout-touch self-stimulation test, rats failed to touch the spout delivering CeA ChR2 stimulation (25 Hz, 8–10 mW, 1 and 8 s durations, n = 6 and n = 3, respectively) any more than the other control spout that delivered nothing. B, In a passive location-based self-stimulation test, rats neither preferred nor avoided the corner location where CeA ChR2 stimulation was delivered compared with other three corners that lacked laser. In other words, rats simply ignored the laser location (blue laser, 25 Hz, 8–10 mW, 1 and 8 s durations) (n = 4 and n = 3, respectively). Data are shown as mean ± SEM.
Figure 10.
Figure 10.
CeA ChR2 laser alone does not maintain nose-poking. Rats were retrained on the two-choice task to choose between laser + cocaine versus cocaine alone. Starting on day 2, cocaine was removed, but rats could still earn laser stimulation by poking into their previous laser + cocaine port (previously laser + cocaine; dashed blue line with blue filled circles). Pokes into their previous cocaine alone port earned nothing (previously cocaine alone; dashed black lines with black filled circles). When laser stimulation was offered alone, responding declined and rats no longer preferred the laser-delivering port. On subsequent days 6–8, laser was removed and no further decline in responding was observed. A comparison of responding on the last day of laser alone (day 5) and after 3 d of responding for neither laser nor cocaine (nothing; day 8) showed no difference (inset). Data are shown as mean ± SEM.

Similar articles

Cited by

References

    1. Ahn S, Phillips AG (2002) Modulation by central and basolateral amygdalar nuclei of dopaminergic correlates of feeding to satiety in the rat nucleus accumbens and medial prefrontal cortex. J Neurosci 22:10958–10965. - PMC - PubMed
    1. Alheid GF, Heimer L (1988) New perspectives in basal forebrain organization of special relevance for neuropsychiatric disorders: the striatopallidal, amygdaloid, and corticopetal components of substantia innominata. Neuroscience 27:1–39. 10.1016/0306-4522(88)90217-5 - DOI - PubMed
    1. Balleine BW, Killcross S (2006) Parallel incentive processing: an integrated view of amygdala function. Trends Neurosci 29:272–279. 10.1016/j.tins.2006.03.002 - DOI - PubMed
    1. Cai H, Haubensak W, Anthony TE, Anderson DJ (2014) Central amygdala PKC-delta(+) neurons mediate the influence of multiple anorexigenic signals. Nat Neurosci 17:1240–1248. 10.1038/nn.3767 - DOI - PMC - PubMed
    1. Chang SE, Smedley EB, Stansfield KJ, Stott JJ, Smith KS (2017) Optogenetic inhibition of ventral pallidum neurons impairs context-driven salt-seeking. J Neurosci 37:5670–5680. - PMC - PubMed

LinkOut - more resources