. 2017 Jul 27;6(8):e005754.
doi: 10.1161/JAHA.117.005754.

Downregulation of Cavin-1 Expression via Increasing Caveolin-1 Degradation Prompts the Proliferation and Migration of Vascular Smooth Muscle Cells in Balloon Injury-Induced Neointimal Hyperplasia

Affiliations

Downregulation of Cavin-1 Expression via Increasing Caveolin-1 Degradation Prompts the Proliferation and Migration of Vascular Smooth Muscle Cells in Balloon Injury-Induced Neointimal Hyperplasia

Li-Jun Zhou et al. J Am Heart Assoc. .

Abstract

Background: Percutaneous coronary intervention has been widely used in the treatment of ischemic heart disease, but vascular restenosis is a main limitation of percutaneous coronary intervention. Our previous work reported that caveolin-1 had a key functional role in intimal hyperplasia, whereas whether Cavin-1 (another important caveolae-related protein) was involved is still unknown. Therefore, we will investigate the effect of Cavin-1 on neointimal formation.

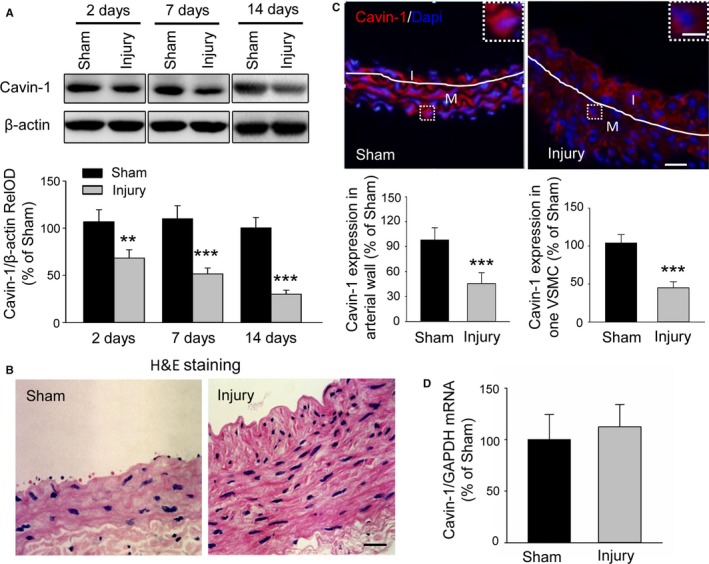
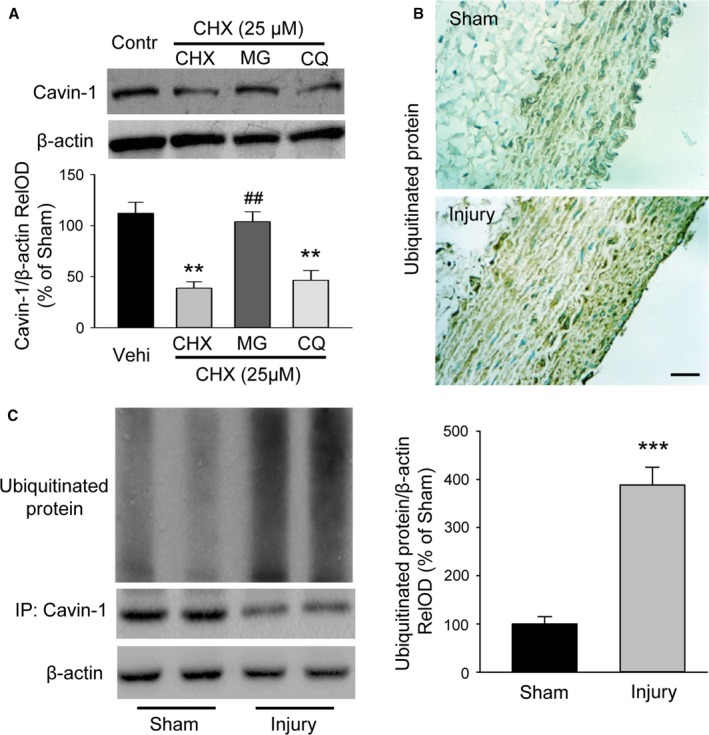
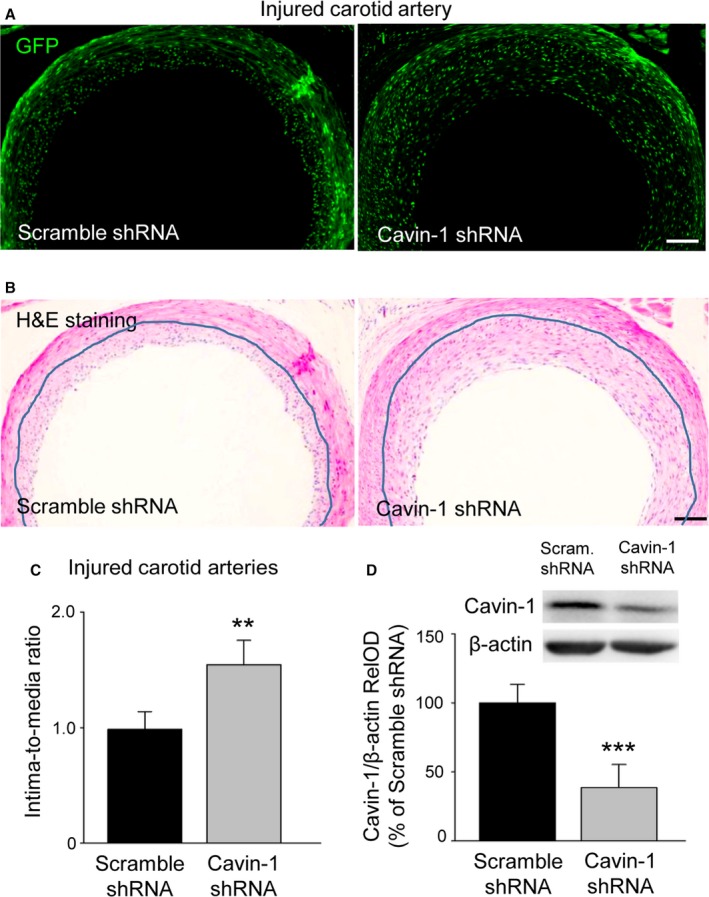
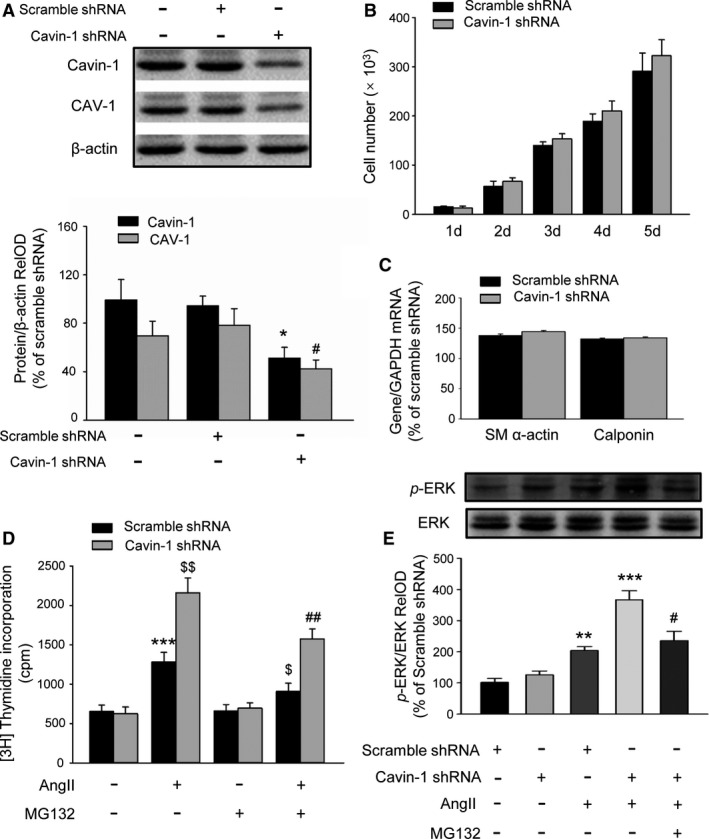
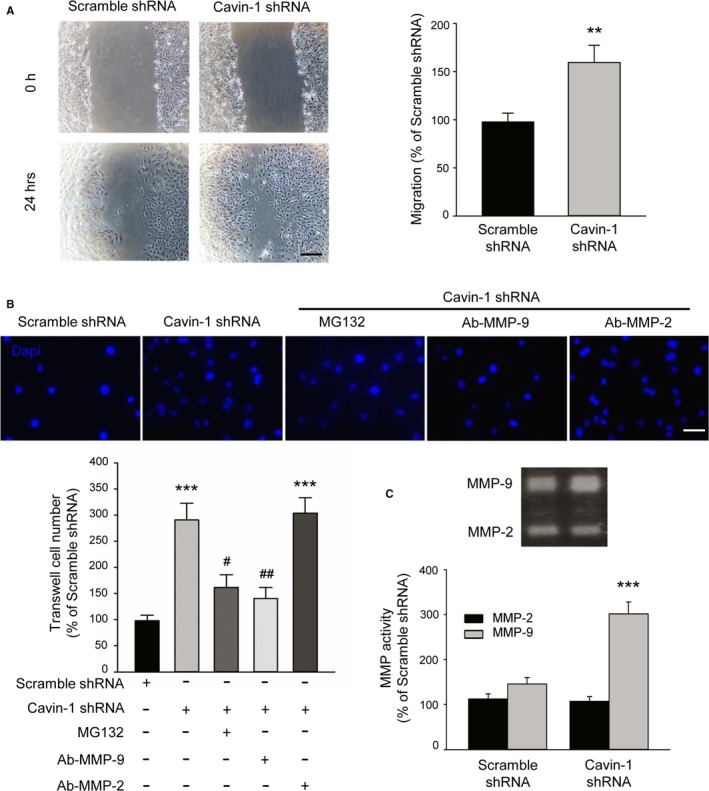
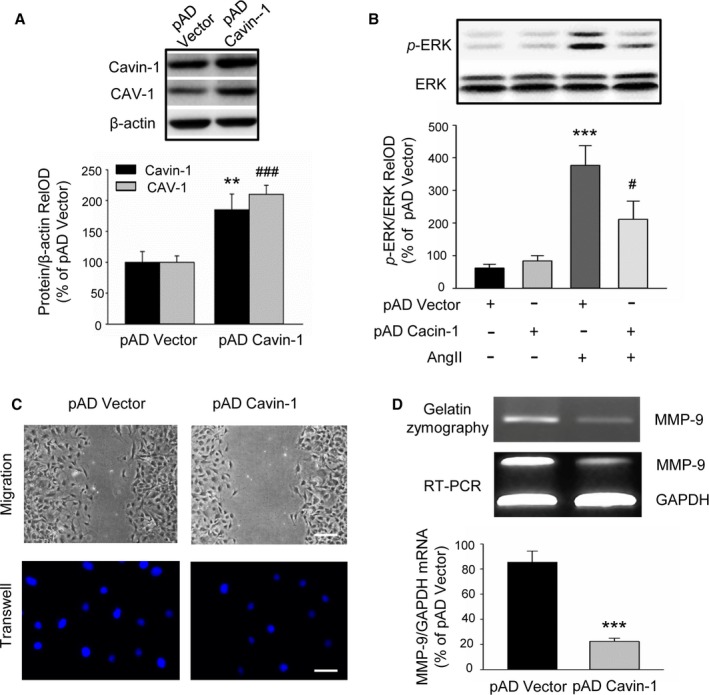
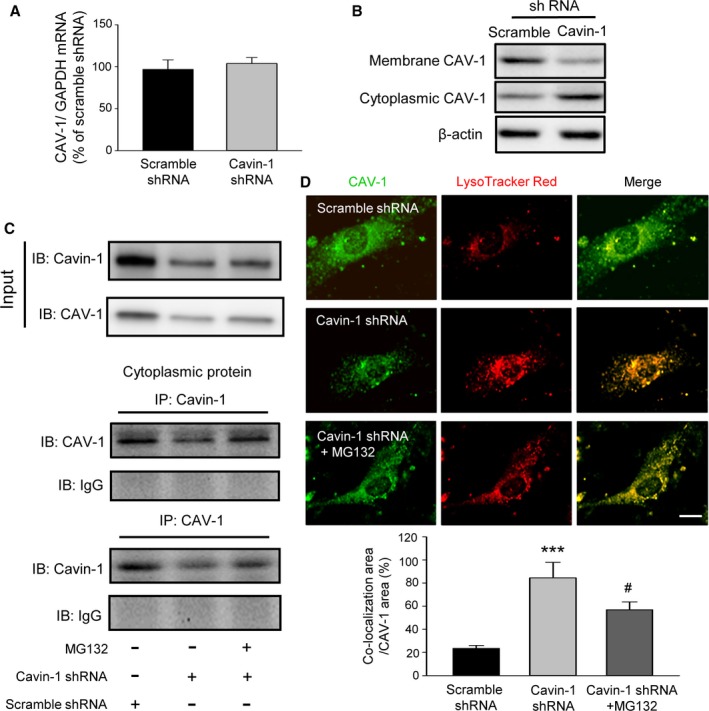
Methods and results: Balloon injury markedly reduced Cavin-1 protein and enhanced ubiquitin protein expression accompanied with neointimal hyperplasia in injured carotid arteries, whereas Cavin-1 mRNA had no change. In cultured vascular smooth muscle cells (VSMCs), Cavin-1 was downregulated after inhibition of protein synthesis by cycloheximide, which was distinctly prevented by pretreatment with proteasome inhibitor MG132 but not by lysosomal inhibitor chloroquine, suggesting that proteasomal degradation resulted in Cavin-1 downregulation. Knockdown of Cavin-1 by local injection of Cavin-1 short hairpin RNA (shRNA) into balloon-injured carotid arteries in vivo promoted neointimal formation. In addition, inhibition or overexpression of Cavin-1 in cultured VSMCs in vitro prompted or suppressed VSMC proliferation and migration via increasing or decreasing extracellular signal-regulated kinase phosphorylation and matrix-degrading metalloproteinases-9 activity, respectively. However, under basic conditions, the effect of Cavin-1 on VSMC migration was stronger than on proliferation. Moreover, our results indicated that Cavin-1 regulated caveolin-1 expression via lysosomal degradation pathway.

Conclusions: Our study revealed the role and the mechanisms of Cavin-1 downregulation in neointimal formation by promoting VSMC proliferation, migration, and synchronously enhancing caveolin-1 lysosomal degradation. Cavin-1 may be a potential therapeutic target for the treatment of postinjury vascular remodeling.

Keywords: Cavin‐1; caveolin‐1; migration; neointimal hyperplasia; polymerase I and transcript release factor; proliferation; vascular smooth muscle.


Figures

Figure 1
Figure 1
Balloon injury results in a decline of Cavin‐1 protein expression but not mRNA in injured carotid arteries. A, Western blot showing the effect of balloon injury on Cavin‐1 protein expression at 2, 7, and 14 days after balloon injury or sham operation to injured carotid artery. Cavin‐1 relative optical density (RelOD) indicates the percentage of the relative optical density value of Cavin‐1/β‐actin to sham group. n=3 to 4 mice/per group, **P<0.01, ***P<0.001, vs sham group. B, Typical photographs of hematoxylin and eosin (H&E) staining showing the vascular structure of carotid at 14 days in sham and injured groups. Scale bar: 25 μm. C, Representative immunofluorescent staining and the statistical histogram showing the expression of Cavin‐1 in the injured carotid arterial wall or in 1 single vascular smooth muscle cell (VSMC) (inset) at 14 days after sham operation or left balloon injury. Red: Cavin‐1, blue: 4',6‐ diamidino‐2‐phenylindole (Dapi). The white lines show the luminal border between the intima (I) or media (M) layer. The insets at the top right corner show higher‐magnification from the white boxes in the large images. Scale bars: 25 μm, inset: 5 μm. ***P<0.001, vs sham group, n=3 to 4 mice/per group and 3 to 5 images/per mice, and n=7 to 8 cells/per image. D, Cavin‐1 mRNA in carotid artery from sham or balloon‐injured group was determined by real‐time reverse transcriptase polymerase chain reaction (n=6–8).
Figure 2
Figure 2
Increased proteasomal degradation results in the decrease of Cavin‐1 protein expression in injured arteries. A, Western blot data showing the degradation of Cavin‐1 protein was mediated by the ubiquitin proteasome pathway, but not by the lysosomal pathway. Rat aortic VSMCs were pretreated with or without cycloheximide (CHX, 25 μmol/L) for 1 hour, followed by treatment with lysosomal inhibitor chloroquine (CQ, 50 μmol/L) or proteasome inhibitor MG132 (10 μmol/L) for an additional 24 hours (n=5, **P<0.01, vs Vehi; ## P<0.01, vs CHX). B, Immunochemical staining showing the ubiquitinated protein in carotid artery at 2 weeks' postangioplasty from sham and injury groups. Scale bar: 25 μm. C, Immunoprecipitation (IP) and Western blot analysis revealed that the ubiquitinated protein levels were higher while the expression of Cavin‐1 were lower in the injured carotid than in sham group (n=6–8, ***P<0.001, vs sham). RelOD indicates relative optical density; Vehi, vehicle; VSMCs, vascular smooth muscle cells.
Figure 3
Figure 3
Inhibition of Cavin‐1 protein expression by lentivirus‐mediated Cavin‐1 shRNA promotes neointima formation in balloon‐injured arteries. A, Representative images of GFP immunofluorescence (green) of vessel cross‐sections indicating transfection efficiency of local delivery of lentivirus mediated Cavin‐1 shRNA plasmid at 14 days after injection into balloon‐injured arteries. B, H&E staining from the same samples showing the change of carotid vascular structure after injection of scramble shRNA or Cavin‐1 shRNA. The blue lines show the media or neointima layer. Scale bars (in A and B): 200 μm. C, The thickness histogram of intima‐to‐media ratio showing the effect of scramble shRNA or Cavin‐1 shRNA on neointima formation at 14 days after injection (1.544 vs 0.986; **P<0.01, vs scramble groups). D, Western blot of the injured carotid arteries showing a significant inhibition of Cavin‐1 protein expression in Cavin‐1 shRNA groups (n=6–8, ***P<0.001, vs scramble groups). GFP indicates green fluorescent protein; H&E, hematoxylin and eosin; RelOD, relative optical density; shRNA, short hairpin RNA.
Figure 4
Figure 4
Inhibition of Cavin‐1 expression by shRNA promotes AngII‐induced VSMC proliferation via further activation of extracellular signal‐regulated kinase (ERK). A, Representative Western blot and statistical analysis showing the efficiency of Cavin‐1 shRNA on the inhibition of Cavin‐1 expression and even on CAV‐1 expression in VSMC culture (n=3–4/per group, Cavin‐1 expression: *P<0.05 vs Scramble shRNA alone; CAV‐1 expression: # P<0.05 vs Scramble shRNA alone). B, The histogram of VSMC number showing the effect of Cavin‐1 shRNA on VSMCs proliferation in normal growth culture medium (10% FBS DMEM). C, Knockdown of Cavin‐1 protein expression by Cavin‐1 shRNA had no effect on VSMC phenotypic marker α‐SM actin and calponin (n=6–8/per group). D, [3H]‐thymidine incorporation measured as count per minute (cpm) showing the effect of Cavin‐1 knockdown on VSMC proliferation in stimulation with AngII (100 nmol/L) for 24 hours with or without pretreatment with proteasome inhibitor MG132 (10 μmol/L) for 1 hour. n=9, ***P<0.001 vs Scramble shRNA alone, $ P<0.05, $$ P<0.01 vs Scramble shRNA treated with AngII and ## P<0.01 vs Cavin‐1 shRNA treat with AngII. E, Western blot showing the effect of Cavin‐1 knockdown on AngII‐induced ERK phosphorylation (pERK) with or without pretreatment with MG132. pERK/ERK RelOD indicated the percentage of the relative optical density value of pERK/ERK to Scramble shRNA group. n=3, **P<0.01, ***P<0.001 vs Scramble shRNA treated with AngII, # P<0.05 vs Cavin‐1 shRNA treated with AngII. Ang II indicates angiotensin II; FBS, fetal bovine serum; RelOD, relative optical density; shRNA, short hairpin RNA; VSMCs, vascular smooth muscle cells.
Figure 5
Figure 5
Inhibition of Cavin‐1 expression promotes the VSMC migration under normal culture condition via upregulation of MMP‐9. A, The scratch wound healing assay showing knockdown of Cavin‐1 expression by Cavin‐1 shRNA facilitates VSMC migration. Scale bar: 100 μm. The percentage of closure was measured at 24 hours after wounding (n=6, **P<0.01 vs scramble shRNA group). B, Representative micrographs of Dapi staining and statistical analysis showing the promotion of Cavin‐1 knockdown on VSMC migration at 24 hours after seeding cells to the upper chambers to the bottom surface of the transwell. Scale bar: 25 μm. Scramble shRNA and Cavin‐1 shRNA VSMCs were seeded into the upper chamber, treated with and without MG132 (10 μmol/L), Ab‐MMP‐9 (1:200 dilution), or Ab‐MMP‐2 (1:200 dilution) for 24 hours. (n=6, ***P<0.001 vs shRNA alone, # P<0.05, ## P<0.01 vs Cavin‐1 shRNA). C, The 48‐hour conditioned medium of VSMCs transiently transfected with Scramble shRNA and Cavin‐1 shRNA was collected and equal amounts of protein were subjected to gelatin zymography. Gelatin zymography results showing the effect of Cavin‐1 knockdown on the activity of MMP‐2 or MMP‐9 in VSMCs (n=6, ***P<0.001 vs scramble shRNA). Dapi indicates 4′,6‐diamidino‐2‐phenylindole; MMP‐9, matrix‐degrading metalloproteinase‐9; shRNA, short hairpin RNA; VSMCS, vascular smooth muscle cells.
Figure 6
Figure 6
Effect of Cavin‐1 overexpression on VSMC proliferation and migration. A, Representative Western blot and statistical analysis showing the efficiency of adenovirus‐mediated Cavin‐1 cDNA on Cavin‐1 expression and even on CAV‐1 expression (n=3, **P<0.01 vs pAD‐Vector, Cavin‐1; ### P<0.001 vs pAD‐Vector,CAV‐1). B, p‐ERK were markedly increased after treatment VSMC with AngII (100 nmol/L) for 30 minutes, but significantly reduced by Cavin‐1 overexpression. Only overexpression of Cavin‐1 had no effect on VSMC ERK activity (n=3, ***P<0.001 vs pAD alone, # P<0.05 vs pAD Vector plus AngII). C, The scratch assay and transwell experiment showing the effect of overexpression Cavin‐1 on VSMC migration. Scale bars: upper, 50 μm, lower, 25 μm. D, The results from gelatin zymography and RTPCR showing the change of MMP‐9 protein and mRNA after Cavin‐1 overexpression. The 48‐hour conditioned medium from VSMCs transiently transfected with pAD Vector or pAD Cavin‐1 was collected and equal amounts of protein were subjected to gelatin zymography. Equal amounts of mRNA from VSMCs transfected with pAD Vector or pAD Cavin‐1 were subjected to RTPCR using primers to identify MMP‐9 or GAPDH. PCR products of the expected size were identified by agarose gel electrophoresis (n=6, ***P<0.001 vs pAD Vector). Ang II indicates angiotensin II; MMP‐9, matrix‐degrading metalloproteinase‐9; pAD, adenoviral plasmid; p‐ERK, extracellular signal‐related kinase phosphorylation; RelOD, relative optical density; RTPCR, reverse transcriptase polymerase chain reaction; VSMCs, vascular smooth muscle cells.
Figure 7
Figure 7
Inhibition of the interaction of Cavin‐1 and CAV‐1 by Cavin‐1 shRNA promotes the lysosomal degradation of CAV‐1. A, RTPCR results showed that Cavin‐1 knockdown by Cavin‐1 shRNA had no effect on CAV‐1 mRNA expression in VSMCs (n=5). B, Western blot results from VSMC plasma membrane and cytoplasmic fractions samples showing the promotion of Cavin‐1 knockdown on the moving of CAV‐1 from plasma membrane to cytoplasm. C, Immunoprecipitation was used to assess the effect of Cavin‐1 knockdown with or without MG132 on the interactions of Cavin‐1 and CAV‐1 with or without Cavin‐1 knockdown. Cavin‐1 or CAV‐1 was used as internal control in the input and IgG was used as negative control. Inhibition of Cavin‐1 decreased the interaction, and this effect was blocked by inhibition of protein degradation via MG132. D, Immunofluorescence staining showing the expression of CAV‐1 (green), which mainly distributed in plasma membrane of VSMCs and LysoTracker (red) represented lysosomal degradation of CAV‐1. Scale bar: 5 μm. The statistical analysis histogram illustrates that the percentage of the co‐localization area (yellow, CAV‐1 and LysoTracker) to CAV‐1 (green) was increased after knockdown of Cavin‐1, but was reversed by proteasome inhibitor MG132. n=3, ***P<0.001 vs Scramble shRNA, # P<0.05 vs Cavin‐1 shRNA. IgG indicates immunoglobulin G; IP, immunoprecipitation; RTPCR, reverse transcriptase polymerase chain reaction; VSMCs, vascular smooth muscle cells.

Similar articles

Cited by

References

    1. Nagaraja V, Ooi SY, Nolan J, Large A, De BM, Ludman P, Bagur R, Curzen N, Matsukage T, Yoshimachi F, Kwok CS, Berry C, Mamas MA. Impact of incomplete percutaneous revascularization in patients with multivessel coronary artery disease: a systematic review and meta‐analysis. J Am Heart Assoc. 2016;5:e004598 DOI: 10.1161/JAHA.116.004598 - DOI - PMC - PubMed
    1. Alfonso F, Byrne RA, Rivero F, Kastrati A. Current treatment of in‐stent restenosis. J Am Coll Cardiol. 2014;63:2659–2673. - PubMed
    1. Misumida N, Aoi S, Saeed M, Ota T, Eda T, Umeda H, Kanei Y. The role of angiographic follow‐up after percutaneous coronary intervention. Int J Cardiol. 2016;222:911–920. - PubMed
    1. Siontis GC, Stefanini GG, Mavridis D, Siontis KC, Alfonso F, Perez‐Vizcayno MJ, Byrne RA, Kastrati A, Meier B, Salanti G, Juni P, Windecker S. Percutaneous coronary interventional strategies for treatment of in‐stent restenosis: a network meta‐analysis. Lancet. 2015;386:655–664. - PubMed
    1. Simon DI. Inflammation and vascular injury: basic discovery to drug development. Circ J. 2012;76:1811–1818. - PMC - PubMed

MeSH terms

LinkOut - more resources