

Analytic Considerations for Repeated Measures of eGFR in Cohort Studies of CKD
- PMID: 28751576
- PMCID: PMC5544518
- DOI: 10.2215/CJN.11311116
Analytic Considerations for Repeated Measures of eGFR in Cohort Studies of CKD
Abstract
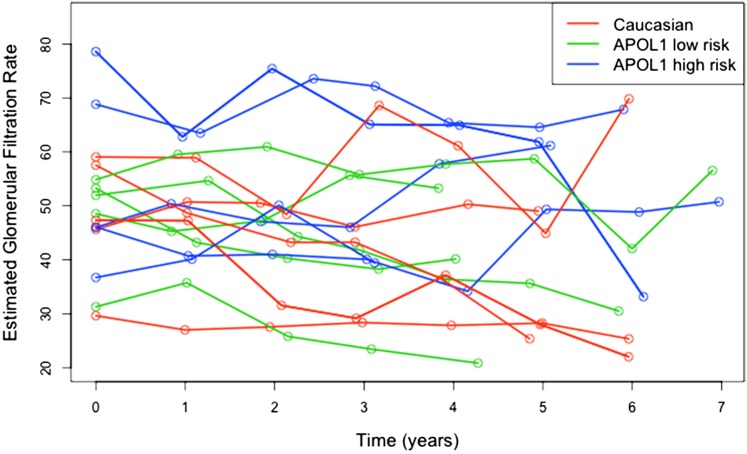
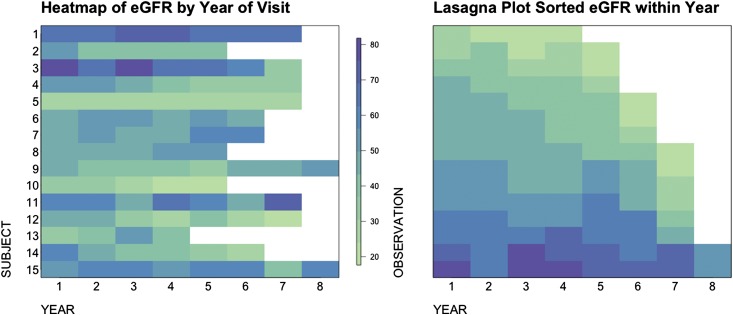
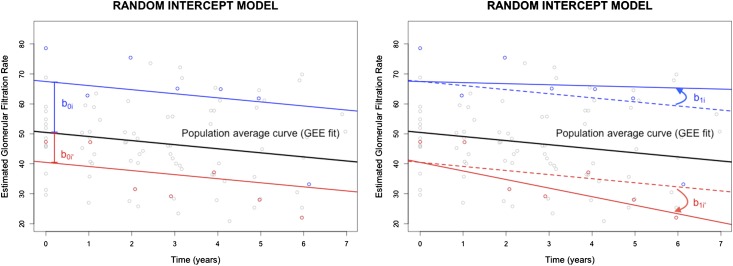
Repeated measures of various biomarkers provide opportunities for us to enhance understanding of many important clinical aspects of CKD, including patterns of disease progression, rates of kidney function decline under different risk factors, and the degree of heterogeneity in disease manifestations across patients. However, because of unique features, such as correlations across visits and time dependency, these data must be appropriately handled using longitudinal data analysis methods. We provide a general overview of the characteristics of data collected in cohort studies and compare appropriate statistical methods for the analysis of longitudinal exposures and outcomes. We use examples from the Chronic Renal Insufficiency Cohort Study to illustrate these methods. More specifically, we model longitudinal kidney outcomes over annual clinical visits and assess the association with both baseline and longitudinal risk factors.
Keywords: Biomarkers; CKD; Chronic; Cohort Studies; Disease Progression; GEE; GFR; Humans; Renal Insufficiency; correlation structures; kidney; longitudinal data; mixed effects model; repeated measures; risk factors.
Copyright © 2017 by the American Society of Nephrology.
Figures
References
-
- Koufaki P, Naish PF, Mercer TH: Reproducibility of exercise tolerance in patients with end-stage renal disease. Arch Phys Med Rehabil 82: 1421–1424, 2001 - PubMed
-
- Feldman HI, Appel LJ, Chertow GM, Cifelli D, Cizman B, Daugirdas J, Fink JC, Franklin-Becker ED, Go AS, Hamm LL, He J, Hostetter T, Hsu CY, Jamerson K, Joffe M, Kusek JW, Landis JR, Lash JP, Miller ER, Mohler 3rd ER, Muntner P, Ojo AO, Rahman M, Townsend RR, Wright JT; Chronic Renal Insufficiency Cohort (CRIC) Study Investigators: The Chronic Renal Insufficiency Cohort (CRIC) Study: Design and methods. J Am Soc Nephrol 14[Suppl 2]: S148–S153, 2003 - PubMed
-
- ARIC investigators: The Atherosclerosis Risk in Communities (ARIC) Study: Design and objectives. The ARIC investigators. Am J Epidemiol 129: 687–702, 1989 - PubMed
-
- Wanner C, Oliveira JP, Ortiz A, Mauer M, Germain DP, Linthorst GE, Serra AL, Maródi L, Mignani R, Cianciaruso B, Vujkovac B, Lemay R, Beitner-Johnson D, Waldek S, Warnock DG: Prognostic indicators of renal disease progression in adults with Fabry disease: Natural history data from the Fabry Registry. Clin J Am Soc Nephrol 5: 2220–2228, 2010 - PMC - PubMed
Publication types
MeSH terms
Grants and funding
- U01 DK060980/DK/NIDDK NIH HHS/United States
- U01 DK060963/DK/NIDDK NIH HHS/United States
- UL1 RR024131/RR/NCRR NIH HHS/United States
- U01 DK061022/DK/NIDDK NIH HHS/United States
- UL1 TR000003/TR/NCATS NIH HHS/United States
- UL1 TR000439/TR/NCATS NIH HHS/United States
- U01 DK060990/DK/NIDDK NIH HHS/United States
- UL1 TR002240/TR/NCATS NIH HHS/United States
- UL1 RR029879/RR/NCRR NIH HHS/United States
- U01 DK061028/DK/NIDDK NIH HHS/United States
- UL1 TR000433/TR/NCATS NIH HHS/United States
- U01 DK060984/DK/NIDDK NIH HHS/United States
- U01 DK061021/DK/NIDDK NIH HHS/United States
- UL1 TR000424/TR/NCATS NIH HHS/United States
- M01 RR016500/RR/NCRR NIH HHS/United States
- P20 GM109036/GM/NIGMS NIH HHS/United States
- U01 DK060902/DK/NIDDK NIH HHS/United States
- UL1 TR002003/TR/NCATS NIH HHS/United States
LinkOut - more resources
Full Text Sources
Other Literature Sources
Medical
Research Materials
Miscellaneous
