

Promoterless gene targeting without nucleases rescues lethality of a Crigler-Najjar syndrome mouse model
- PMID: 28751579
- PMCID: PMC5623861
- DOI: 10.15252/emmm.201707601
Promoterless gene targeting without nucleases rescues lethality of a Crigler-Najjar syndrome mouse model
Abstract
Crigler-Najjar syndrome type I (CNSI) is a rare monogenic disease characterized by severe neonatal unconjugated hyperbilirubinemia with a lifelong risk of neurological damage and death. Liver transplantation is the only curative option, which has several limitations and risks. We applied an in vivo gene targeting approach based on the insertion, without the use of nucleases, of a promoterless therapeutic cDNA into the albumin locus of a mouse model reproducing all major features of CNSI Neonatal transduction with the donor vector resulted in the complete rescue from neonatal lethality, with a therapeutic reduction in plasma bilirubin lasting for at least 12 months, the latest time point analyzed. Mutant mice, which expressed about 5-6% of WT Ugt1a1 levels, showed normal liver histology and motor-coordination abilities, suggesting no functional liver or brain abnormalities. These results proved that the promoterless gene therapy is applicable for CNSI, providing therapeutic levels of an intracellular ER membrane-bound enzyme responsible for a lethal liver metabolic disease.
Keywords: brain damage; genetic liver disease; homologous recombination; hyperbilirubinemia; kernicterus.
© 2017 International Centre for Genetic Engineering and Biotechnology Published under the terms of the CC BY 4.0 license.
Figures

Vector design and experimental scheme. Recombination of the AAV8 vectors (containing the eGFP or the WT human Ugt1a1 cDNAs, preceded by the 2A‐peptide, and flanked by albumin gene homology arms) results in a fused “chimeric bicistronic” mRNA, which is translated into two separate proteins. Rectangles represent exons; thick black lines, introns and intergenic regions; thin gray lines, extragenic DNA sequences. Modified from Barzel et al (2015).
Histological analysis of liver sections. P2, P4, and P10 WT mice were IP transduced with rAAV8‐Alb‐eGFP (0.7E12 and 1E12 vgp/mouse) and sacrificed at P30. P30 WT mice were i.v. transduced and sacrificed at P45. As controls, WT mice were transduced with an episomal AAV8 vector (Bortolussi et al, 2014b). Nuclei were counterstained with Hoechst. Each field corresponds to a single animal (n = 3 per time point/treatment). Scale bar, 400 μm.
Quantification of the number of eGFP‐positive hepatocytes. Two‐way ANOVA: interaction, P = 0.0011; dose, P < 0.0001; time of injection, P < 0.0001; Bonferroni post hoc tests (0.7E12 versus 1.0E12): P2, t = 5.271, P < 0.001; P4, t = 8.755, P < 0.001; P10, t = 2.141, P = NS. P2 1.0E12 versus P4 1.0E12, t = 4.226, P < 0.01; n = 3 per group; #, not performed.
Quantitative RT–PCR of liver total RNA samples from panel (B). Each dot represents a single animal. Two‐way ANOVA: interaction, P = 0.0009; dose, P < 0.0001; time of injection, P = 0.0013; Bonferroni post hoc tests (0.7E12 versus 1.0E12): P2, t = 2.244, P = ns; P4, t = 8.273, P < 0.001; P10, t = 1.647, P = ns; n = 3 per group.

Experimental scheme. P2, P4, and P10 WT mice were IP transduced with rAAV8‐Alb‐eGFP at two doses (0.7E12 and 1.0E12 vgp/mouse) and sacrificed at P30. P30 WT mice were i.v. transduced and sacrificed at P45 with 1E12 vgp/mouse (Fig 1B–D).
Histological analysis of liver sections from WT neonate mice treated with rAAV‐Alb‐eGFP. Nuclei were counterstained with Hoechst (blue signal). Each field corresponds to a single animal (n = 3 per time point/treatment). Scale bar, 200 μm.
Scheme of the targeted cDNA indicating the position of the regions of homology, P2A, eGFP cDNA, the position of the primers used for the RT–PCR shown in the agarose gels (panel D) and for the amplification of the sequenced fragment (panel E).
Semi‐quantitative RT–PCR of liver total RNA samples from WT mice injected at P2 or P4 with AAV‐Alb‐eGFP, as shown in panel (B). Animals were sacrificed at 1 and 4 months post‐injection (lanes 1–15, and 20, 21, and 23, respectively). The primers annealed to the eGFP cDNA and to the albumin exon 15. A 1,123‐base intron is present between albumin exons 14 and 15. The endogenous albumin mRNA was used as control. Lanes 16 and 22, molecular weight markers.
Molecular analysis of the chimeric mRNAs. Chromatogram obtained by sequencing the chimeric Albumin‐2A‐eGFP cDNA RT–PCR product. The RT–PCR products obtained with the primers indicated in panel (C) were cloned in pGEM‐T vector and sequenced. The mouse albumin exons 12, 13, and 14 are indicated, as well as the peptide 2A and the human eGFP cDNA.
- A
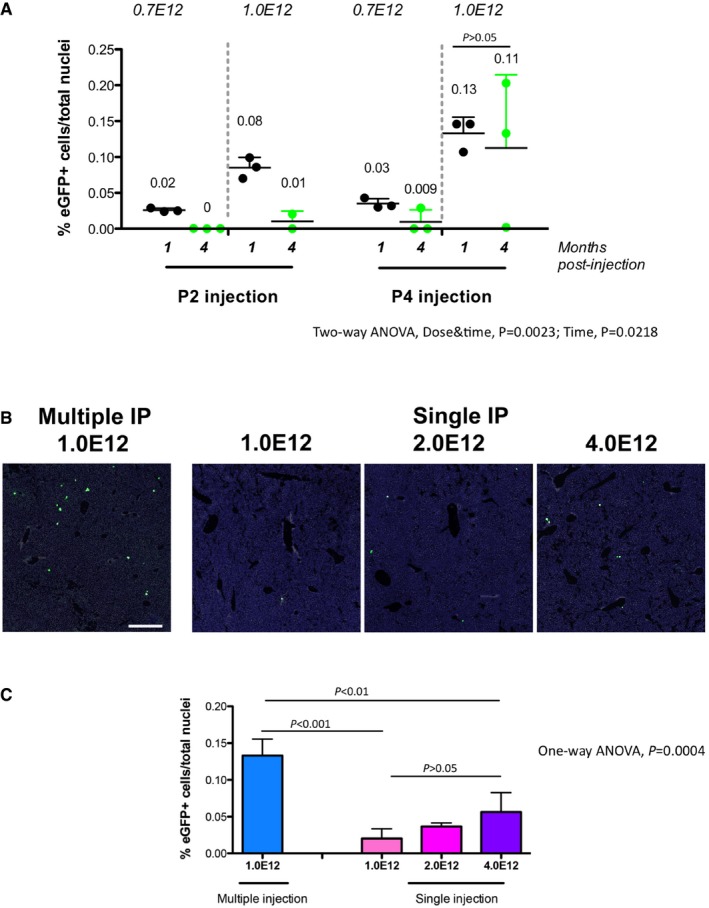
P2 and P4 WT pups were IP transduced with rAAV‐Alb‐eGFP at two doses: 0.7E12 and 1.0E12 vgp/mouse. The % of eGFP‐positive cells at 1 and 4 months is indicated. Each single dot represents an animal. Three sections per animals were analyzed. Results are expressed as mean ± SD. The numbers above each group indicate the mean value. Two‐way ANOVA: interaction, NS; treatment, P = 0.0023; time, P = 0.0218; Bonferroni post hoc tests: time: P4 1.0E12 1 month versus P4 1.0E12 4 months, t = 0.6343, P = ns.
- B, C
Comparison of multiple and single AAV‐Alb‐eGFP administration of WT P4 neonates at different doses by IP injection. N = 3 per time point/dose. Three sections per animals were analyzed. One‐way ANOVA: F = 21.20, P = 0.0004; Bonferroni comparison tests: multiple vs. 1.0E12, 2.0E12, 4.0E12, t = 7.360, t = 6.293, t = 5.008, P < 0.001, P < 0.01, P < 0.01, respectively; 1.0E12 versus 2.0E12, t = 1.067, 1.0E12 versus 4.0E12, t = 2.352, 2.0E12 versus 4.0E12, t = 1.285, all P = ns. Results are expressed as mean ± SD. Scale bar, 400 μm.

- A
Scheme of the protein with the position of the targeted one‐base deletion and the DNA and protein sequences of the WT and mutant alleles.
- B
Kaplan–Meier survival curve of WT and Ugt1−/− mutant mice.
- C
The red triangle indicates the mutant pup. Its orange discoloration caused by severe hyperbilirubinemia is evident 36 h after birth. Panels (B and C) are from Bortolussi et al (2014a).
- D, E
Transduction of Ugt1−/− mice in non‐lethal conditions with the rAAV‐Alb‐hUgt1a1 donor vector. Experimental strategy (D). Neonate mutant mice received PT since birth till P15 and were then kept under normal light conditions, were injected at the indicated time points and sacrificed at P30. Plasma bilirubin levels were determined at P30 (E). Controls correspond to Ugt1−/− mice treated only with PT up to P15. Each single dot represents an animal, determined in duplicate (one‐way ANOVA: F = 38.00, P < 0.0001; Bonferroni comparison tests: P4 0.7E12, P4 1.0E12, P10 1.0E12 vs. control, t = 6.139, t = 9.761, t = 4.408, P < 0.001, P < 0.001, P < 0.01, respectively). Results are expressed as mean ± SD.

Experimental strategy. Ugt1−/− mutant mice were injected at P4 with rAAV8 pAlb‐hUGT1A1 (1.0E12 vgp/mouse) and maintained under PT up to P8.
Kaplan–Meier survival curve. All rAAV‐treated mutant mice (n = 5) survived, while all mutant mice treated only with PT up to P8 died before P19 (n = 6). P ≤ 0.0001, Log‐rank (Mantel–Cox) test.
Plasma bilirubin was determined up to 12 months. Untreated mice received no PT, and all died before P15. The gray area in the graph indicates the range of TB levels resulting in brain damage and death. Untreated, n = 3–6; treated, n = 5.
Rotarod test of WT animals (n = 13) and WT treated with rAAV‐Alb‐eGFP donor vector (P4, 1.0E12 vgp/mouse, n = 5), and Ugt1−/− mice (n = 5) as described in panel (A). Ugt1−/− mice temporarily treated with PT (from P8 to P20, n = 3) with cerebellar abnormalities were used as control (Bortolussi et al, 2014a) (Ugt1−/− P8‐P20 PT). One‐way ANOVA: P = 0.0007; Bonferroni post hoc tests: WT versus Ugt1−/− P8‐P20 PT, t = 4.612, P < 0.001; WT pAlb‐eGFP versus Ugt1−/− P8‐P20 PT, t = 4.381, P < 0.01; Ugt1−/− pAlb‐hUGT1a1 vs. Ugt1−/− P8‐P20 PT, t = 4.386, P < 0.01; all others, ns.

RT–PCR of liver RNA samples from Fig EV3D and panel (E) (P4 1.0E12 vgp/mouse). Gapdh mRNA was used as housekeeping control. UNTR indicates mice treated only with PT.
Northern blot of total liver RNA from WT, Ugt1−/− untreated (PT up to P15) or treated with rAAV8‐Alb‐hUgt1a1 (1E12 vgp/mouse at P4, PT up to P8, sacrificed at P30). Black arrow, Alb‐hUgt1a1 mRNA; asterisk, endogenous mUgt1a1 mRNAs.
Quantitative RT–PCR of liver total RNA from mutant mice treated with rAAV8‐Alb‐hUgt1a1 (1E12 vgp/mouse at P4, PT up to P8, sacrificed at P30). Mice were the same of panel (D). Alb‐hUgt1a1 mRNA levels are relative to endogenous Ugt1a1 mRNA levels of WT mice. RNA samples were analyzed in duplicate.
WB analysis of liver protein extracts (50 μg) from Ugt1−/− mice untreated (only PT up to P15, lanes 8–10) or treated with rAAV8‐Alb‐hUgt1a1 (lanes 5–7), at 1 month. As control, WT plus Ugt1−/− liver extracts (1.25, 2.5 μg, and 5 μg of WT, completed with Ugt1−/− extract up to 50 μg, corresponding to 2.5, 5.0, and 10.0%, respectively, lanes 1–3). Short and long exposures are shown (S. and L., respectively). Loading control, actin. Estimation of Ugt1a1 levels in treated mice (lanes 5–7) by comparison with the signal obtained in lanes 1–3 (mix of extracts from WT and untreated mutant livers), ratio Ugt1a1/actin (RU, mean ± SD), 5.3 ± 2.1.
IF analysis of liver sections from WT and Ugt1−/− mice treated with rAAV8 pAlb‐hUgt1a1 at P4 (1.0E12, vgp/mouse, sacrificed at M1 or M12), using a human‐specific anti‐Ugt1a1 antibody. Nuclei were counterstained with Hoechst. n = 3–4 per time point/treatment. Right panel: Quantification of sections at 1 and 12 months. Student's t‐test, P = 0.1825, NS. Scale bars, 10×, 200 μm, 20×, 100 μm.
- A
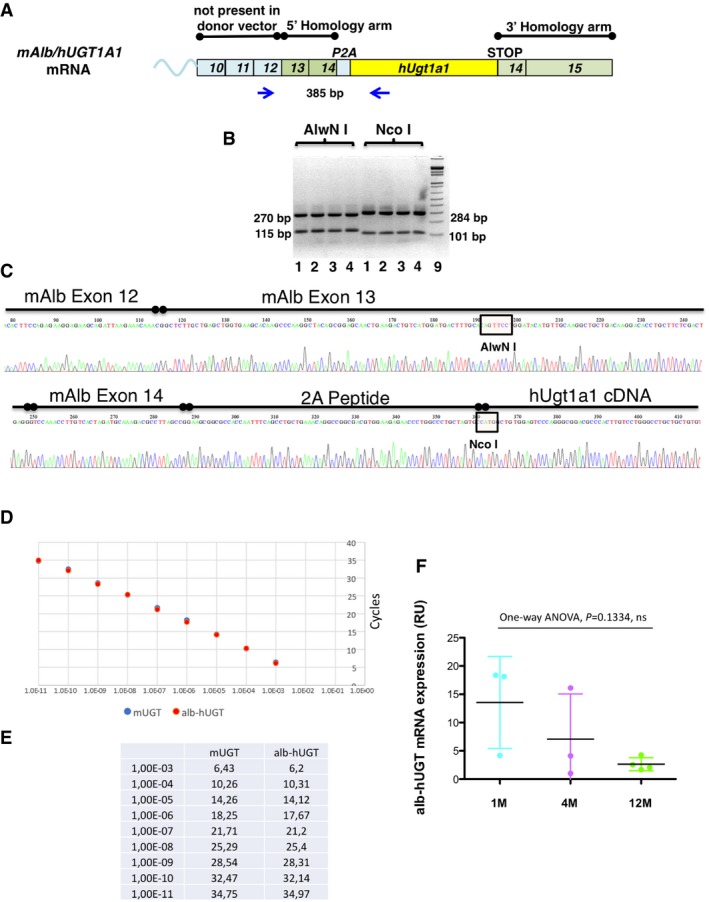
Scheme of the chimeric cDNA indicating the regions of homology, P2A, hUgt1a1 cDNA and the position of the primers used for the PCR and the size of the PCR products.
- B
The RT–PCR products of liver total RNA samples from mutant mice shown in Fig 3A were digested with AlwNI and NcoI. The size of the fragments is indicated.
- C
Chromatogram obtained by sequencing the chimeric Albumin‐2A‐hUgt1a1 cDNA RT–PCR product. The RT–PCR product obtained with the primers indicated in Fig EV5A was cloned in pGEM‐T vector and sequenced. The mouse albumin exons 12, 13, and 14 are indicated, as well as the peptide 2A and the human hUgt1a1 cDNA. The restriction sites AlwNI and NcoI, used to confirm the nature of the RT–PCR product, are indicated.
- D, E
Comparison of the efficiency of the PCR primers in the amplification of Alb‐hUgt1a1 and mouse Ugt1a1 (mUgt1a1) cDNAs. A set of primers specific for the chimeric Alb‐hUgt1a1 mRNA and another one specific for the mouse endogenous Ugt1a1 mRNA were tested in parallel using serial 1:10 dilutions of the same amount of the specific purified DNA templates. The curves are shown in panel (D), while data are shown in panel (E). These conditions and primers were then used to compare the levels of the chimeric Alb‐hUgt1a1 mRNA in treated mice with the endogenous mUgt1a1 mRNA levels present in WT mice (Fig 3C).
- F
Determination of the levels of the chimeric Alb‐hUGT1a1 mRNA in liver of 1‐, 4‐, and 12‐month‐old mice. Mice were treated at P4 with 1.0E12 vgp/mouse of rAAV‐Alb‐hUgt1a1 donor vector. At the indicated time points, mice were sacrificed and levels of the chimeric mRNA analyzed by qRT–PCR. The graph indicates relative levels normalized to albumin mRNA. One‐way ANOVA: F = 2.724, P = 0.1334, NS.

- A
Ugt1−/− mutant mice injected at P4 with 1.0E12 vgp/mouse of rAAV‐Alb‐hUgt1a1 donor vector were sacrificed at 12 months after viral transfer. Liver sections were stained with hematoxylin–eosin. Representative images are shown. Scale bars, 10×, 200 μm, 20×, 100 μm.
- B, C
Livers from Ugt1−/− mice treated with the rAAV‐Alb‐hUgt1a1 donor vector show no evidence of fibrosis or fatty liver. Ugt1−/− mice injected at P4 with 1.0E12 vgp/mouse of rAAV‐Alb‐hUgt1a1 donor vector were sacrificed at 12 months after viral transfer. Liver sections were stained with Masson's trichrome and Red Oil O staining to detect fibrosis and fatty liver, respectively (panels B and C, respectively). No signs of fibrosis or fatty liver were detected. Representative images are shown. Scale bars, 10×, 200 μm, 20×, 100 μm.
References
-
- Adam R, Karam V, Delvart V, O'Grady J, Mirza D, Klempnauer J, Castaing D, Neuhaus P, Jamieson N, Salizzoni M et al (2012) Evolution of indications and results of liver transplantation in Europe. A report from the European Liver Transplant Registry (ELTR). J Hepatol 57: 675–688 - PubMed
-
- Asonuma K, Gilbert JC, Stein JE, Takeda T, Vacanti JP (1992) Quantitation of transplanted hepatic mass necessary to cure the Gunn rat model of hyperbilirubinemia. J Pediatr Surg 27: 298–301 - PubMed
Publication types
MeSH terms
Substances
Grants and funding
LinkOut - more resources
Full Text Sources
Other Literature Sources
Medical
Molecular Biology Databases
