. 2017 Jul 27;7(1):6733.
doi: 10.1038/s41598-017-06905-6.

Inclusion of Population-specific Reference Panel from India to the 1000 Genomes Phase 3 Panel Improves Imputation Accuracy

Affiliations

Inclusion of Population-specific Reference Panel from India to the 1000 Genomes Phase 3 Panel Improves Imputation Accuracy

Meraj Ahmad et al. Sci Rep. .

Abstract

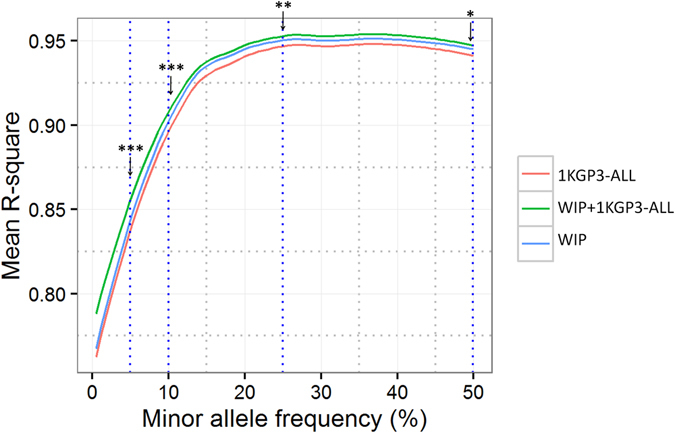
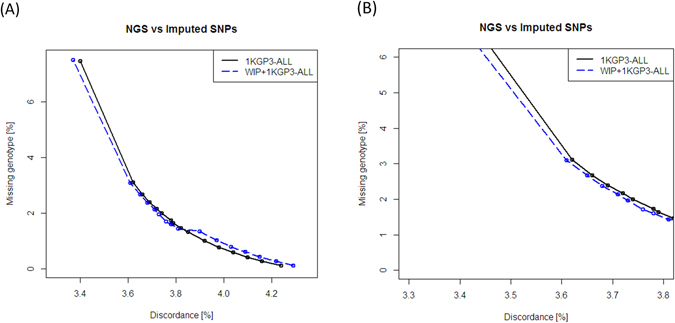
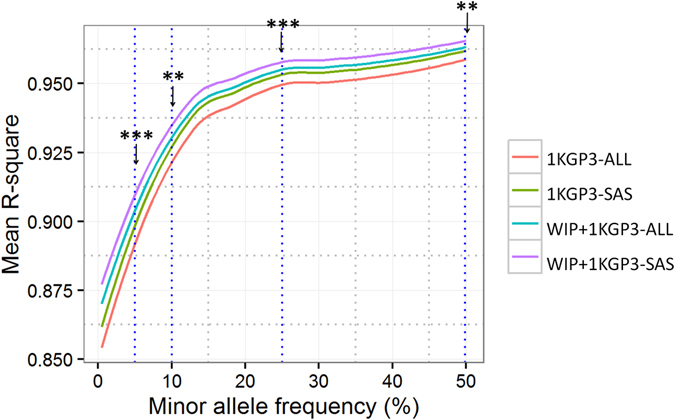
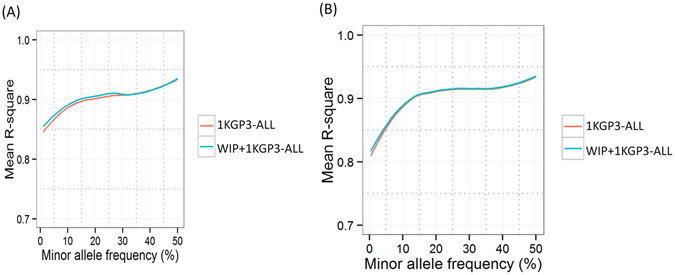
Imputation is a computational method based on the principle of haplotype sharing allowing enrichment of genome-wide association study datasets. It depends on the haplotype structure of the population and density of the genotype data. The 1000 Genomes Project led to the generation of imputation reference panels which have been used globally. However, recent studies have shown that population-specific panels provide better enrichment of genome-wide variants. We compared the imputation accuracy using 1000 Genomes phase 3 reference panel and a panel generated from genome-wide data on 407 individuals from Western India (WIP). The concordance of imputed variants was cross-checked with next-generation re-sequencing data on a subset of genomic regions. Further, using the genome-wide data from 1880 individuals, we demonstrate that WIP works better than the 1000 Genomes phase 3 panel and when merged with it, significantly improves the imputation accuracy throughout the minor allele frequency range. We also show that imputation using only South Asian component of the 1000 Genomes phase 3 panel works as good as the merged panel, making it computationally less intensive job. Thus, our study stresses that imputation accuracy using 1000 Genomes phase 3 panel can be further improved by including population-specific reference panels from South Asia.


Conflict of interest statement

The authors declare that they have no competing interests.

Figures

Figure 1
Figure 1
Schematic representation of the study design and analyses. Affy6.0 and Illumina HumanCoreExome data on 407 overlapping individuals from Western India was merged and used to generate the Western-Indian Reference Panel (WIP). SNPs from the Affy6.0 data on 1880 Western Indians, Human660W-Quad array data on 590 subjects from Northern India and HGDP data using Illumina 650K array on 48 Pathan and Sindhi subjects were imputed using different reference panels. The imputation accuracy was compared using r-square metric. Finally, cross-validation of imputation accuracy was performed on 823 samples having genotype data from HiSeq platform for the 3.57 Mb region and their imputed counterparts (imputed for Affy6.0 data). 1KGP1, The 1000 Genomes phase 1 panel; 1KGP3-ALL, The 1000 Genomes phase 3 panel with all 2504 samples; 1KGP3-SAS, The 1000 Genomes phase 3 panel with only South Asian component; 1KGP3-EAS, The 1000 Genomes phase 3 panel with only East Asian component; WIP+1KGP3-ALL, merged panel of WIP and 1KGP3-ALL; WIP+1KGP3-SAS, merged panel of WIP and 1KGP3-SAS; WIP+1KGP3-EAS, merged panel of WIP and 1KGP3-EAS.
Figure 2
Figure 2
Evaluation of population-specific reference panel for imputation accuracy. Affy6.0 SNPs from 1880 individuals from Western India were imputed at khap 3000 using 3 different reference panels: The 1000 Genomes Phase 3 (1KGP3-ALL), Western-Indian reference panel (WIP) and mergedWestern-Indian-1KGP3-ALL (WIP+1KGP3-ALL). Average r-square values were plotted against each minor allele frequency (MAF) bin. Two-tailed paired-end TTEST was performed for the mean r-square values at given MAF-bins between 1KGP3-ALL and WIP+1KGP3-ALL panel imputed SNPs. ‘p’ values of <0.001, <0.01 and <0.05 are indicated by ***, ** and * respectively. Results are restricted to SNPs on chromosome 20 only.
Figure 3
Figure 3
Validation of imputation performance using genotypes from targeted next-generation sequencing. The imputed genotypes in Affy6.0 data on 823 individuals generated using different panels were compared with the genotypes at 18979 common SNPs from targeted NGS of 3.57 Mb region. The imputation performance is illustrated by the percentage discordance (X-axis) plotted against percentage missing genotypes (Y-axis) for the SNPs common to the imputed and NGS genotype datasets. The figure shows the (A) full range of results corresponding to the probability thresholds ranging from 0.33 to 1.00 and (B) magnified results for probability thresholds near 0.90 and above for better comparison. 1KGP3-ALL, The 1000 Genomes phase 3 reference panel; WIP, Western-Indian reference panel; WIP+1KGP3-ALL, merged panel of WIP and 1KGP3-ALL; NGS, next generation sequencing; SNPs, single nucleotide polymorphisms.
Figure 4
Figure 4
Comparison of imputation accuracy using 1000 Genomes phase 3 (1KGP3-ALL), Western-Indian panel (WIP) and 1000 Genomes phase3-SASonly (1KGP3-SAS) reference panels. Affy 6.0 SNPs from 1880 individuals from Western India were imputed at khap 3000 using 1KGP3-ALL and 1KGP3-SAS and average r-square values were plotted against each minor allele frequency (MAF) bin. Two-tailed paired-end TTEST was conducted for the mean r-square values at given MAF-bins between 1KGP3-ALL and WIP+1KGP3-SAS panel imputed SNPs. ‘p’ values of <0.001 and 0.01 are indicated by *** and ** respectively. Results are restricted to chromosome 20 only. 1KGP3-ALL, The 1000 Genomes phase 3 reference panel; 1KGP3-SAS, The 1000 Genomes phase 3 panel with only South Asian component; WIP+1KGP3-ALL, merged panel of WIP and 1KGP3-ALL; WIP+1KGP3-SAS, merged panel of WIP and 1KGP3-SAS.
Figure 5
Figure 5
Comparison of imputation performance of data from other populations generated using 1KGP3-ALL and WIP+1KGP3-ALL reference panels. The imputation performance of the reference panels, 1KGP3-ALL and WIP+1KGP3-ALL was evaluated by comparing the imputed SNPs from other South Asian populations (Pathan and Sindhi from Human Genome Diversity Project (HGDP), and North-Indian individuals). (A) SNPs from HGDP data on Pathan and Sindhi populations (n = 48, 12494 SNPs) and (B) SNPs on North-Indian samples (13746 SNPs, n = 590). Results are restricted to chromosome 20 only. 1KGP3-ALL, The 1000 Genomes phase 3 reference panel; WIP+1KGP3-ALL, merged panel of WIP and 1KGP3-ALL.

References

    1. Manolio TA. Genomewide Association Studies and Assessment of the Risk of Disease. New England Journal of Medicine. 2010;363:166–176. doi: 10.1056/NEJMra0905980. - DOI - PubMed
    1. Bonnefond A, Froguel P. Rare and Common Genetic Events in Type 2 Diabetes: What Should Biologists Know? Cell Metabolism. 2015;21:357–368. doi: 10.1016/j.cmet.2014.12.020. - DOI - PubMed
    1. Marchini J, Howie B. Genotype imputation for genome-wide association studies. Nature Reviews Genetics. 2010;11:499–511. doi: 10.1038/nrg2796. - DOI - PubMed
    1. Altshuler DM, et al. A global reference for human genetic variation. Nature. 2015;526:68–74. doi: 10.1038/nature15393. - DOI - PMC - PubMed
    1. Imamura M, et al. Genome-wide association studies in the Japanese population identify seven novel loci for type 2 diabetes. Nat. Commun. 2016;7:10531. doi: 10.1038/ncomms10531. - DOI - PMC - PubMed

Publication types

LinkOut - more resources