. 2017 Jul 28;8(1):150.
doi: 10.1038/s41467-017-00209-z.

Aurora-B kinase pathway controls the lateral to end-on conversion of kinetochore-microtubule attachments in human cells

Affiliations

Aurora-B kinase pathway controls the lateral to end-on conversion of kinetochore-microtubule attachments in human cells

Roshan L Shrestha et al. Nat Commun. .

Abstract

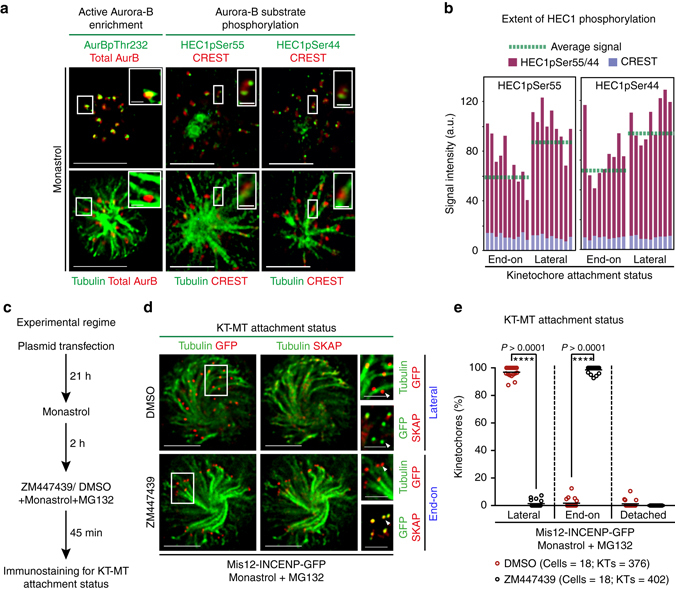
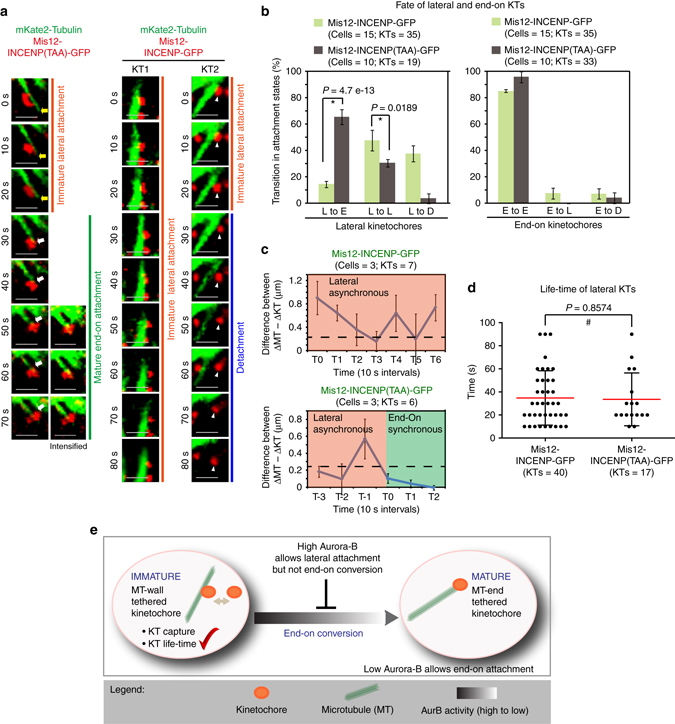
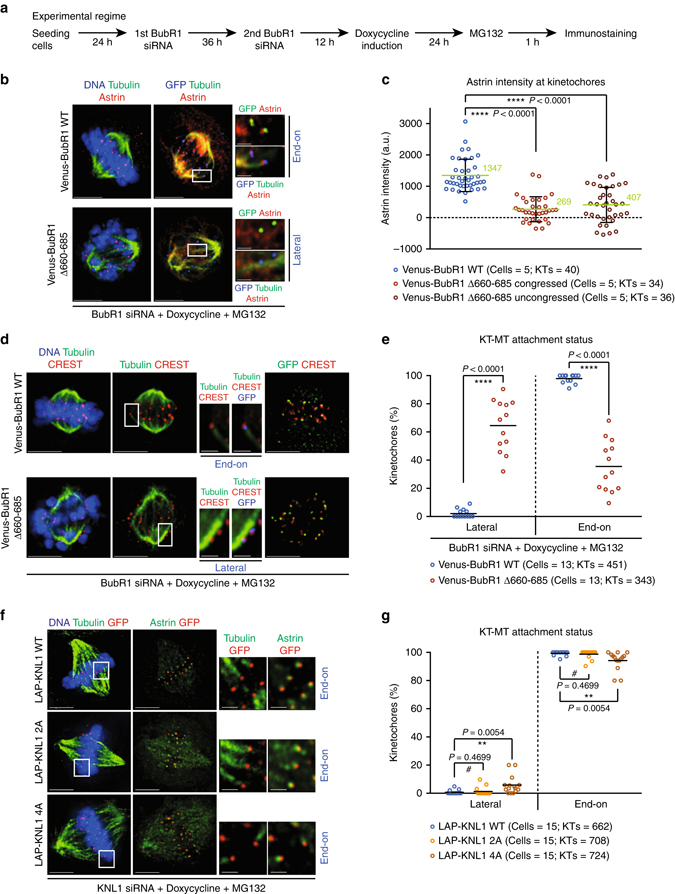
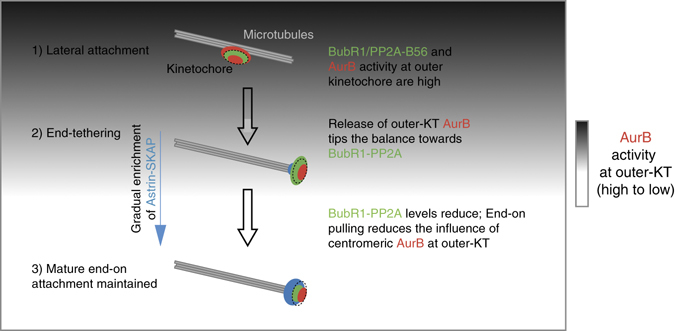
Human chromosomes are captured along microtubule walls (lateral attachment) and then tethered to microtubule-ends (end-on attachment) through a multi-step end-on conversion process. Upstream regulators that orchestrate this remarkable change in the plane of kinetochore-microtubule attachment in human cells are not known. By tracking kinetochore movements and using kinetochore markers specific to attachment status, we reveal a spatially defined role for Aurora-B kinase in retarding the end-on conversion process. To understand how Aurora-B activity is counteracted, we compare the roles of two outer-kinetochore bound phosphatases and find that BubR1-associated PP2A, unlike KNL1-associated PP1, plays a significant role in end-on conversion. Finally, we uncover a novel role for Aurora-B regulated Astrin-SKAP complex in ensuring the correct plane of kinetochore-microtubule attachment. Thus, we identify Aurora-B as a key upstream regulator of end-on conversion in human cells and establish a late role for Astrin-SKAP complex in the end-on conversion process.Human chromosomes are captured along microtubule walls and then tethered to microtubule-ends through a multi-step end-on conversion process. Here the authors show that Aurora-B regulates end-on conversion in human cells and establish a late role for Astrin-SKAP complex in the end-on conversion process.


Conflict of interest statement

The authors declare no competing financial interests.

Figures

Fig. 1
Fig. 1
High Aurora-B activity promotes KT attachment to MT-walls. a Representative images show high Aurora-B activity on lateral kinetochores. Monastrol treated cells were immunostained with antibodies against Tubulin, Aurora-BpThr232 and total Aurora-B (AurB) (left panel) or CREST antisera and antibodies against Tubulin and either HEC1pSer55 (middle panel) or HEC1pSer44 (right panel). Cropped images show lateral-kinetochores. Scale: 5 μm in uncropped images; 1 μm in cropped images. b Graphs show higher average signal intensities of HEC1pSer55 (left) and HEC1pSer44 (right) in lateral compared to end-on kinetochores as assessed from at least nine randomly chosen kinetochores from cells in a. CREST signal intensities are used as internal controls. c Experimental regime: Cells transfected with plasmid vectors encoding Mis12-INCENP-GFP were exposed to Monastrol and MG132 with either ZM447439 or DMSO (solvent control), prior to immunostaining. d Images of cells expressing Mis12-INCENP-GFP treated as in c and immunostained with antibodies against Tubulin, SKAP and GFP. White arrowheads in cropped images show ‘Lateral’ kinetochore lacking SKAP (upper panel) and ‘End-on’ kinetochore enriched with SKAP (lower panel). Scale: 5 μm in uncropped and 2 μm in cropped images. Boxed areas in a and d correspond to cropped images. e Graph shows percentage of lateral, end-on and detached kinetochores in Mis12-INCENP-GFP expressing cells treated as in c. Each circle represents value from one cell. Black horizontal bar marks average values from three independent experimental repeats. ‘*’ indicates statistically significant difference on the basis of P-values obtained using unpaired Student’s t-test
Fig. 2
Fig. 2
Constitutive Aurora-B activity at the outer-kinetochore allows lateral attachments but disrupts end-on conversion. a Single-plane time-lapse images of Z-stacks show the fate of a lateral KT (red) attached to MT (green). Time-lapse images of HeLa cells expressing mKate2-Tubulin and either Mis12-INCENP-GFP or Mis12-INCENP (TAA)-GFP mutant were acquired in the presence of Monastrol. Yellow arrows mark shrinking lateral K-fibre and white arrows show the synchronous movement of the KT with MT-end. White arrowheads mark the KT tracked. For three final time-points (left panels) ‘intensified’ images are included to highlight the K-fibre. Scale bar: 2 μm. b Graphs show the percentage of lateral (left) or end-on (right) kinetochores that transitioned into other attachment states (D-detached, L-lateral and E-end-on) in time-lapse movies as in a. c Graph shows the difference between ΔMT (change in MT-end position) and ΔKT (change in KT position) through time, used to define synchronous or asynchronous movements. Values less than 0.25 μm (marked by dashed line), sustained for at least 30 s, are indicated as synchronous (green) movement between the KT and MT-end. All other values are indicated as asynchronous movements of the KT and MT-end. d Graph shows the time spent by lateral kinetochores on MT-walls, before changing into another attachment state, in cells expressing either Mis12-INCENP-GFP or Mis12-INCENP (TAA)-GFP. Red and black bars mark mean-time and SD values, respectively, across kinetochores in three experiments. Error bars in b and c are SEM values across experiments b or across kinetochores c. ‘*’ and ‘#’ indicate statistically significant and insignificant differences, respectively, on the basis of P-values obtained across three experimental repeats using a Proportion test b or unpaired Student’s t-test d. e Cartoon shows how Aurora-B at the outer-kinetochore disrupts the end-on conversion process by detaching lateral kinetochores prior to end-on conversion. Aurora-B at the outer-kinetochore does not interfere with the capture or maintenance of kinetochores on microtubule walls. Reducing Aurora-B activity allows the formation of mature end-on attachments
Fig. 3
Fig. 3
Spatially distinct pools of Aurora-B impede distinct steps of the end-on conversion process. a Images of cells expressing CenpB-INCENP-GFP exposed to Monastrol and MG132 with either ZM447439 or DMSO (solvent control), as indicated, prior to immunostaining with antibodies against Tubulin, SKAP and GFP. Cropped images show lateral (upper row) and end-on (lower row) kinetochores. Scale: 5 μm in main and 2 μm in cropped images. Boxed areas correspond to cropped images. b Graph shows percentage of lateral, end-on and detached kinetochores in CenpB-INCENP-GFP expressing cells treated as in a. Each circle represents values from one cell. Black bar marks average values from two independent experimental repeats. * indicates statistically significant difference on the basis of P-values obtained using unpaired Student’s t-test. c Single-plane time-lapse images of Z-stacks show the fate of a lateral or end-on KT (red) bound to MT (green). Time-lapse images of HeLa cells expressing mKate2-Tubulin and CenpB-INCENP-GFP treated with Monastrol. White arrowheads mark KT tracked. Yellow arrows mark the tip of lateral K-fibre. Scale: 2 μm. d Graph shows percentage of lateral or end-on kinetochores that transitioned into other attachment states (D-detached, L-lateral and E-end-on) in time-lapse movies as in c. Error bars are SEM values across three experimental repeats e Cumulative frequency plots show time spent by lateral kinetochores on MT-walls, before changing into another attachment state, in cells expressing either Mis12-INCENP-GFP or CenpB-INCENP-GFP. Error bars are SEM values across three experimental repeats. Note: Mis12-INCENP-GFP curve values were obtained from data presented in Fig. 3d. T50 values are in seconds derived from the cumulative frequency plot. f Table contrasts the consequence of localizing Aurora-B at the outer kinetochore (KT) vs. centromere (cen), using Mis12-INCENP-GFP and CenpB-INCENP-GFP fusion proteins, respectively. Both fusion proteins disrupt end-on conversion but they differently control the fate of lateral attachments (within yellow box). Active Aurora-B status (Active AurB) was assessed using immuno-staining with antibodies against AuroraB-pThr232 as in Fig. 1a. KT-MT attachment status was obtained from fixed-cell studies. Fate of lateral kinetochore and instances of non-productive end-on attachments and productive end-on conversion are from live-cell movies
Fig. 4
Fig. 4
BubR1 associated PP2A, but not KNL1 associated PP1, plays a significant role in the end-on conversion process. a Experimental regime: BubR1 siRNA treated HeLa FRT/TO cells conditionally expressing Venus (YFP)-BubR1 (WT or ∆660–685 mutant) were exposed to Doxycycline for 24 h and MG132 for 1 h prior to immunostaining. b Images of cells treated as in a, immunostained with antibodies against GFP, Tubulin and Astrin and stained with DAPI for DNA. Scale: 5 µm in uncropped and 1 µm in cropped images. Boxed areas correspond to cropped images. c Graph of Astrin intensities on congressed or uncongressed kinetochores in cells expressing Venus (YFP) tagged -BubR1 WT or ∆660–685 mutant, as in b. Horizontal lines show average values (in green) across KTs from two independent experiments. Each circle represents values from one kinetochore. d Images of cells treated as in a, immunostained with antibodies against GFP and Tubulin and CREST anti-sera and stained with DAPI for DNA. Scale: 5 µm in uncropped and 1 µm in cropped images. Boxed areas correspond to cropped images. e Graph shows percentage of lateral vs. end-on kinetochores in Venus-BubR1 (WT or ∆660–685 mutant) expressing cells treated as in d. Each circle represents values from one cell. Black bar marks average values from four independent experiments. f Images of KNL1 siRNA treated HeLa cells expressing LAP-tagged KNL1 WT or mutants (2A or 4A). Following plasmid transfection, cells were exposed to Doxycycline for 1 h and then incubated in Doxycycline-free media for 30 h. Prior to fixation cells were exposed to MG132 for 45 min and immunostained with antibodies against GFP, Tubulin and Astrin. Scale: 5 µm in uncropped and 2 µm in cropped images. Boxed areas correspond to cropped images. g Graph shows percentage of lateral vs. end-on kinetochores in LAP tagged KNL1 (WT, 4A or 2A mutant) expressing cells, treated as in f. Each circle represents values from one cell. Black bar marks average values from three independent experimental repeats. In c, e and g, ‘*’ and # indicate statistically significant and insignificant differences, respectively (assessed using P-values from unpaired Student’s t-test)
Fig. 5
Fig. 5
Astrin-SKAP complex mediates a late step of the end-on conversion process. a Experimental regime: Cells treated with Monastrol and MG132 for 2 h and ZM447439 for 45 min were immunostained using antibodies against Tubulin and SKAP and CREST antisera. DNA was stained using DAPI. b Immunofluorescence images of HeLa cells transfected with control, SKAP or Astrin siRNA, as indicated, and treated as in a. Magnified images in the right-most panels correspond to boxed area. Scale bar: 5 μm. c Single-plane time-lapse images of Z-stacks show the fate of lateral kinetochores (red) attached to MTs (green) in Control or SKAP siRNA treated HeLaYFP-Tub; CenpB-Red cells in Monastrol. White arrowheads mark the KT tracked. Yellow arrows mark shrinking lateral K-fibre and white arrows highlight synchronous movement of the KT and MT-end. Scale bar: 2 μm. d Graph shows percentage of lateral kinetochores that remained lateral (L) or transitioned into other attachment states (D–detached; E–end-on) in time-lapse movies as in c. Error bars represent SEM from four experiments. e Graph of time spent by lateral kinetochores on MT-walls, before changing into another attachment state, in control or SKAP siRNA treated cells. Red and black bars mark mean-time and SD values, respectively, across kinetochores from four independent experiments. # indicates statistically insignificant difference (unpaired Student’s t-test). f Immunoblots of lysates of cells treated with control or SKAP siRNA harvested after time-lapse microscopy. Antibodies against SKAP and γ-Tubulin (loading control) were used. g Images of bipolar spindles with congressed chromosomes in control or SKAP siRNA transfected cells treated with MG132 and ZM447439 and immunostained as in a. Scale bar: 5 μm in uncropped and 2 μm in cropped images. Boxed areas correspond to cropped images. h Cartoon illustrates SKAP’s role in the end-on conversion process: (i) SKAP is selectively recruited to end-on (mature) but not lateral (immature) kinetochores. (ii) SKAP is crucial for the lateral to end-on conversion event but not required for tethering kinetochores onto microtubule walls. Finally, reducing Aurora-B allows end-on attachments in a SKAP dependent manner
Fig. 6
Fig. 6
Schematic description of the end-on conversion process. On laterally attached kinetochores, outer-kinetochore associated Aurora-B kinase and BubR1-PP2A phosphatase levels are high. End-on conversion requires the reduction of outer-kinetochore associated Aurora-B activity, which potentially tips the balance in favour of BubR1-associated PP2A phosphatase allowing the gradual recruitment of Astrin-SKAP complex. Concomitantly, end-tethered kinetochores experience end-on pulling and intra-kinetochore tension, which can spatially separate centromeric Aurora-B from outer-kinetochore substrates. This progressive reduction in Aurora-B activity at the outer-kinetochore will promote further enrichment of Astrin-SKAP complex—a crucial late event in end-on conversion that is essential to maintain mature end-on attachments. Red circles mark outer and inner kinetochore associated Aurora-B, green circles mark BubR1 and blue circles mark Astrin-SKAP

Similar articles

Cited by

References

    1. Alexander SP, Rieder CL. Chromosome motion during attachment to the vertebrate spindle: initial saltatory-like behavior of chromosomes and quantitative analysis of force production by nascent kinetochore fibers. J. Cell Biol. 1991;113:805–815. doi: 10.1083/jcb.113.4.805. - DOI - PMC - PubMed
    1. Tanaka K, et al. Molecular mechanisms of kinetochore capture by spindle microtubules. Nature. 2005;434:987–994. doi: 10.1038/nature03483. - DOI - PubMed
    1. Magidson V, et al. The spatial arrangement of chromosomes during prometaphase facilitates spindle assembly. Cell. 2011;146:555–567. doi: 10.1016/j.cell.2011.07.012. - DOI - PMC - PubMed
    1. Shrestha RL, Draviam VM. Lateral to end-on conversion of chromosome-microtubule attachment requires kinesins CENP-E and MCAK. Curr. Biol. 2013;23:1514–1526. doi: 10.1016/j.cub.2013.06.040. - DOI - PMC - PubMed
    1. Skibbens RV, Skeen VP, Salmon ED. Directional instability of kinetochore motility during chromosome congression and segregation in mitotic newt lung cells: a push-pull mechanism. J. Cell. Biol. 1993;122:859–875. doi: 10.1083/jcb.122.4.859. - DOI - PMC - PubMed

Publication types