. 2017 Jul 27;7(1):6656.
doi: 10.1038/s41598-017-06523-2.

Activation of mitophagy leads to decline in Mfn2 and loss of mitochondrial mass in Fuchs endothelial corneal dystrophy

Affiliations

Activation of mitophagy leads to decline in Mfn2 and loss of mitochondrial mass in Fuchs endothelial corneal dystrophy

Anne-Sophie Benischke et al. Sci Rep. .

Abstract

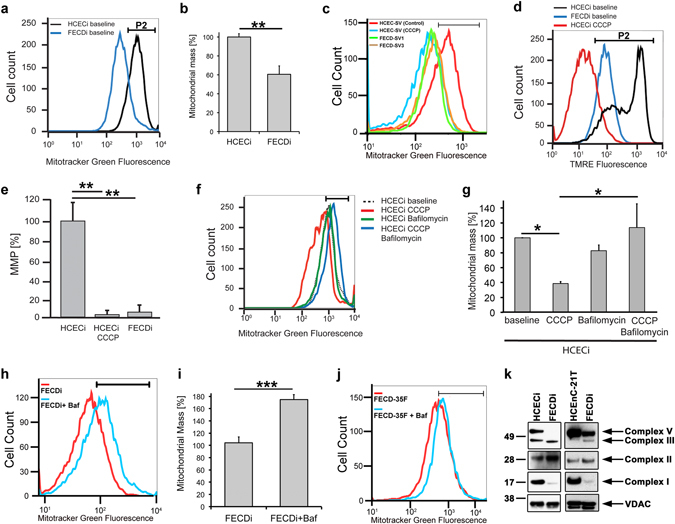
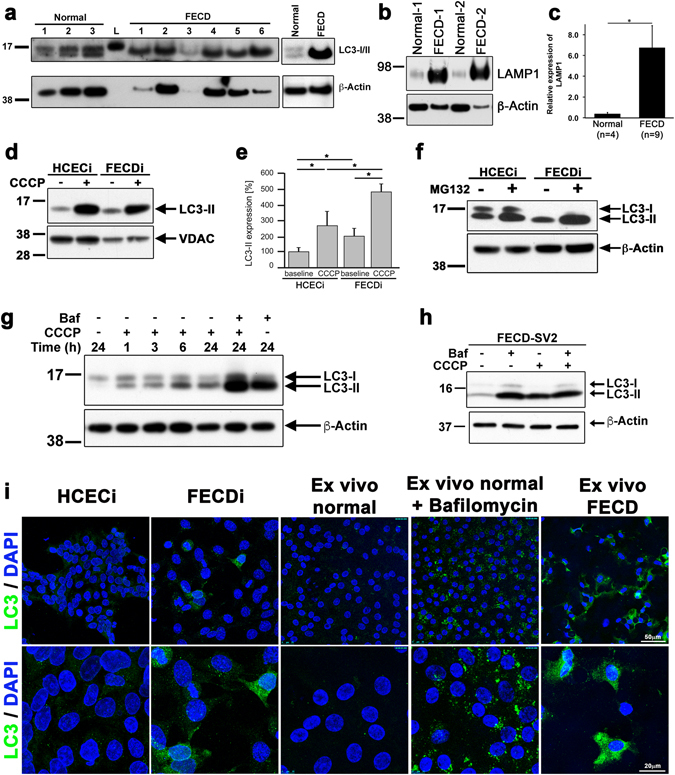
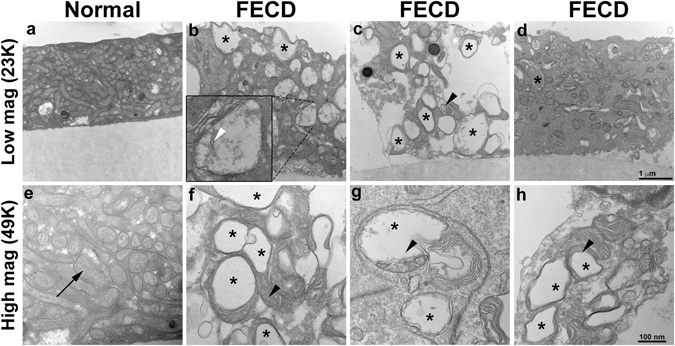
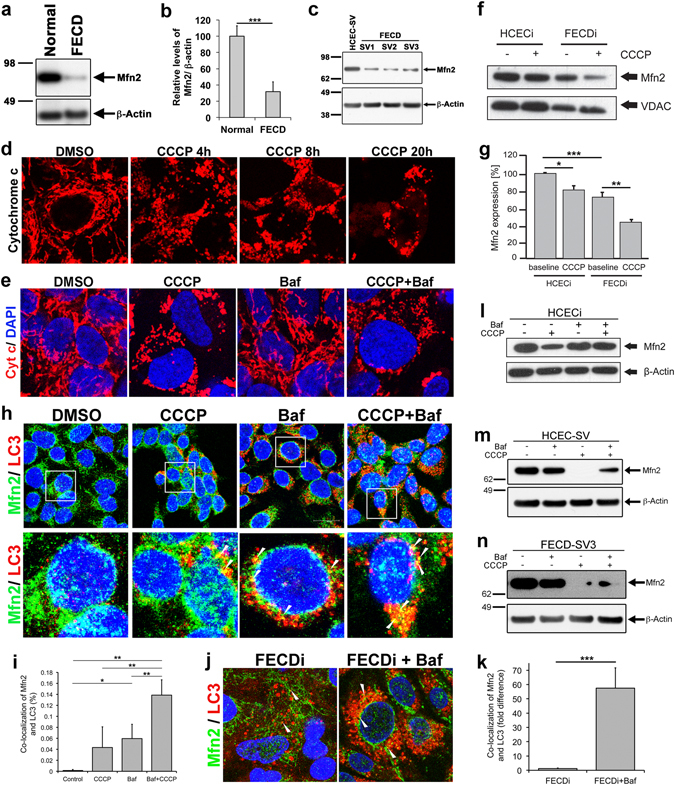
Human corneal endothelial cells (HCEnCs) are terminally differentiated cells that have limited regenerative potential. The large numbers of mitochondria in HCEnCs are critical for pump and barrier function required for corneal hydration and transparency. Fuchs Endothelial Corneal Dystrophy (FECD) is a highly prevalent late-onset oxidative stress disorder characterized by progressive loss of HCEnCs. We previously reported increased mitochondrial fragmentation and reduced ATP and mtDNA copy number in FECD. Herein, carbonyl cyanide m-chlorophenyl hydrazone (CCCP)-induced mitochondrial depolarization decreased mitochondrial mass and Mfn2 levels, which were rescued with mitophagy blocker, bafilomycin, in FECD. Moreover, electron transport chain complex (I, V) decrease in FECD indicated deficient mitochondrial bioenergetics. Transmission electron microscopy of FECD tissues displayed an increased number of autophagic vacuoles containing degenerated and swollen mitochondria with cristolysis. An elevation of LC3-II and LAMP1 and downregulation of Mfn2 in mitochondrial fractions suggested that loss of fusion capacity targets fragmented mitochondria to the pre-autophagic pool and upregulates mitophagy. CCCP-induced mitochondrial fragmentation leads to Mfn2 and LC3 co-localization without activation of proteosome, suggesting a novel Mfn2 degradation pathway via mitophagy. These data indicate constitutive activation of mitophagy results in reduction of mitochondrial mass and abrogates cellular bioenergetics during degeneration of post-mitotic cells of ocular tissue.


Conflict of interest statement

The authors declare that they have no competing interests.

Figures

Figure 1
Figure 1
FECD cell lines exhibit decreased mitochondrial membrane potential and mass. (a) Representative histogram of Mitotracker Green FM fluorescence intensity plotted against number of cells shows decreased mitochondrial mass in FECDi within the population of cells present in gate P2. (b) Quantification of mitochondrial mass from three independent experiments in FECDi. Bars show average percentage of cells in gate P2 (+SEM) from three experiments with HCECi normalized to 100%. (c) Two FECD (FECD-SV1 and –SV3) and one normal (HCEC-SV) corneal endothelial cell lines generated with SV40 transduction shows reduced mitochondrial mass in FECD-SV1 and –SV3 that overlaps 20 μM CCCP-treated HCECi-SV. (d) Flow cytometry analysis of mitochondrial membrane potential (∆Ψm) measured by TMRE in HCECi and FECDi. HCECi treated with 20 μM CCCP resulted in the abrogation of ∆Ψm in HCECi that is comparable to FECDi. (e) Bars represent average percentage of cells in gate P2 (+SEM) from three independent experiments. (f,g) Flow cytometry analysis and quantification of mitochondrial mass in HCECi treated with 20 μM CCCP, 10 nM bafilomycin, or both with Mitotracker Green FM. Mitochondrial mass in HCECi is reduced with CCCP and is rescued by bafilomycin. (h) FECDi cells treated with 10 nM bafilomycin for 16 h shows an increase in mitochondrial mass and quantified from three independent experiments in (i). (j) Mitochondrial mass is also increased in FECD primary cells (FECD-35F) treated with bafilomycin. (k) Western blot of whole cell lysates from two normal (HCECi and HCEnC-21T) and FECDi cell lines shows absence of complex I and V of the electron transport chain in FECDi. VDAC was used as a loading control. Student’s t-test was performed to test the statistical significance. *P < 0.05, **P < 0.01, ***P < 0.001.
Figure 2
Figure 2
Autophagy marker LC3-II to –I ratio is increased in FECD. (a) LC3-I to LC3-II protein expression was compared between normal (n = 3) and FECD (n = 6) specimens. Normal specimens expressed both LC3-I and –II, whereas LC3-I was not detected in FECD specimens. LC3-II was markedly higher in FECD specimens indicating an increased activation of autophagy. (right) Western blotting of an independent normal and FECD specimen shows elevated LC3-II levels with the absence of LC3-I. (b) Normal and FECD specimens tested for the expression of the lysosomal marker LAMP1 and quantified in (c). (d) Western blotting of mitochondrial fractions from HCECi and FECDi cells treated with CCCP probed for LC3 shows increased LC3-II in FECDi that is further activated with CCCP. (e) Quantification of LC3 in (d) normalized with VDAC. Bars represent the average (+SEM) of normalized LC3-II from three independent experiments. (f) HCECi and FECDi were exposed to the proteasome inhibitor 50  μM MG132 for 6 hours. LC3-II expression was increased in FECDi compared to HCECi, indicating autophagy pathway is activated after inhibition of the proteasome. (g) Treatment of HCEnC-21T cells with 20 μM CCCP shows a time-dependent increase in conversion of LC3-I to LC3-II. Inhibition of the fusion of autophagosome with lysosome with 10 nM bafilomycin leads to the accumulation of LC3-II that is further exacerbated when combined with CCCP. (h) Western blot of FECD-SV2 lysates show increased LC3-II that is upregulated with bafilomycin and CCCP. (i) Confocal micrographs showing immunolocalization of LC3 in HCECi and FECDi suggests increased LC3 in FECDi. A normal donor cornea was cut into two halves were either untreated or treated with 10 nM bafilomycin for 16 h. Increased LC3 staining was seen in the bafilomycin treated specimen (positive control). FECD ex vivo specimen showed increased LC3 with higher intensity compared to the positive control suggesting increased autophagy in FECD. Student’s t-test was performed to test the statistical significance. *P < 0.05 and **P < 0.01.
Figure 3
Figure 3
FECD specimens reveal an abundance of autophagic structures and abnormal mitochondria with loss of ETC complex. Transmission electron micrographs of a normal ex vivo specimen (a,e) show the presence of high density of normal mitochondria (black arrow) in a corneal endothelial cell. Panels b–d and f–h are representative images of FECD ex vivo specimen that suggest increased number of autophagic structures in the form of vacuoles (black stars). Black arrowheads in panels c,fh indicate autophagosomes containing mitochondria and white arrowhead in panel ii indicates degraded mitochondrial cristae.
Figure 4
Figure 4
Mitophagy drives loss of mitochondrial fusion protein Mfn2 in FECD. (a) Representative western blot of Mfn2 shows reduced expression in an FECD specimen compared to normal donor. (b) Quantification of western blot of Mfn2 (average + SEM) normalized with β-actin from normal donors (n = 10) and FECD ex vivo specimens (n = 10) showed a loss of Mfn2 in FECD (P = 0.0005, Student’s t-test). (c) Western blot of SV40 immortalized normal (HCEC-SV) and FECD cell lines (FECD-SV1, -SV2, and -SV3) show reduced Mfn2 levels that corroborated with human specimens. (d) Time course of mitochondrial fragmentation observed with the immunolocalization of cytochrome c in normal corneal endothelial cell lines treated with 20 μM CCCP. (e) CCCP- induced mitochondrial fragmentation is unaltered with autophagosome inhibitor bafilomycin (10 nM) (CCCP + baf panel), whereas bafilomycin alone does not disrupt the normal mitochondrial architecture (Baf panel). (f) Western blot shows a reduction of Mfn2 in the mitochondrial fractions in normal cell line treated with CCCP as well as basal levels in FECDi cells. (g) Quantification of Mfn2 expression levels normalized with VDAC representing average + SEM of three independent experiments. CCCP induces a 42% reduction in Mfn2 in FECDi cells compared to a 20% decrease in HCECi. (h) Mfn2 co-localizes with LC3 that visualized moderately in normal cells treated with 20 μM CCCP for 8 h and increased spots of co-localization are observed with 10 nM bafilomycin (white arrowheads) suggesting degradation of Mfn2 through mitophagy. (i) Quantification of co-localization of LC3 and Mfn2 shows an increase in co-localization in bafilomycin treated HCECi cells and a further increase in cells treated with CCCP and bafilomycin. (j) FECDi cells show increased autophagosome formation visualized with LC3 staining that appear as vesicles (left panel). Treatment with 10 nM bafilomycin for 16 h led to increase in colocalization of Mfn2 and LC3 (right panel). (k) Quantification of co-localization of Mfn2 and LC3 in FECDi cells shows an increase in cells treated with bafilomycin. (ln) Treatment with CCCP and bafilomycin stabilized Mfn2 protein levels as compared to CCCP treatment alone in two normal (HCECi, panel j; HCEC-SV, panel k) and one FECD cell line (FECD-SV3, panel l) suggesting that activated mito/autophagy degradation pathway likely accounts for Mfn2 protein degradation in FECD. Student’s t-test was performed in (b,k) and one-way ANOVA in (i) to test the statistical significance. *P < 0.05, **P < 0.01 and ***P < 0.001.

Similar articles

Cited by

References

    1. Schmedt T, Silva MM, Ziaei A, Jurkunas U. Molecular bases of corneal endothelial dystrophies. Exp Eye Res. 2012;95:24–34. doi: 10.1016/j.exer.2011.08.002. - DOI - PMC - PubMed
    1. Joyce NC, Zhu CC, Harris DL. Relationship among oxidative stress, DNA damage, and proliferative capacity in human corneal endothelium. Invest Ophthalmol Vis Sci. 2009;50:2116–2122. doi: 10.1167/iovs.08-3007. - DOI - PubMed
    1. Darlington JK, Adrean SD, Schwab IR. Trends of penetrating keratoplasty in the United States from 1980 to 2004. Ophthalmology. 2006;113:2171–2175. doi: 10.1016/j.ophtha.2006.06.034. - DOI - PubMed
    1. Kim EC, Meng H, Jun AS. N-Acetylcysteine increases corneal endothelial cell survival in a mouse model of Fuchs endothelial corneal dystrophy. Exp Eye Res. 2014;127:20–25. doi: 10.1016/j.exer.2014.06.002. - DOI - PMC - PubMed
    1. Liu C, Chen Y, Kochevar IE, Jurkunas UV. Decreased DJ-1 leads to impaired Nrf2-regulated antioxidant defense and increased UV-A-induced apoptosis in corneal endothelial cells. Invest Ophthalmol Vis Sci. 2014;55:5551–5560. doi: 10.1167/iovs.14-14580. - DOI - PMC - PubMed

Publication types

Substances