

Static Magnetic Field Stimulation Enhances Oligodendrocyte Differentiation and Secretion of Neurotrophic Factors
- PMID: 28751716
- PMCID: PMC5532210
- DOI: 10.1038/s41598-017-06331-8
Static Magnetic Field Stimulation Enhances Oligodendrocyte Differentiation and Secretion of Neurotrophic Factors
Abstract
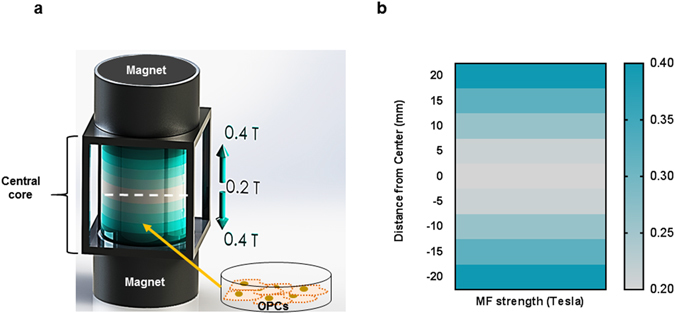
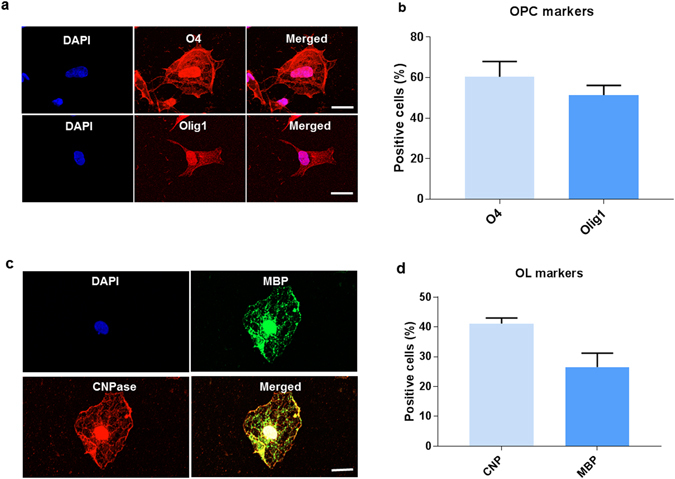
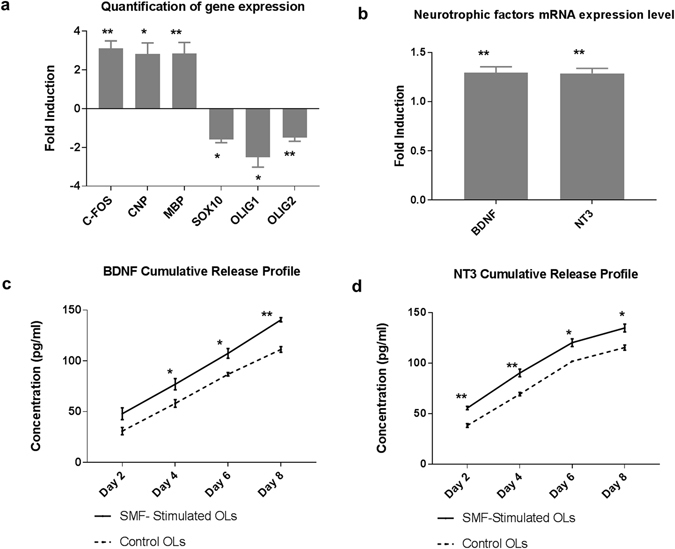
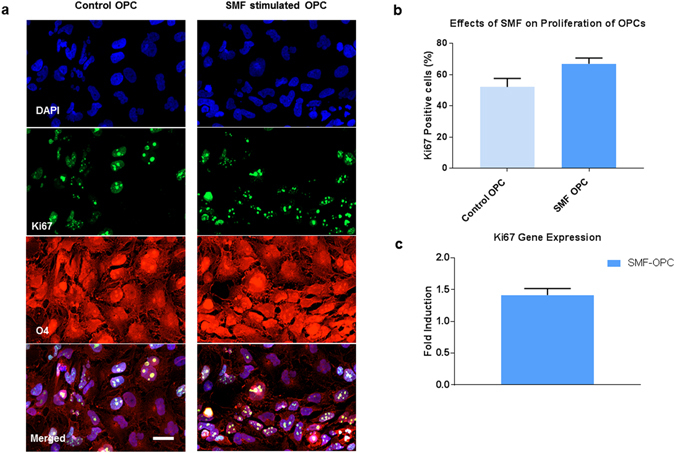
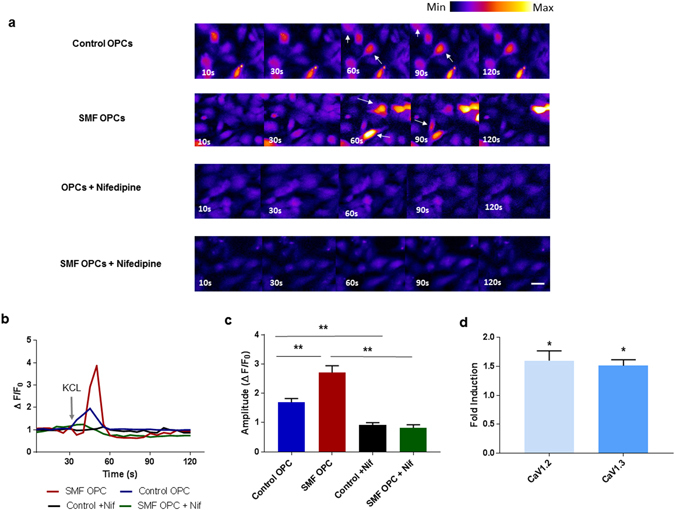
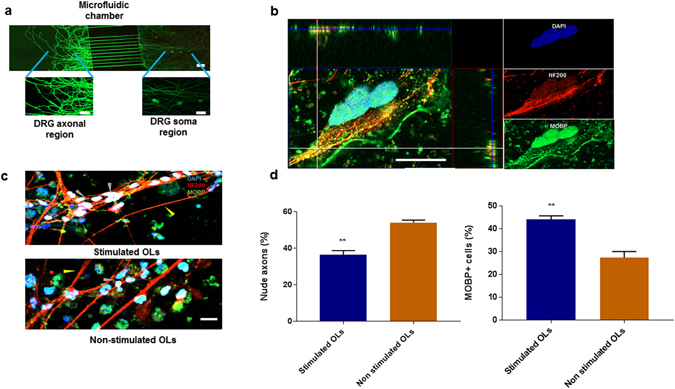
The cellular-level effects of low/high frequency oscillating magnetic field on excitable cells such as neurons are well established. In contrast, the effects of a homogeneous, static magnetic field (SMF) on Central Nervous System (CNS) glial cells are less investigated. Here, we have developed an in vitro SMF stimulation set-up to investigate the genomic effects of SMF exposure on oligodendrocyte differentiation and neurotrophic factors secretion. Human oligodendrocytes precursor cells (OPCs) were stimulated with moderate intensity SMF (0.3 T) for a period of two weeks (two hours/day). The differential gene expression of cell activity marker (c-fos), early OPC (Olig1, Olig2. Sox10), and mature oligodendrocyte markers (CNP, MBP) were quantified. The enhanced myelination capacity of the SMF stimulated oligodendrocytes was validated in a dorsal root ganglion microfluidics chamber platform. Additionally, the effects of SMF on the gene expression and secretion of neurotrophic factors- BDNF and NT3 was quantified. We also report that SMF stimulation increases the intracellular calcium influx in OPCs as well as the gene expression of L-type channel subunits-CaV1.2 and CaV1.3. Our findings emphasize the ability of glial cells such as OPCs to positively respond to moderate intensity SMF stimulation by exhibiting enhanced differentiation, functionality as well as neurotrophic factor release.
Conflict of interest statement
The authors declare that they have no competing interests.
Figures
Similar articles
-
Human fetal oligodendrocyte progenitor cells from different gestational stages exhibit substantially different potential to myelinate.Stem Cells Dev. 2012 Jul 20;21(11):1831-7. doi: 10.1089/scd.2011.0494. Epub 2012 Jan 26. Stem Cells Dev. 2012. PMID: 22122665
-
Accelerated generation of oligodendrocyte progenitor cells from human induced pluripotent stem cells by forced expression of Sox10 and Olig2.Sci China Life Sci. 2016 Nov;59(11):1131-1138. doi: 10.1007/s11427-016-0165-3. Epub 2016 Oct 25. Sci China Life Sci. 2016. PMID: 27785726
-
Human induced pluripotent stem cells differentiation into oligodendrocyte progenitors and transplantation in a rat model of optic chiasm demyelination.PLoS One. 2011;6(11):e27925. doi: 10.1371/journal.pone.0027925. Epub 2011 Nov 18. PLoS One. 2011. PMID: 22125639 Free PMC article.
-
Using the lineage determinants Olig2 and Sox10 to explore transcriptional regulation of oligodendrocyte development.Dev Neurobiol. 2021 Oct;81(7):892-901. doi: 10.1002/dneu.22849. Epub 2021 Sep 15. Dev Neurobiol. 2021. PMID: 34480425 Review.
-
The Effects of the Olig Family on the Regulation of Spinal Cord Development and Regeneration.Neurochem Res. 2021 Nov;46(11):2776-2782. doi: 10.1007/s11064-021-03383-1. Epub 2021 Jul 6. Neurochem Res. 2021. PMID: 34228233 Review.
Cited by
-
Altered Expression of Ion Channels in White Matter Lesions of Progressive Multiple Sclerosis: What Do We Know About Their Function?Front Cell Neurosci. 2021 Jun 25;15:685703. doi: 10.3389/fncel.2021.685703. eCollection 2021. Front Cell Neurosci. 2021. PMID: 34276310 Free PMC article. Review.
-
Mapping the Landscape of Magnetic Field Effects on Neural Regeneration and Repair: A Combined Systematic Review, Mathematical Model, and Meta-Analysis.J Tissue Eng Regen Med. 2023 Sep 21;2023:5038317. doi: 10.1155/2023/5038317. eCollection 2023. J Tissue Eng Regen Med. 2023. PMID: 40226417 Free PMC article.
-
CellGO: a novel deep learning-based framework and webserver for cell-type-specific gene function interpretation.Brief Bioinform. 2023 Nov 22;25(1):bbad417. doi: 10.1093/bib/bbad417. Brief Bioinform. 2023. PMID: 37995133 Free PMC article.
-
Modulation of Neural Activity for Myelination in the Central Nervous System.Front Neurosci. 2019 Sep 6;13:952. doi: 10.3389/fnins.2019.00952. eCollection 2019. Front Neurosci. 2019. PMID: 31555087 Free PMC article. Review.
-
Static magnetic field promotes the doxorubicin toxicity effects on osteosarcoma cells.Sci Rep. 2025 Apr 7;15(1):11902. doi: 10.1038/s41598-025-96802-0. Sci Rep. 2025. PMID: 40195518 Free PMC article.
References
-
- Klimovskaya LD, Smirnova NP. Changes in brain-evoked potentials under the influence of a permanent magnetic field. Bulletin of Experimental Biology and Medicine. 1976;82:1125–1129. doi: 10.1007/BF00785533. - DOI
Publication types
MeSH terms
Substances
LinkOut - more resources
Full Text Sources
Other Literature Sources
Research Materials
Miscellaneous
