

Hepatocyte specific TIMP3 expression prevents diet dependent fatty liver disease and hepatocellular carcinoma
- PMID: 28751722
- PMCID: PMC5532242
- DOI: 10.1038/s41598-017-06439-x
Hepatocyte specific TIMP3 expression prevents diet dependent fatty liver disease and hepatocellular carcinoma
Abstract
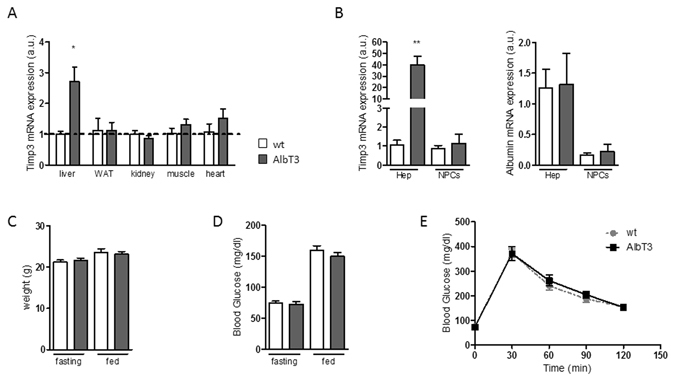
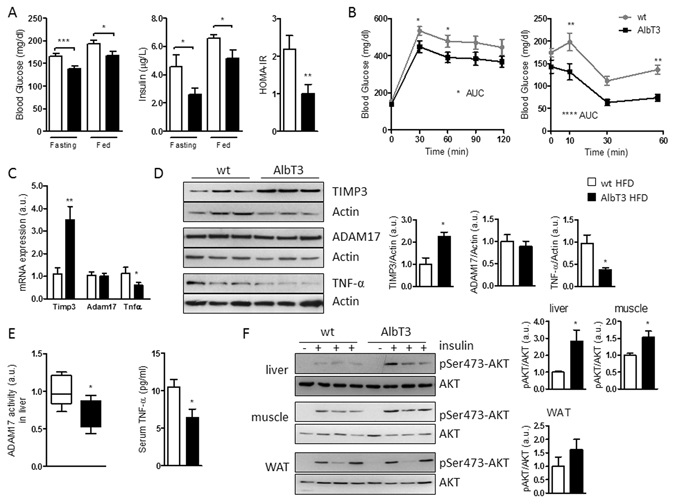
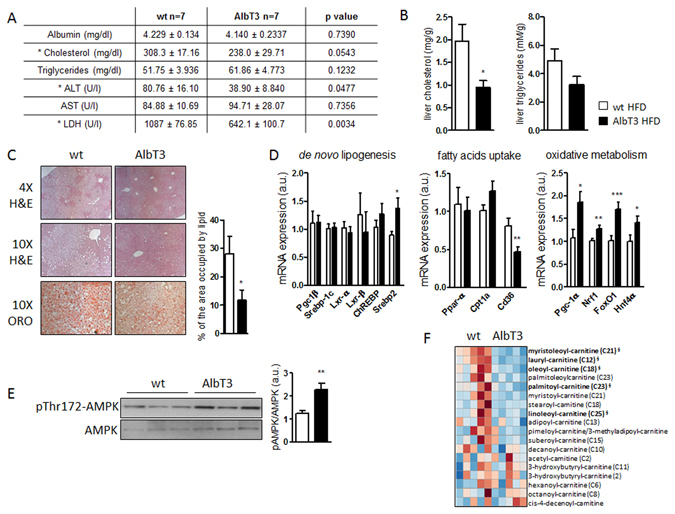
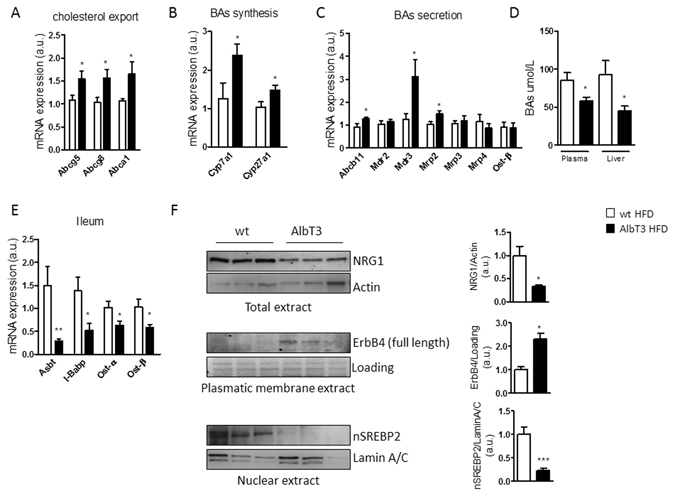
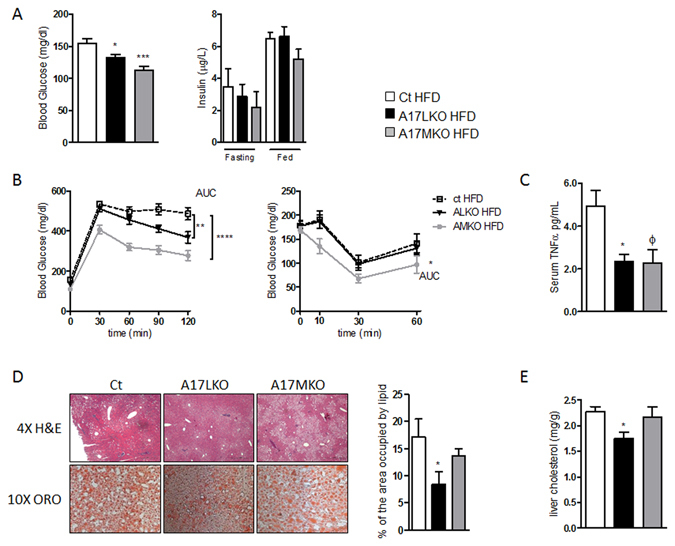
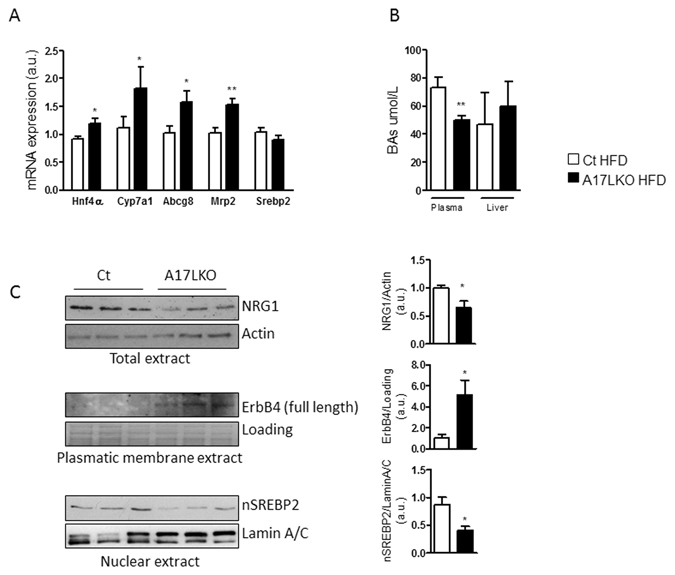
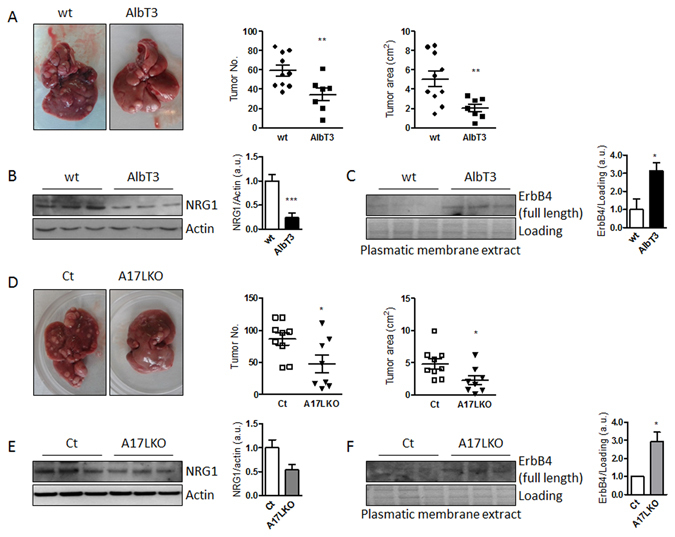
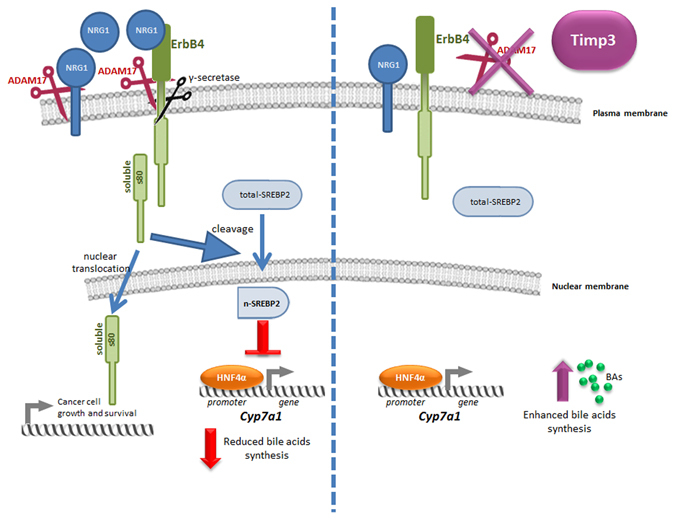
Non-alcoholic fatty liver disease (NAFLD) encompasses a broad spectrum of conditions, ranging from non-progressive bland steatosis to hepatocarcinoma. Tissue inhibitor of metalloproteinase 3 (Timp3) has a role in the pathogenesis of fatty liver disease associated with obesity and is silenced during metabolic disorders and liver cancer. We generated an hepatocyte-specific TIMP3 'gain-of-function' mouse model under the control of the Albumin promoter (AlbT3) and investigated its effects during high-fat diet (HFD). After 16 weeks of HFD, TIMP3 overexpression significantly improved glucose metabolism, hepatic fatty acid oxidation and cholesterol homeostasis. In AlbT3 mice CYP7A1, MDR3 and MRP2 gene expressions were observed, consistent with higher bile acid synthesis and export. Next, to evaluate the role of A Disintegrin and Metalloproteinase 17 (ADAM17), a crucial target of TIMP3, in these processes, we created mice deficient in Adam17 specifically in hepatocyte (A17LKO) or in myeloid lineage (A17MKO), founding that only A17LKO showed improvement in liver steatosis induced by HFD. Moreover, both, AlbT3 and A17LKO significantly reduced diethylnitrosamine-initiated, HFD-promoted hepatic tumorigenesis assessed by tumor multiplicity and total tumor area. Taken together, these data indicate that hepatic TIMP3 can slow progression of NAFLD, and tumorigenesis, at least in part, through the regulation of ADAM17 activity.
Conflict of interest statement
The authors declare that they have no competing interests.
Figures
Similar articles
-
Timp3 deficiency affects the progression of DEN-related hepatocellular carcinoma during diet-induced obesity in mice.Acta Diabetol. 2019 Dec;56(12):1265-1274. doi: 10.1007/s00592-019-01382-x. Epub 2019 Jul 10. Acta Diabetol. 2019. PMID: 31292722
-
Sex hormone-binding globulin suppresses NAFLD-triggered hepatocarcinogenesis after menopause.Carcinogenesis. 2019 Aug 22;40(8):1031-1041. doi: 10.1093/carcin/bgz107. Carcinogenesis. 2019. PMID: 31168625
-
Hepatic Deletion of Carbohydrate Response Element Binding Protein Impairs Hepatocarcinogenesis in a High-Fat Diet-Induced Mouse Model.Int J Mol Sci. 2025 Mar 3;26(5):2246. doi: 10.3390/ijms26052246. Int J Mol Sci. 2025. PMID: 40076869 Free PMC article.
-
Hepatocellular carcinoma and non-alcoholic steatohepatitis: The state of play.World J Gastroenterol. 2016 Feb 28;22(8):2494-502. doi: 10.3748/wjg.v22.i8.2494. World J Gastroenterol. 2016. PMID: 26937137 Free PMC article. Review.
-
Autophagy and non-alcoholic fatty liver disease.Biomed Res Int. 2014;2014:120179. doi: 10.1155/2014/120179. Epub 2014 Sep 10. Biomed Res Int. 2014. PMID: 25295245 Free PMC article. Review.
Cited by
-
Strategies to Target ADAM17 in Disease: From its Discovery to the iRhom Revolution.Molecules. 2021 Feb 10;26(4):944. doi: 10.3390/molecules26040944. Molecules. 2021. PMID: 33579029 Free PMC article. Review.
-
Per- and polyfluoroalkyl substances activate UPR pathway, induce steatosis and fibrosis in liver cells.Environ Toxicol. 2023 Jan;38(1):225-242. doi: 10.1002/tox.23680. Epub 2022 Oct 17. Environ Toxicol. 2023. PMID: 36251517 Free PMC article.
-
Comprehensive scRNA-seq Analysis and Identification of CD8_+T Cell Related Gene Markers for Predicting Prognosis and Drug Resistance of Hepatocellular Carcinoma.Curr Med Chem. 2024;31(17):2414-2430. doi: 10.2174/0109298673274578231030065454. Curr Med Chem. 2024. PMID: 37936457
-
SARS-CoV-2 induces transcriptional signatures in human lung epithelial cells that promote lung fibrosis.Respir Res. 2020 Jul 14;21(1):182. doi: 10.1186/s12931-020-01445-6. Respir Res. 2020. PMID: 32664949 Free PMC article.
-
Modulatory effect of euxanthone in liver cancer-bearing obese mice: crosstalk between PPARγ and TIMP3 signalling axes.3 Biotech. 2021 Nov;11(11):464. doi: 10.1007/s13205-021-03019-9. Epub 2021 Oct 19. 3 Biotech. 2021. PMID: 34745815 Free PMC article.
References
Publication types
MeSH terms
Substances
LinkOut - more resources
Full Text Sources
Other Literature Sources
Medical
Molecular Biology Databases
Research Materials
Miscellaneous
