. 2017 Jul 13:8:97.
doi: 10.3389/fgene.2017.00097. eCollection 2017.

Simultaneous Methylation-Level Assessment of Hundreds of CpG Sites by Targeted Bisulfite PCR Sequencing (TBPseq)

Affiliations

Simultaneous Methylation-Level Assessment of Hundreds of CpG Sites by Targeted Bisulfite PCR Sequencing (TBPseq)

Kyuheum Jeon et al. Front Genet. .

Abstract

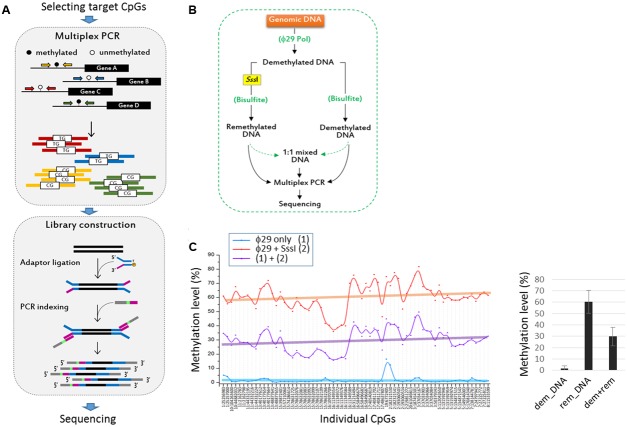
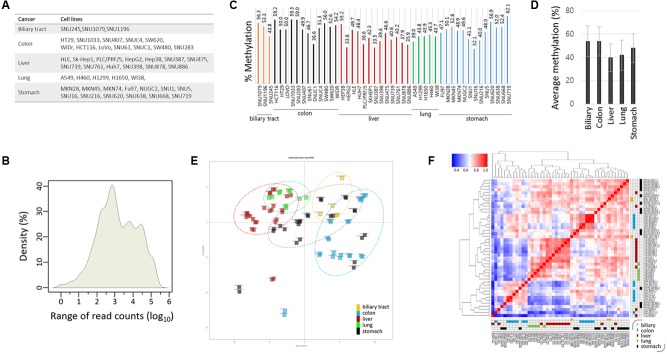
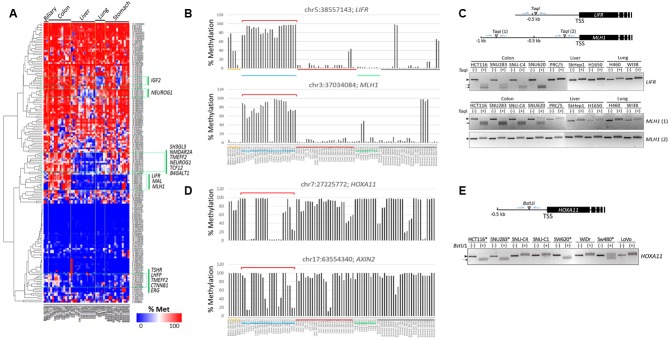
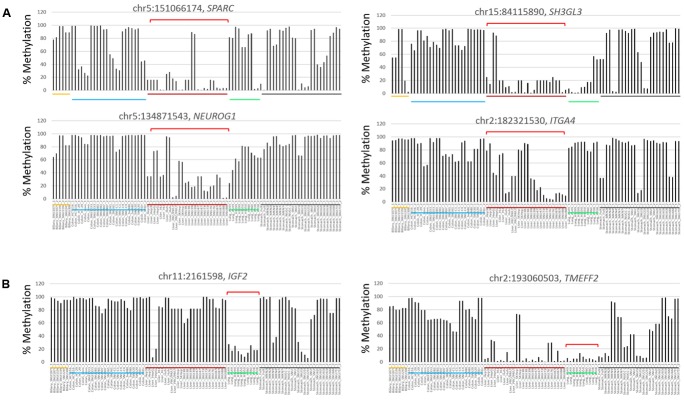
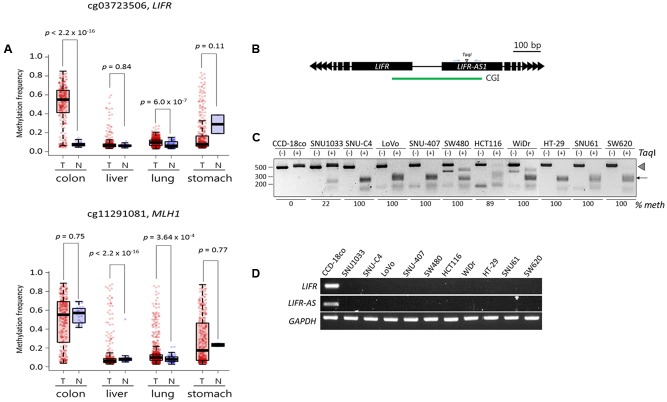
Methylated-DNA sequencing technologies are producing vast amounts of methylome data from cancer samples, from which cancer-associated differentially methylated CpG sites (cDMCs) are continuously identified and filed. The inclusion of as many cDMCs as possible helps improve the accuracy of cancer diagnosis and sometimes identify cancer subtypes. However, the lack of an established method for the analysis of 100s of cDMCs practically impedes their robust use in clinical medicine. Here, we tested the availability of targeted bisulfite-PCR-sequencing (TBPseq) technology for the assessment of methylation levels of a myriad of CpGs scattered over the genome. In randomly selected 46 cancer cell lines, multiplexed PCR yielded a variety of amplicons harboring 246 CpGs residing at promoters of 97 cancer-associated genes, all of which were sequenced in the same flow cell. Clustering analysis of the TBPseq-assessed methylation levels of target CpGs showed that the lung and liver cancer cell lines correlated relatively strongly with each other while they weakly correlated with colon cancer cells. CpGs at the LIFR gene promoter, which are known to be hypermethylated in colon cancers, indeed were heavily methylated in the tested colon cancer cells. Moreover, the LIFR promoter hypermethylation was found in colon cancer cells only, but not in biliary tract, liver, lung, and stomach cancers cell lines. A meta-analysis with public cancer methylome data verified the colon cancer specificity of LIFR promoter methylation. These results demonstrate that our TBPseq-based methylation assessment could be considered an effective, accurate, and competitive method to simultaneously examine a large number of target cDMCs and patient samples.

Keywords: DNA methylation; LIFR; cancer; diagnosis; sequencing; targeted NGS.


Figures

FIGURE 1
FIGURE 1
Evaluation of the targeted bisulfite PCR sequencing (TBPseq) method. (A) Illustration of TBPseq method. Colored horizontal arrows denote primers for target amplification. Amplicons have methylated (5′-CG-3′) or unmethylated (5′-TG-3′) sequences for target CpGs, the ratio of which is used for calculating methylation frequencies of the target CpGs. A total of 113 primer pairs were split into six groups of about 20 pairs for separate multiplexed PCR. (B) Strategy for evaluating the TBPseq method. The whole genomic DNA of 293T cells was amplified using ϕ29 DNA polymerase. A half of the resulting newly synthesized and unmodified (demethylated) DNA was re-methylated in vitro using CpG dinucleotide-specific SssI methylase. The remethylated and demethylated DNA fractions were equally treated with bisulfite and used as template in multiplex PCR with 20–25 primer pairs per reaction. Multiplex PCR was additionally performed with an equal mixture (1:1 mixed DNA) of the remethylated and demethylated DNA templates. The three different groups of amplicons were modified and differentially barcoded for Illumina sequencing. (C) Methylation levels of target CpG sites. Each CpG site has three different methylation levels that were obtained from demethylated DNA (ϕ29 only, blue), remethylated DNA (ϕ29 + SssI, red), and an equal mixture of them (purple). In the right panel, the mean methylation levels of target CPGs in the three DNA groups are shown (error bars, standard deviation). Individual CpG sites are indicated by their genomic position as “chromosome (chr) number:coordinate” using GRCh37/hg19 as reference genome.
FIGURE 2
FIGURE 2
Targeted bisulfite PCR sequencing statistics and correlation analysis. (A) List of cancer cell lines used in TBPseq. (B) Kernel density plot of read counts from the whole cancer samples. Individual target sequences have various read counts ranging from several 10s to 100s of 1000s. The mean methylation levels of target sequences in individual cancer cell lines (C) and in groups (D). Error bars, standard deviations. (E) Principal compartment analysis (PCA). Different cancer cell groups are circled in different colors. The intimate proximity of sample replicates on the PCA plot demonstrates the reproducibility and reliability of TBPseq method. (F) Unsupervised hierarchical clustering of Pearson correlation for target CpG methylation levels among cancer cell lines. Each cancer cell line is distinctively colored by the cancer type: yellow, biliary tract cancer; blue, colon cancer; red, liver cancer; green, lung cancer; black, stomach cancer.
FIGURE 3
FIGURE 3
Identification of CpG sites specifically methylated in colon cancer cell lines. (A) Heat map of the methylation levels of target CpGs. Target CpGs that are differentially methylated among the cell lines are indicated by green boxes with the associated gene symbols. Methylation levels of the LIFR and MLH1 (B) and HOXA11 and AXIN2 (D) CpG sites in colon cancer cell lines. Chromosomal locations of target CpG sites are represented as the chromosome (chr) number and coordinate of the position of cytosine. Cell lines of different cancer groups are indicated in different colors below: biliary tract, colon, liver, lung, and stomach cancer cell lines are yellow, blue, dark red, green, and black, respectively. Brackets (red) denote colon cancer cell lines showing differential methylation patterns. (C,E) Combined bisulfite restriction analysis (COBRA). Schematics show the relative positions of the transcription start sites (TSSs) of target genes and the restriction enzyme (TaqI or BstUI) site. Genomic DNA was treated with bisulfite to convert unmethylated cytosines to uracils, which are then amplified as thymines, and then used as a template in PCR. The PCR products were digested with the indicated restriction enzyme. If the region of interest were methylated, the PCR product would be digested. In (E), only colon cancer cell lines were included, and HOXA11 promoter-methylated cell lines are indicated by asterisks. Arrow heads and arrows indicate the band positions of intact and enzyme-digested PCR products, respectively.
FIGURE 4
FIGURE 4
Differentially methylated CpG sites in liver and lung cancer cell lines. Target CpGs at the SPARC, SH3GL3, NEUROG1, and ITGA4 gene promoters are frequently undermethylated in liver cancer cell lines (A) and so are those at the IGF2 and TMEFF2 gene promoters in lung cancer cell lines (B). Brackets (red) denote those of cell lines showing group-specific methylation patterns for indicated CpGs. Chromosomal locations of target CpG sites are represented as the chromosome (chr) number and coordinate of the position of cytosine. Each cancer cell line group is underlined below the bars (yellow, biliary tract; blue, colon; red, liver; lung, green; black, stomach cells).
FIGURE 5
FIGURE 5
Validation of the LIFR promoter methylation for cancer specificity and its relationship with the expression of associated genes. (A) DNA methylation levels of target CpGs in public cancer methylome data (Infinium 450K BeadChip array) of four cancer types: colorectal (n = 313 for cancer samples and n = 38 for normal samples), liver (377 and 50), lung (843 and 74), and stomach (395 and 2) cancers. Infinium CpG identification numbers (IDs) together with the associated gene names are shown; the Infinium IDs cg03723506 and cg11291081 indicate chr5:38557143 and chr3:37033894, respectively, in the Figure 3B. Statistical significance was calculated using Wilcoxon rank sum test. T: tumor samples, N: normal samples. (B) Schematic drawing of COBRA region at the LIFR promoter. Blue arrows, primers. CGI, CpG island (green line). (C) COBRA analysis. Genomic DNA was extracted from each colon cancer cell lines along with a normal control colon cell line (CCD-18co) and subjected to COBRA using the TaqI enzyme to examine the methylation state at the LIFR gene promoter. Arrowhead and arrow indicate the positions of intact and TaqI-digested DNA fragments, respectively. The fraction (% meth) of methylated DNA was measured by band intensity analysis and noted under each cell line. (D) RT-PCR. The same cancer cell lines used in COBRA (C) were subjected to RT-PCR to measure the transcript levels of the LIFR and LIFR-AS genes.

Similar articles

Cited by

References

    1. Ahlquist T., Lind G. E., Costa V. L., Meling G. I., Vatn M., Hoff G. S., et al. (2008). Gene methylation profiles of normal mucosa, and benign and malignant colorectal tumors identify early onset markers. Mol. Cancer 7:94 10.1186/1476-4598-7-94 - DOI - PMC - PubMed
    1. Bandaru B., Wyszynski M., Bhagwat A. S. (1995). HpaII methyltransferase is mutagenic in Escherichia coli. J. Bacteriol. 177 2950–2952. 10.1128/jb.177.10.2950-2952.1995 - DOI - PMC - PubMed
    1. Bibikova M., Barnes B., Tsan C., Ho V., Klotzle B., Le J. M., et al. (2011). High density DNA methylation array with single CpG site resolution. Genomics 98 288–295. 10.1016/j.ygeno.2011.07.007 - DOI - PubMed
    1. Bock C., Kiskinis E., Verstappen G., Gu H., Boulting G., Smith Z. D., et al. (2011). Reference maps of human ES and iPS cell variation enable high-throughput characterization of pluripotent cell lines. Cell 144 439–452. 10.1016/j.cell.2010.12.032 - DOI - PMC - PubMed
    1. Cho S., Park J. S., Kang Y. K. (2014). AGO2 and SETDB1 cooperate in promoter-targeted transcriptional silencing of the androgen receptor gene. Nucleic Acids Res. 42 13545–13556. 10.1093/nar/gku788 - DOI - PMC - PubMed

LinkOut - more resources