. 2017:2017:2489842.
doi: 10.1155/2017/2489842. Epub 2017 Jul 2.

Evaluation of Anti-Inflammatory Activities of Qingre-Qushi Recipe (QRQS) against Atopic Dermatitis: Potential Mechanism of Inhibition of IL-33/ST2 Signal Transduction

Affiliations

Evaluation of Anti-Inflammatory Activities of Qingre-Qushi Recipe (QRQS) against Atopic Dermatitis: Potential Mechanism of Inhibition of IL-33/ST2 Signal Transduction

Mengjiao Chen et al. Evid Based Complement Alternat Med. 2017.

Abstract

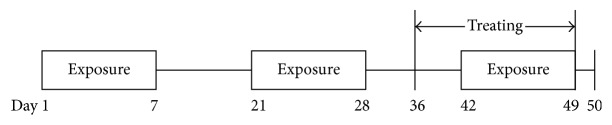
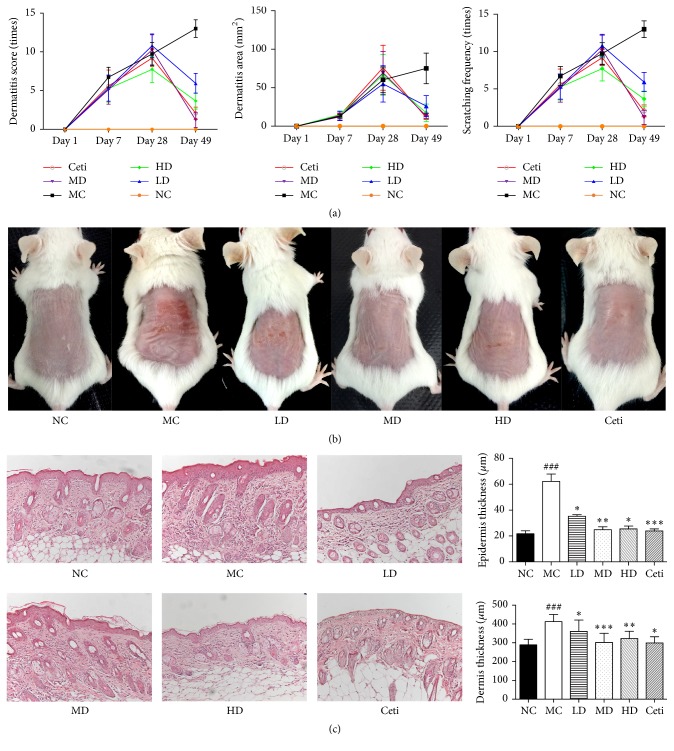
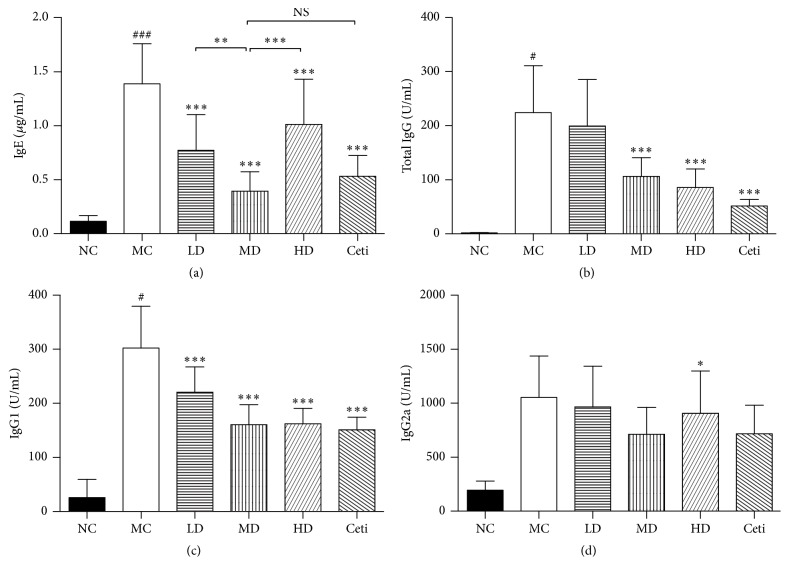
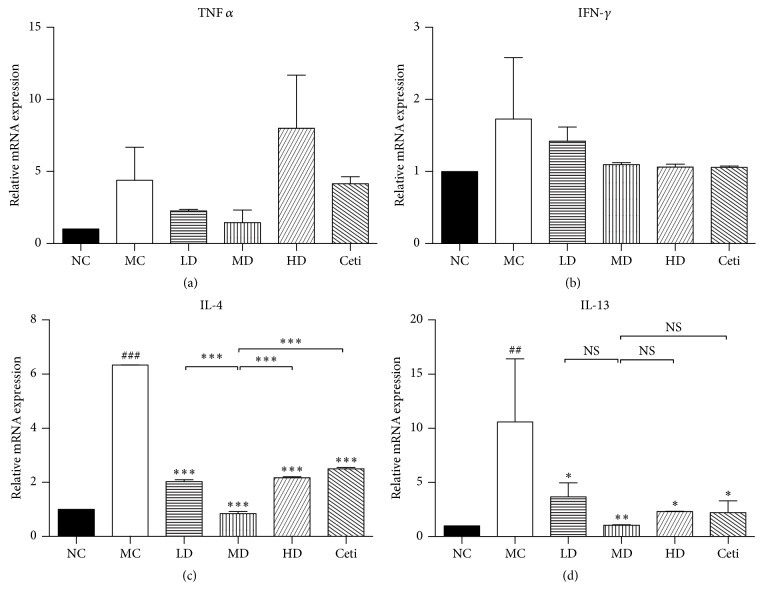
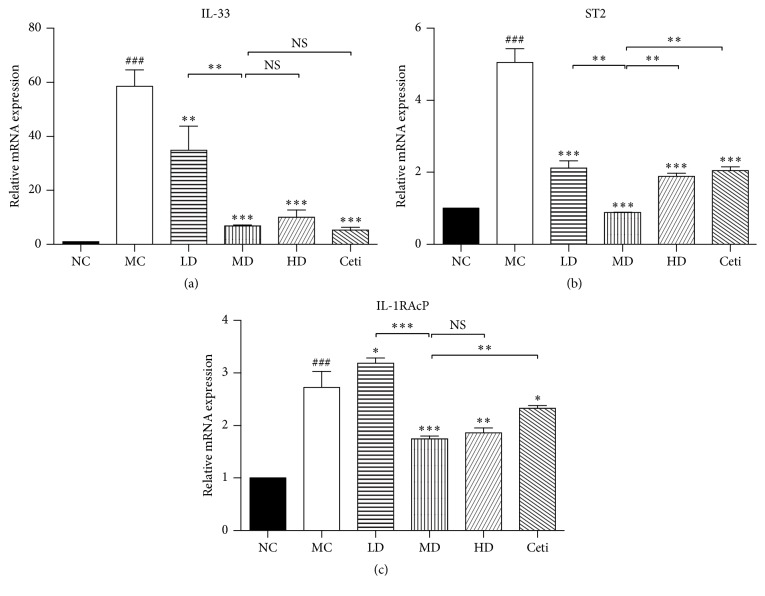
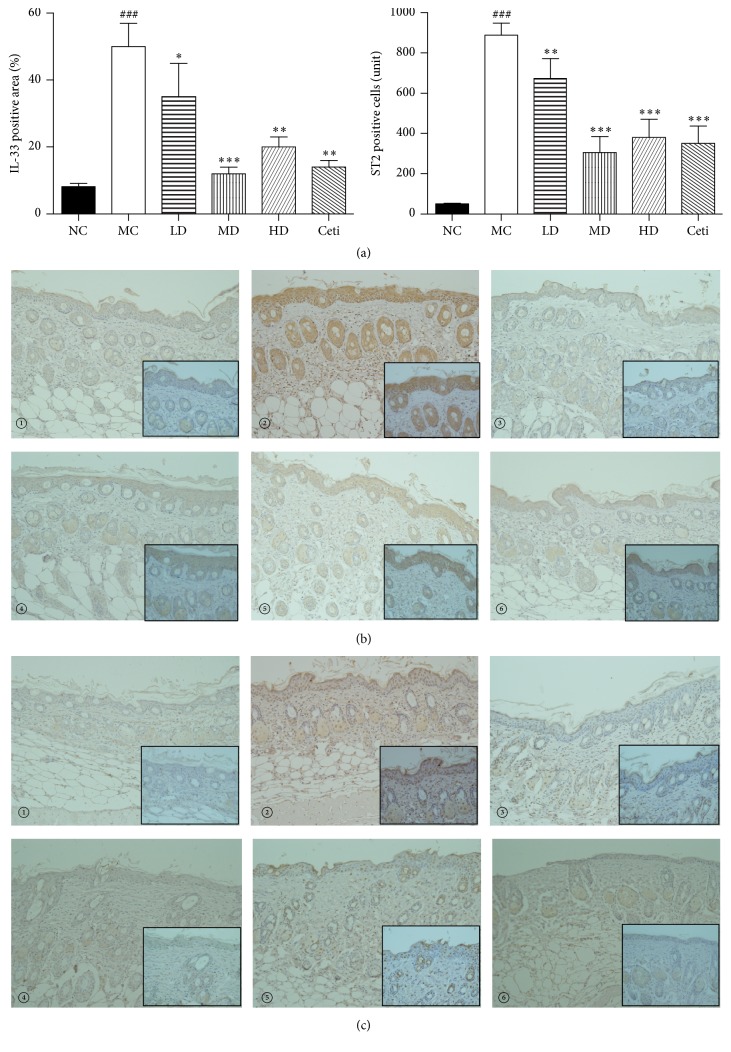
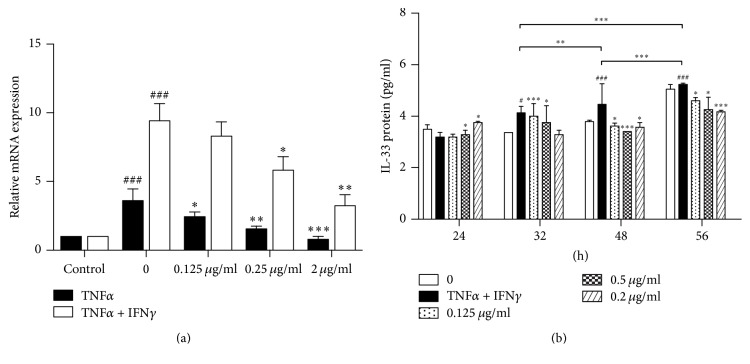
To evaluate the anti-inflammatory activities of QRQS against AD and the inhibitory molecular mechanisms of IL-33/ST2 signal transduction, BALB/c mice were divided into six groups (normal control, OVA control, low-dose of QRQS, middle-dose of QRQS, high-dose of QRQS, and cetirizine) and epicutaneously exposed to ovalbumin or PBS for 3 weeks and treated with QRQS for 2 weeks. Skin biopsies and blood samples were obtained for histological study, antibody analysis, and RNA isolation. HaCaT cells, stimulated by TNF-α and IFN-γ, were treated with QRQS to evaluate mRNA and protein expression by RT-PCR and ELISA. QRQS decreased both epidermal and dermal thickness, alleviated dermatitis, and reduced IL-33 and ST2 positive cell numbers. The concentration of specific IgE, IgG, IgG1, and IgG2a antibodies in serum and the expression of IL-33, ST2, IL-1RAcP, IL-4, and IL-13 mRNA in the skin were suppressed. No significant difference exists in TNF-α or IFN-γ. QRQS decreased IL-33 mRNA and protein secretion in HaCaT cells exposed to TNF-α and IFN-γ in a time- and concentration-dependent manner. QRQS regulates related molecule expression of ovalbumin-induced dermatitis involved in the IL-33/ST2 signaling axis in the treatment of acute AD.


Figures

Figure 1
Figure 1
HPLC chromatogram of three index components and QRQS sample. (a) Representative HPLC chromatogram of three index components solution. (b) The chromatogram of three index components in QRQS sample.
Figure 2
Figure 2
Sensitization protocol. BALB/c mice were exposed to OVA (100 μg/mL) or PBS applied in 100 μL to a sterile patch. The experiment comprised a total of three 1-week exposures separated by a 2-week resting interval. Medicines were administered from the 36th day lasting for 2 weeks. All tests were performed at the end of the third sensitization, and the blood and skin biopsies were taken.
Figure 3
Figure 3
Effects of QRQS on the development of AD in BALB/c mice. (a) Dermatitis score, dermatitis area, and scratching frequency are significantly decreased after treatment with QRQS as compared to the model control. (b) Dermatitis on BALB/c mice dorsal skin. (c) H&E sections from each group. Represented sections are shown at ×200 magnification. Data are expressed as means ± SEMs for each group of 10 rats. Asterisks denote a significant difference: P < 0.05, ∗∗P < 0.01, and ∗∗∗P < 0.001 for QRQS-treated group versus MC group; ###P < 0.001 for MC group versus normal group.
Figure 4
Figure 4
Changes in the antigen-specific antibody response in mice after treatment with QRQS or cetirizine (n = 10 for each). All the above antigens were increased after OVA induction and decreased after treatment with QRQS and cetirizine. The level of antibodies was determined by ELISA. The data are shown as mean ± SEMs. NS: not statistically significant; #P < 0.05, ###P < 0.001, MC compared with NC; P < 0.05, ∗∗P < 0.01, and ∗∗∗P < 0.001, as compared to MC by LSD test.
Figure 5
Figure 5
mRNA expression of cytokines in mice skin after treatment with QRQS or cetirizine. RT-PCR was used to analyze the mRNA expression levels. Relative unit (RU) is expressed as fold differences relative to the calibrator. Statistical results were expressed as mean ± SEMs. ###P < 0.001, ##P < 0.05, MC compared with NC; P < 0.05, ∗∗P < 0.01, and ∗∗∗P < 0.001 compared with MC; NS: not statistically significant.
Figure 6
Figure 6
The effects of different concentrations of QRQS decoction on the expression of IL-33 mRNA (a) and its receptor IL-1RAcP (b), ST2 (c). Statistical results were expressed as mean ± SEMs, ###P < 0.001, compared with the normal group; P < 0.05, ∗∗P < 0.01, and ∗∗∗P < 0.001 compared with the model group.
Figure 7
Figure 7
(a) Results of immunohistochemical detection of IL-33 positive area and ST2 positive cells (×200). High magnification photo is in the black square frame (×400). Statistical results were expressed as mean ± SEMs, ###P < 0.001 compared with the normal group; P < 0.05, ∗∗P < 0.01, and ∗∗∗P < 0.001 compared with the model group. (b) Detection of the expression of IL-33 protein in mouse dorsal skin tissue by immunohistochemistry. (c) Detection of the expression of ST2 protein in mouse dorsal skin tissue by immunohistochemistry. (①): normal control group; (②): model control group; (③): low-dose QRQS group; (④): middle-dose QRQS group; (⑤): high-dose QRQS group; (⑥): cetirizine medicine group.
Figure 8
Figure 8
(a) Effect of QRQS on TNF-α– or TNF-α +IFN-γ-induced HaCaT cells to produce IL-33 mRNA and protein. TNF-α (50 ng/mL) or TNF-α (50 ng/mL) + IFN-γ (50 ng/mL) stimulated HaCaT cells were cultured with different concentrations of QRQS solution for 24 h. RT-PCR was used to detect the IL-33 mRNA secretion. (b) The influence of different time points in different concentration decoctions on the expression of the IL-33 protein. The TNF-α (50 ng/mL) + IFN-γ (50 ng/mL) combined with HaCaT cells were treated with different concentrations (0.125 g/mL, 0.5 g/mL, and 2.0 g/mL) of QRQS, and, at different time points (24, 32, 48, and 56 h), supernatants were collected. The IL-33 protein expression was detected by ELISA. The data are shown as mean ± SEMs, ###P < 0.001, compared with the blank group; P < 0.05, ∗∗P < 0.01, and ∗∗∗P < 0.001, compared with the model group.

Similar articles

Cited by

References

    1. Zeppa L., Bellini V., Lisi P. Atopic dermatitis in adults. Dermatitis. 2011;22(1):40–46. doi: 10.2310/6620.2011.10042. - DOI - PubMed
    1. Du H.-Y., Fu H.-Y., Li D.-N., Qiao Y., Wang Q.-W., Liu W. The expression and regulation of interleukin-33 in human epidermal keratinocytes: a new mediator of atopic dermatitis and its possible signaling pathway. Journal of Interferon and Cytokine Research. 2016;36(9):552–562. doi: 10.1089/jir.2015.0159. - DOI - PubMed
    1. Boguniewicz M., Leung D. Y. M. Atopic dermatitis: a disease of altered skin barrier and immune dysregulation. Immunological Reviews. 2011;242(1):233–246. doi: 10.1111/j.1600-065x.2011.01027.x. - DOI - PMC - PubMed
    1. Eichenfield L. F., Tom W. L., Chamlin S. L., et al. Guidelines of care for the management of atopic dermatitis: section 1. Diagnosis and assessment of atopic dermatitis. Journal of the American Academy of Dermatology. 2014;70(2):338–351. doi: 10.1016/j.jaad.2013.10.010. - DOI - PMC - PubMed
    1. Thomsen S. F. Atopic dermatitis: natural history, diagnosis, and treatment. ISRN Allergy. 2014;2014:7. doi: 10.1155/2014/354250.354250 - DOI - PMC - PubMed

LinkOut - more resources