Review
. 2017 Jul;5(4):10.1128/microbiolspec.funk-0051-2016.
doi: 10.1128/microbiolspec.FUNK-0051-2016.

Ploidy Variation in Fungi: Polyploidy, Aneuploidy, and Genome Evolution

Affiliations
Review

Ploidy Variation in Fungi: Polyploidy, Aneuploidy, and Genome Evolution

Robert T Todd et al. Microbiol Spectr. 2017 Jul.

Abstract

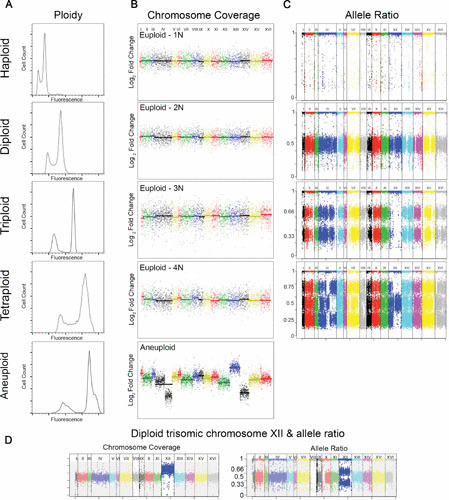
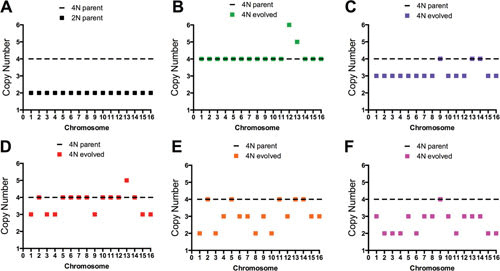
The ability of an organism to replicate and segregate its genome with high fidelity is vital to its survival and for the production of future generations. Errors in either of these steps (replication or segregation) can lead to a change in ploidy or chromosome number. While these drastic genome changes can be detrimental to the organism, resulting in decreased fitness, they can also provide increased fitness during periods of stress. A change in ploidy or chromosome number can fundamentally change how a cell senses and responds to its environment. Here, we discuss current ideas in fungal biology that illuminate how eukaryotic genome size variation can impact the organism at a cellular and evolutionary level. One of the most fascinating observations from the past 2 decades of research is that some fungi have evolved the ability to tolerate large genome size changes and generate vast genomic heterogeneity without undergoing canonical meiosis.


Figures

FIGURE 1
FIGURE 1
Methods for detection of ploidy and aneuploidy. (A) Ploidy is determined with flow cytometry. Total genome fluorescence, measured using a fluorescent nucleotide label (e.g., propidium iodide or Sytox Green). Cells are first fixed (in ethanol) and RNA is removed with RNase, then genomic DNA is fluorescently labeled and analyzed on a flow cytometer. Cells are passed through a laser, and the number of cells are plotted as a function of fluorescence intensity. Cells in a population typically have two fluorescent peaks, representing cells in either G1 or G2 phases of the cell cycle. Flow cytometry plots for yeast with the following ploidy levels are shown: haploid (1N), diploid (2N), triploid (3N), tetraploid (4N), and a near-tetraploid aneuploid. (B) Chromosome copy number is determined with WGS and microarray aCGH. The y axis represents a log2 fold change of sequence reads relative to the reference sequence and chromosome number increases from left to right starting with chromosome I and ending with chromosome XVI (x axis). Chromosome copy number plots for S. cerevisiae with the following ploidy levels indicate euploid genome for haploid (1N), diploid (2N), triploid (3N), and tetraploid (4N). However, the near-tetraploid isolate (bottom panel) is aneuploid for ChrXII (pentasomic) and ChrXIV (trisomic) and contains a segmental aneuploidy of ChrIV. Figures generated from data obtained in reference . (C) Allele frequencies obtained from WGS data also can be used to determine the ploidy of a strain. The y axis shows the heterozygous allele frequencies ranging from zero to one, plotted as a function of chromosome number starting with chromosome I and ending with chromosome XVI (x axis). Allele frequency plot of the example haploid strain with single nucleotide polymorphisms (SNPs) at allele frequencies at 1.0; a diploid strain with SNPs at allele frequencies of 0.5 and 1.0; a triploid strain with SNPs at allele frequencies of 0.33 and 0.66; and a tetraploid strain with SNPs at allele frequencies at 0.25, 0.5, 0.75, and 1.0. Images obtained from reference . (D) A diploid strain that is trisomic (three copies of a chromosome) for chromosome XII (left panel). Interestingly, the allele frequency plot has SNPs at allele frequencies of 0.5 and 1.0 for all chromosomes except ChrXII, which is at allele frequencies of 0.33 and 0.66, supporting that this chromosome is aneuploid (right panel).
FIGURE 2
FIGURE 2
Many polyploid-evolved clones are highly aneuploid. Chromosome copy number was determined by WGS and plotted for the (A) parental diploid (2N) and tetraploid (4N) strains and different tetraploid evolved clones after 250 generations in raffinose medium. Adaptation resulted in clones with (B) increased chromosome copies, (C) approximately trisomic copies of every chromosome (∼3N), or (D-F) highly aneuploid genomes. Figures generated from data obtained from the supplementary data Table 1 in reference .

Similar articles

Cited by

References

    1. Otto SP, Whitton J. 2000. Polyploid incidence and evolution. Annu Rev Genet 34:401–437 10.1146/annurev.genet.34.1.401. [PubMed] - DOI - PubMed
    1. Otto SP. 2007. The evolutionary consequences of polyploidy. Cell 131:452–462 10.1016/j.cell.2007.10.022. - DOI - PubMed
    1. Sémon M, Wolfe KH. 2007. Consequences of genome duplication. Curr Opin Genet Dev 17:505–512 10.1016/j.gde.2007.09.007. [PubMed] - DOI - PubMed
    1. Albertin W, Marullo P. 2012. Polyploidy in fungi: evolution after whole-genome duplication. Proc Biol Sci 279:2497–2509 10.1098/rspb.2012.0434. [PubMed] - DOI - PMC - PubMed
    1. Garcia AM. 1964. Studies on DNA in leucocytes and related cells of mammals. IV. The feulgen-DNA content of peripheral leucocytes, megakaryocytes and other bone marrow cell types of the rabbit. Acta Histochem 17:246–258. [PubMed] - PubMed

Publication types

LinkOut - more resources