. 2017 Sep 26;17(19):3246-3257.
doi: 10.1039/c7lc00633k.

Multimode smartphone biosensing: the transmission, reflection, and intensity spectral (TRI)-analyzer

Affiliations

Multimode smartphone biosensing: the transmission, reflection, and intensity spectral (TRI)-analyzer

Kenneth D Long et al. Lab Chip. .

Abstract

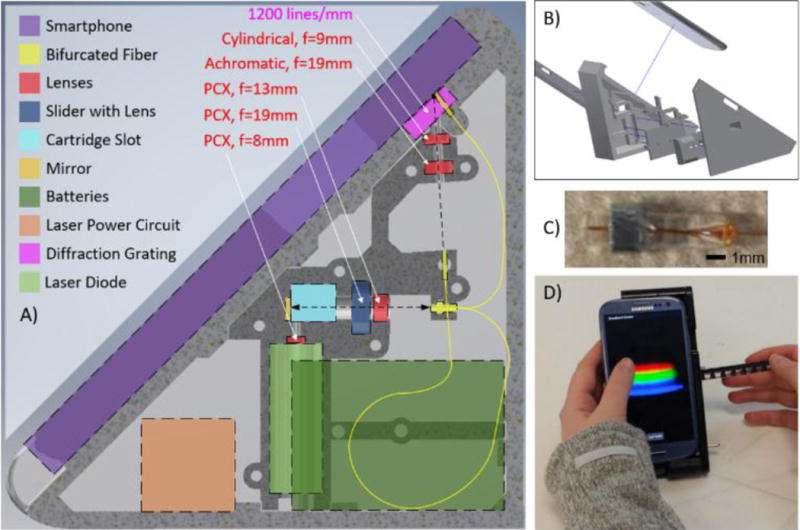
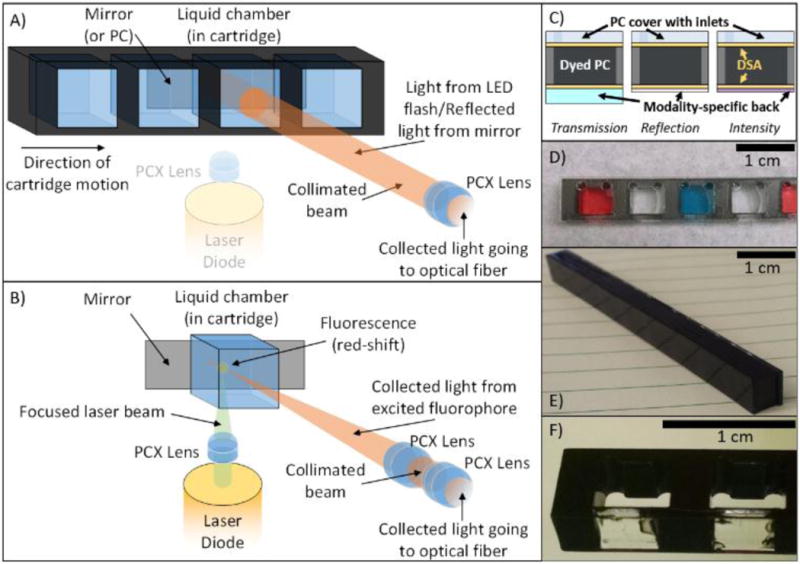
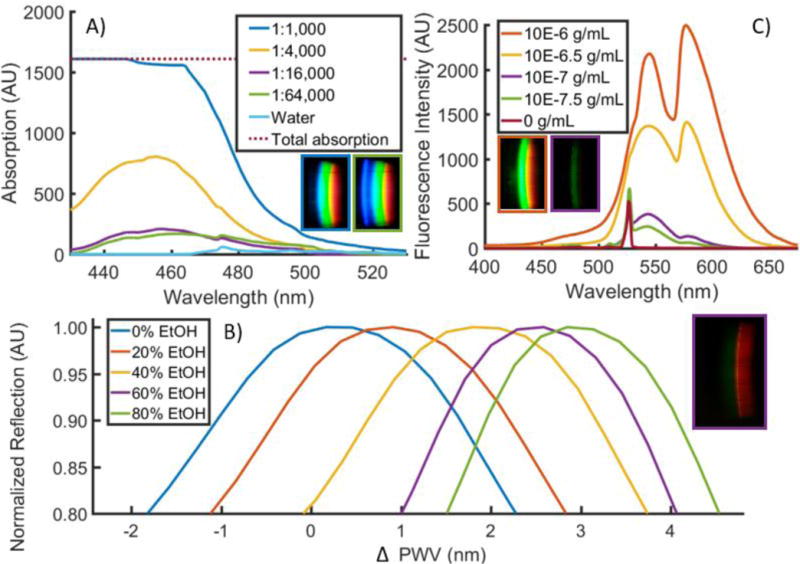
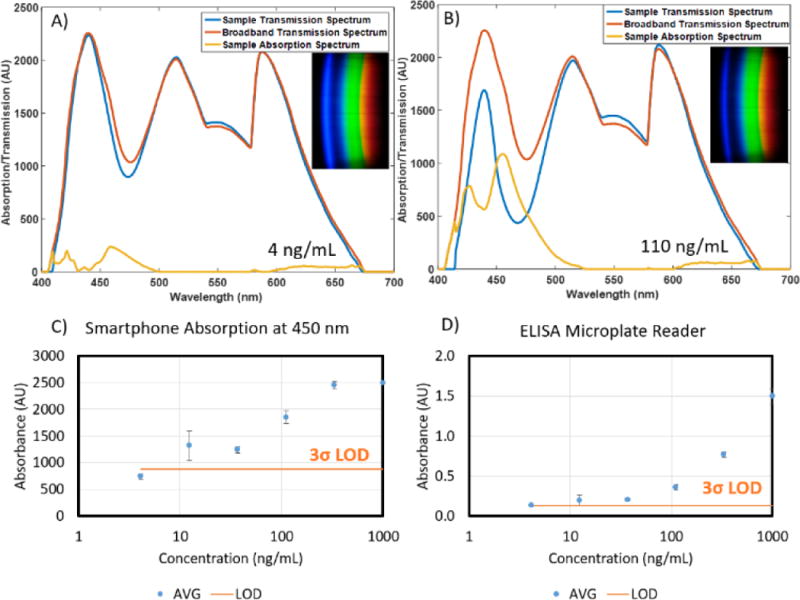
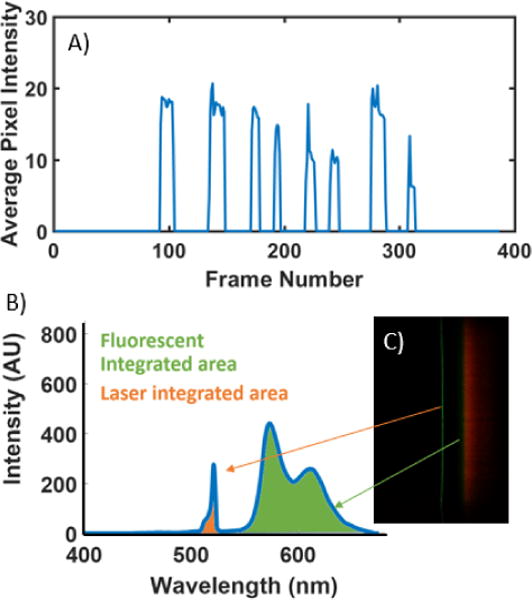
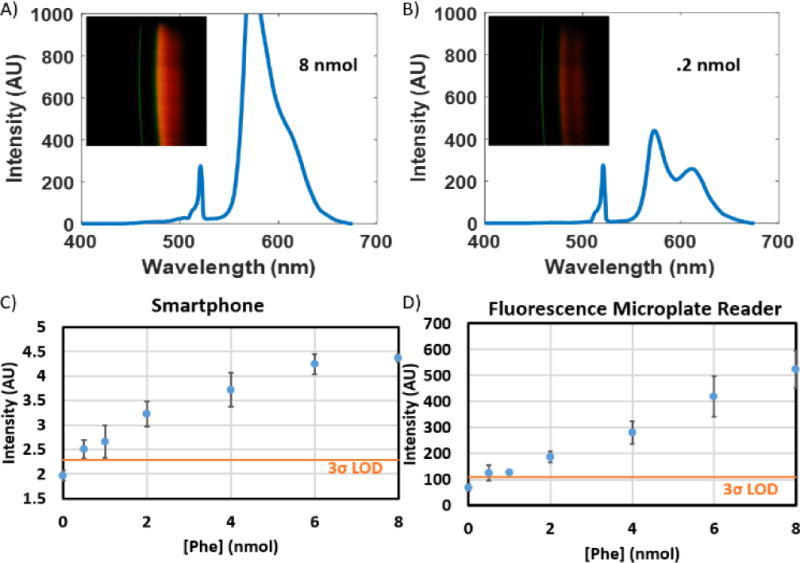
We demonstrate a smartphone-integrated handheld detection instrument capable of utilizing the internal rear-facing camera as a high-resolution spectrometer for measuring the colorimetric absorption spectrum, fluorescence emission spectrum, and resonant reflection spectrum from a microfluidic cartridge inserted into the measurement light path. Under user selection, the instrument gathers light from either the white "flash" LED of the smartphone or an integrated green laser diode to direct illumination into a liquid test sample or onto a photonic crystal biosensor. Light emerging from each type of assay is gathered via optical fiber and passed through a diffraction grating placed directly over the smartphone camera to generate spectra from the assay when an image is collected. Each sensing modality is associated with a unique configuration of a microfluidic "stick" containing a linear array of liquid chambers that are swiped through the instrument while the smartphone captures video and the software automatically selects spectra representative of each compartment. The system is demonstrated for representative assays in the field of point-of-care (POC) maternal and infant health: an ELISA assay for the fetal fibronectin protein used as an indicator for pre-term birth and a fluorescent assay for phenylalanine as an indicator for phenylketonuria. In each case, the TRI-analyzer is capable of achieving limits of detection that are comparable to those obtained for the same assay measured with a conventional laboratory microplate reader, demonstrating the flexibility of the system to serve as a platform for rapid, simple translation of existing commercially available biosensing assays to a POC setting.


Figures

Figure 1
Figure 1
Design of Spectral TRI-Analyzer. A) Schematic of internal layout for optical and electrical components. A custom bifurcated fiber (100um core with d=1.8 mm glass capillary tube (proximal) and 2× d=1.25 mm ceramic ferrules, Coastal Connections) was used to compact the light path into a handheld device. Fiber is arranged to maximize bend radius, increasing long-term stability. B) 3D CAD model was created, comprised of 5 plastic parts printed via stereolithography. Two halves of optical housing maintain lens alignment and optical chamber isolation. All portions of cradle were designed to slide together and attach with M3×0.5 machine screws. C) Glass capillary tube with bifurcated fibers and metal nut used to align the fiber in the cradle. D) Image of final device in use with absorption cartridge.
Figure 2
Figure 2
Two principal light paths and cartridges for each of the three modalities. A) Reflection (PC-only) and Transmission (absorption or PC) optical pathway. Collimated light from the on-board smartphone flash is directed through the sample chamber. For reflection-based PC measurements, a back-coated cartridge prevents transmitted light from being collected. For transmission measurements, light is reflected by cradle mirror directed toward the collection fiber. B) Fluorescence/Luminescence Intensity optical pathway. A laser pointer diode is co-focused to a point near the back-side of the cartridge where the collection fiber is similarly focused via addition of a single plano-convex lens into the optical path via a SLA-printed slider actuated from outside the cradle. Additional cartridge wells/housing was removed for clarity in B). C) “Sandwich” style cartridge fabrication alternating plastic or glass substrates with double-sided-adhesive (DSA) showing how different backings facilitate different modalities. D) Transmission cartridge showing inlet/outlets and optically-isolated chambers. E) Dyed PC for label-free Reflection measurements. F) Close-up of Intensity cartridge demonstrating selectively-dyed cartridge body allowing for bottom-illumination with 532 nm laser diode.
Figure 3
Figure 3
Qualitative proof-of-concept of 3 principal modalities. A) Transmission. Yellow food dye was diluted in water at concentrations ranging from 1:1,000 to 1:64,000, a 64× concentration range. Absorption was measured by subtracting sample transmission from that of water. Observable absorption occurred in the blue region (400–500nm) of the spectrum. Inset raw images correspond to concentration of yellow dye of their outline. B) Reflection. 0–80% mixtures of ethanol in water were prepared and introduced into a PC-based cartridge, producing narrowband reflection in the 580 nm range. Measurements of each cartridge chamber filled with water were subtracted from measurements of those chambers filled with ethanol solutions to produce ΔPWV shifts. Inset raw image corresponds to concentration of ethanol of its outline. A central line of pixels was used to produce spectra shown. C) Intensity. R6G dye was diluted in water and excited with the on-board laser diode. Inset raw images correspond to concentration of R6G of their outline.
Figure 4
Figure 4
Spectrum Processing. A) Boundary of the red channel is found in every row of the image and a circle is fit (B). C) Straightened spectral image used to generate a single data spectrum. D) Laser pointers are used to determine pixel-to-wavelength conversion as reported previously.
Figure 5
Figure 5
A) and B) Sample transmission spectra, absorption spectra, and raw RGB image data (insets) for 4 and 110 ng/mL samples of fFN, respectively. C) and D) Comparative dose-response curves for spectral TRI-analyzer and 96-well microplate reader. Standard concentrations from 4 to 1000 ng/mL were assayed along with a human serum sample spiked at 50 ng/mL (not shown). Limit of detection was determined as 3 standard deviations over the mean of zero concentration standard (n=3).
Figure 6
Figure 6
Bland-Altman Analysis of Spectral TRI-Analyzer compared with standard microplate reader for readout of fFN assay. A variation on the standard Bland-Altman method using the geometric mean and log difference was applied to all non-zero values for each assay (Bland). The log differences showed a dependence on the magnitude of the measurement, so a regressive approach was used to model the relation, as described by Bland (mean of regression shown with dashed line). ±1.96 S.D. limits of agreement are shown as solid lines.
Figure 7
Figure 7
Video Processing and Normalization. A) Average pixel intensity of a data-collection video showing clear demarcation of 8 sample wells. B and C) Example fluorescent spectrum showing regions used to normalize the data.
Figure 8
Figure 8
Bland-Altman Analysis of Spectral TRI-Analyzer compared with standard microplate reader for readout of phenylalanine assay. A variation on the standard Bland-Altman method using the geometric mean and log difference was applied to all non-zero values for each assay (Bland). The log differences showed a dependence on the magnitude of the measurement, so a regressive approach was used to model the relation, as described by Bland (mean of regression shown with dashed line). One point was found to be outside the ±1.96 S.D. limits of agreement (solid lines).
Figure 9
Figure 9
Results of Phenylketonuria Assay. A) and B) Sample transmission spectra, absorption spectra, and raw RGB image data (insets) for .8 and .2 nmol samples of phenylalanine, respectively. C) and D) Comparative dose-response curves for spectral TRI-analyzer and 96-well microplate reader. Standard concentrations from 0 to 8 nmol were assayed. Limit of detection was determined as 3 standard deviations over the mean of zero concentration standard (n=3).

Similar articles

Cited by

References

    1. Frost & Sullivan. Global Battery Market for Wearables. 2016
    1. Soper SA, Brown K, Ellington A, Frazier B, Garcia-Manero G, Gau V, Gutman SI, Hayes DF, Korte B, Landers JL, Larson D, Ligler F, Majumdar A, Mascini M, Nolte D, Rosenzweig Z, Wang J, Wilson D. Biosens Bioelectron. 2006;21:1932–1942. - PubMed
    1. Kirkwood J. The Next Step for Molecular Point-of-Care Testing. 2016
    1. Bissonnette L, Bergeron MG. Clinical Microbiology and Infection. 2016;16:1044–1053. - PubMed
    1. Chin CD, Linder V, Sia SK. Lab Chip. 2012;12(12):2118–34. - PubMed

Publication types