. 2017 Sep;19(9):3660-3673.
doi: 10.1111/1462-2920.13867. Epub 2017 Aug 14.

Genomic insights into specialized metabolism in the marine actinomycete Salinispora

Affiliations

Genomic insights into specialized metabolism in the marine actinomycete Salinispora

Anne-Catrin Letzel et al. Environ Microbiol. 2017 Sep.

Abstract

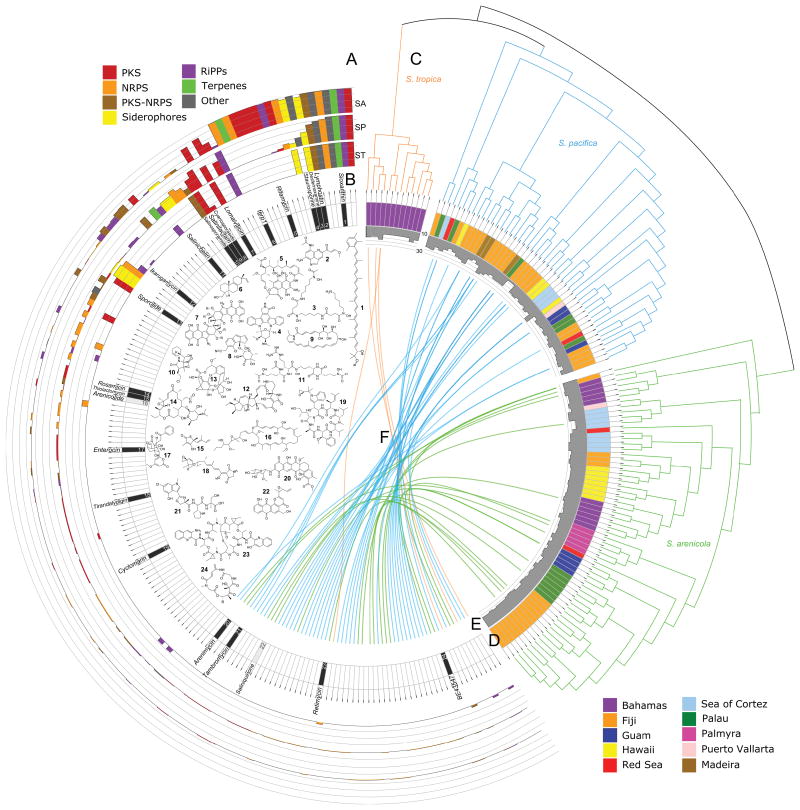
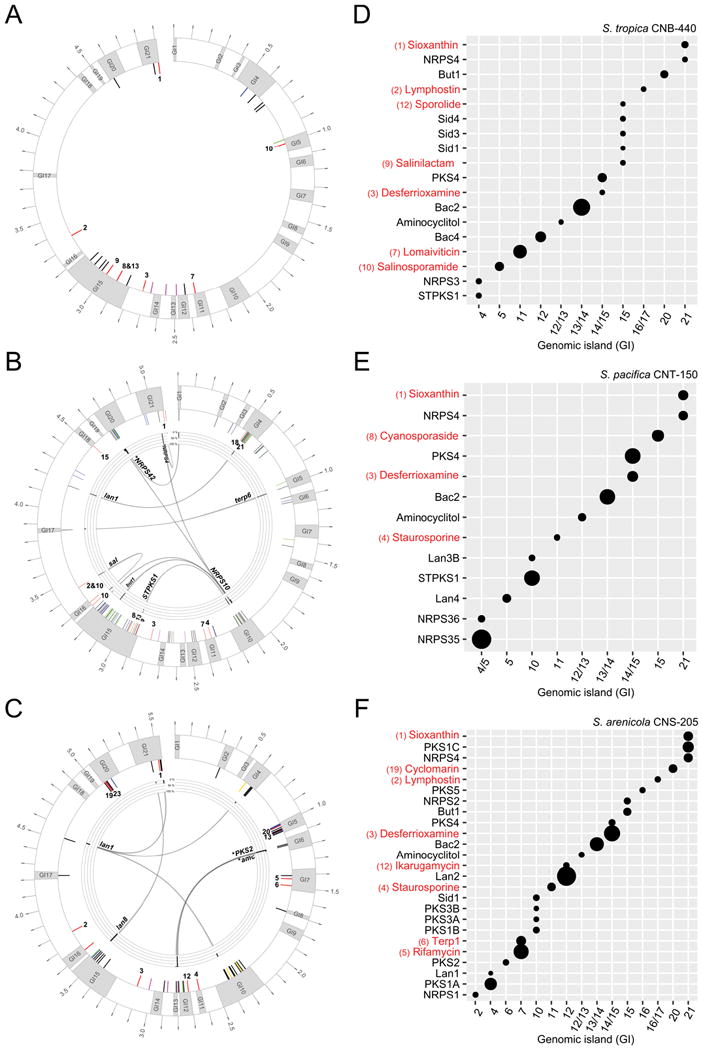
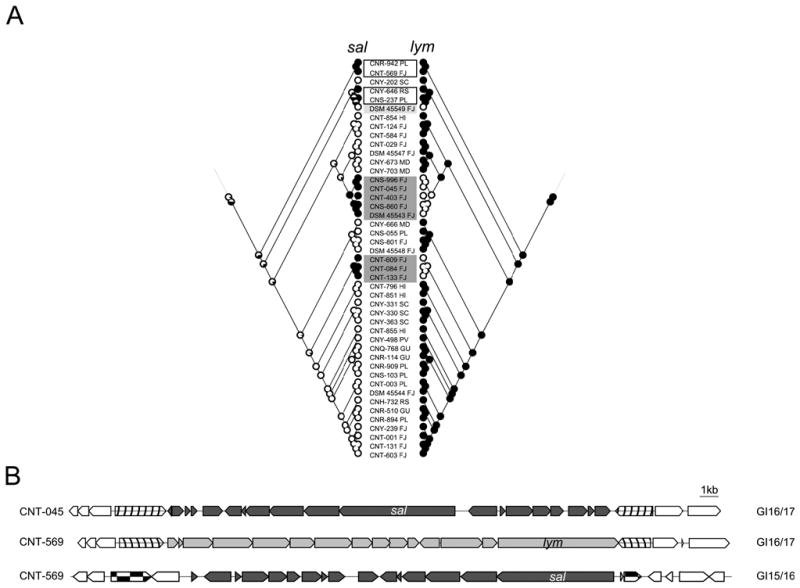
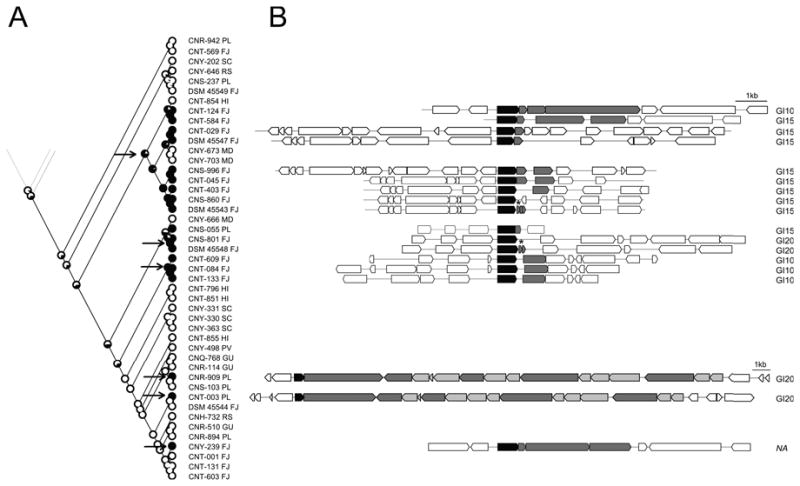
Comparative genomics is providing new opportunities to address the diversity and distributions of genes encoding the biosynthesis of specialized metabolites. An analysis of 119 genome sequences representing three closely related species of the marine actinomycete genus Salinispora reveals extraordinary biosynthetic diversity in the form of 176 distinct biosynthetic gene clusters (BGCs) of which only 24 have been linked to their products. Remarkably, more than half of the BGCs were observed in only one or two strains, suggesting they were acquired relatively recently in the evolutionary history of the genus. These acquired gene clusters are concentrated in specific genomic islands, which represent hot spots for BGC acquisition. While most BGCs are stable in terms of their chromosomal position, others migrated to different locations or were exchanged with unrelated gene clusters suggesting a plug and play type model of evolution that provides a mechanism to test the relative fitness effects of specialized metabolites. Transcriptome analyses were used to address the relationships between BGC abundance, chromosomal position and product discovery. The results indicate that recently acquired BGCs can be functional and that complex evolutionary processes shape the micro-diversity of specialized metabolism observed in closely related environmental bacteria.


Conflict of interest statement

The authors declare no conflict of interest.

Figures

Figure 1
Figure 1
Salinispora specialized metabolism. A) Outer three circular bar graphs show the relative abundance of each BGC in the three Salinispora species arranged counter-clockwise in decreasing order by genus (scale = 0-100% of strains, lines at 25% intervals, SA = S. arenicola, SP = S. pacifica, ST = S. tropica). Bar colors indicate BGC type (see legend). Only the first four BGCs occur in all 176 stains. B) Inner circle shows the BGCs for which the products are confirmed (black) or predicted (grey) with the corresponding chemical structures numbered and named: 1 sioxanthin, 2 lymphostin, 3 desferrioxamine B, 4 staurosporine, 5 rifamycin S, 6 diterpene, 7 lomaiviticin A, 8 cyanosporaside A, 9 salinilactam, 10 salinosporamide A, 11 salinichelin A, 12 ikarugamycin, 13 sporolide A, 14 rosamicin A, 15 thiolactomycin, 16 arenicolide B, 17 enterocin, 18 tirandalydigin, 19 cyclomarin D, 20 arenimycin A, 21 tambromycin, 22 saliniquinone A, 23 retimycin A, 24 BE43547A1. C) Species phylogeny based on 876 concatenated genes (Millán-Aguiñaga et al., 2017). D) Location from which the strain was isolated (see legend). E) Histogram shows number of BGCs per strain (scale = 10-30). F) Plot linking strains on the right with BGCs on left. Colored links show “singletons” with the corresponding species (orange = S. tropica, blue = S. pacifica, green = S. arenicola).
Figure 2
Figure 2
Pan-chromosomes. A) S. tropica, B) S. pacifica, and C) S. arenicola drawn with dnaA at the 12:00 position. Outer ring: genomic islands are shown in gray (labeled GI1-21), outer scale indicates size in Mb. Inner ring: positions of mapped BGCs. Those with known products are in red, genus-specific BGCs in pink, S. arenicola specific BGC in yellow, doubletons in green and singletons in blue. Inner ring: percent occurrence of each BGC at that site. Numbers correspond to compounds experimentally linked to their respective BGC as defined in Fig. 1. Expression profiles of BGCs in D) S. tropica CNB-440, E) S. pacifica CNT-150 (DSM 45549) and F) S. arenicola CNS-205. Size of circle corresponds to level of expression in stationary phase. Only expressed BGCs (those above the threshold) are indicated with a circle. BGCs with known products are shown in red (numbering as defined in Fig. 1). Genomic position (x-axis) is indicated by GI number or inter-island location.
Figure 3
Figure 3
Exchange of sal and lym BGCs in S. pacifica. A) Mirrored likelihood analyses of sal (left) and lym (right) BGCs in S. pacifica. These analyses predict that lym was present in the common ancestor of the genus while sal was acquired more recently in at least four separate events. Grey shaded boxes indicate strains in which the lym BGC was replaced by sal. Black un-shaded boxes indicate four strains that have both BGCs (CNR-942, CNT-569, CNY-646 and CNS-237), whereas the light grey box indicates the only strain lacking both BGCs (DSM 45549). B) For strains containing either sal or lym, the BGCs are located in the same inter-island region between GI16 and GI17 as exemplified here by sal in strains CNT-045 and lym in CNT-569. For strains containing both Sal and lym, lym is located in the normal conserved position (GI16/GI17) while sal is located in the inter-island region between GI15 and GI16 as exemplified by strain CNT-569. SC: Sea of Cortez, PV: Puerto Vallarta, RS: Red Sea, FJ: Fiji, HI: Hawaii, PM: Palmyra, GU: Guam, PL: Palau, MD: Madeira archipelago).
Figure 4
Figure 4
NRPS10 degradation in S. pacifica. A) Likelihood analysis for the conserved regulatory gene predicts six independent acquisition events (arrows). Abbreviations after strain number indicate isolation site of the strain (PL: Palau, FJ: Fiji, RS: Red Sea, HI: Hawaii, MD: Madeira archipelago, SC: Sea of Cortez, PV: Puerto Vallarta, GU: Guam) B) NRPS10 gene cluster organization. The “complete” BGC is observed in CNT-003 and CNR-909. The conserved regulator gene is shown in black, NRPS related genes in dark gray, tailoring enzymes in light gray and flanking genes in white. Position of BGC in genome shown next to cluster. GI: genomic island, NA: GI could not be assigned, *annotated as pseudogene.

References

    1. Abdelmohsen UR, Grkovic T, Balasubramanian S, Kamel MS, Quinn RJ, Hentschel U. Elicitation of secondary metabolism in actinomycetes. Biotechnol Adv. 2015;33:798–811. - PubMed
    1. Asolkar RN, Freel KC, Jensen PR, Fenical W, Kondratyuk TP, Park EJ, Pezzuto JM. Arenamides A-C, cytotoxic NF-κ-B inhibitors from the marine actinomycete Salinispora arenicola. J Nat Prod. 2009;72:396–402. - PMC - PubMed
    1. Awakawa T, Crüsemann M, Munguia J, Ziemert N, Nizet V, Fenical W, Moore BS. Salinipyrone and pacificanone are biosynthetic by-products of the rosamicin polyketide synthase. ChemBioChem. 2015;16:1443–1447. - PMC - PubMed
    1. Bentley SD, Chater KF, Cerdeno-Tarraga AM, Challis GL, Thomson NR, James KD, et al. Complete genome sequence of the model actinomycete Streptomyces coelicolor A3(2) Nature. 2002;417:141–147. - PubMed
    1. Berdy J. Bioactive microbial metabolites. A personal view. J Antibiot. 2005;58:1–26. - PubMed

MeSH terms

Substances